
4.2E: Modeling with Linear Functions (Exercises)
- Page ID
- 56077

24. Find the area of a triangle bounded by the \(y\) axis, the line \(f(x)=10-2 x,\) and the line perpendicular to \(f\) that passes through the origin.
25. A town's population increases at a constant rate. In 2010 the population was 55,000. By 2012 the population had increased to 76,000. If this trend continues, predict the population in 2016.
26. The number of people afflicted with the common cold in the winter months dropped steadily by 50 each year since 2004 until 2010. In 2004,875 people were inflicted. Find the linear function that models the number of people afflicted with the common cold \(C\) as a function of the year, \(t\). When will no one be afflicted?
For the following exercises, use the graph in Figure 1 showing the profit, \(y\), in thousands of dollars, of a company in a given year, \(x\), where \(x\) represents years since \(1980 .\)
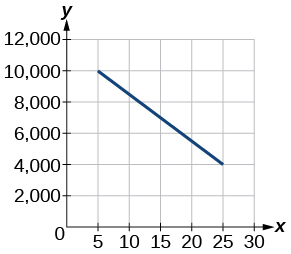
Figure 1
27. Find the linear function \(y,\) where \(y\) depends on \(x,\) the number of years since \(1980 .\)
28. Find and interpret the \(y\)-intercept.
For the following exercise, consider this scenario: In \(2004,\) a school population was \(1,700 .\) By 2012 the population had grown to 2,500
- Assume the population is changing linearly.
- How much did the population grow between the year 2004 and \(2012 ?\)
- What is the average population growth per year?
- Find an equation for the population, \(P\), of the school \(t\) years after 2004 .
For the following exercises, consider this scenario: In \(2000,\) the moose population in a park was measured to be \(6,500 .\) By \(2010,\) the population was measured to be \(12,500 .\) Assume the population continues to change linearly.
30. Find a formula for the moose population, \(P\).
31. What does your model predict the moose population to be in \(2020 ?\)
For the following exercises, consider this scenario: The median home values in subdivisions Pima Central and East Valley (adjusted for inflation) are shown in Table \(1 .\) Assume that the house values are changing linearly.
| Year | Pima Central | East Valley |
|---|---|---|
| 1970 | 32,000 | 120,250 |
| 2010 | 85,000 | 150,000 |
32. In which subdivision have home values increased at a higher rate?
33. If these trends were to continue, what would be the median home value in Pima Central in \(2015 ?\)