
9.4: Phase Shift
- Page ID
- 41326

The last form of transformation we will discuss in the graphing of trigonometric functions is the phase shift, or horizontal displacement. So far, we have considered the amplitude, period and vertical shift transformations of trigonometric functions. In the standard equation \(y=A \sin (B x)+D,\) these corrrespond to the coefficients \(A, B\) and \(D .\) Notice that the amplitude and vertical shift coefficients \((A \text { and } D),\) which affect the \(y\) -axis occur outside of the trigonometric function, whereas the coefficient that affects the period of the graph along the \(x\) -axis occurs within the sine function. This is true of the phase shift as well.
If we consider a general equation of:
\[
y=A \sin (B x+C)+D
\]
the constant \(C\) will affect the phase shift, or horizontal displacement of the function. Let's look at a simple example.
Graph at least one period of the given function: \(\quad y=\sin (x+\pi)\) Be sure to indicate important points along the \(x\) and \(y\) axes.
Let's examine this function by looking at a table of values.

Now let's look at a graph of \(y=\sin (x+\pi)\) as compared to the standard graph of \(y=\sin x\)
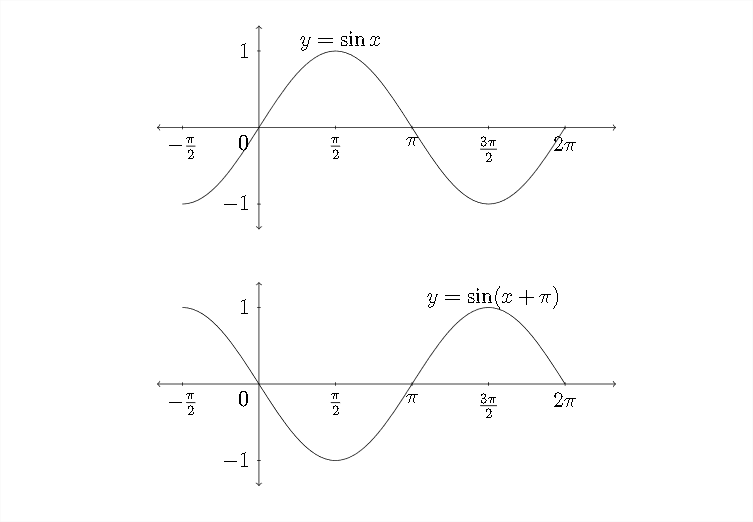
Notice that if we take the standard graph of \(y=\sin x\) and drag it backwards along the \(x\) -axis a distance of \(\pi,\) we would have the graph of \(y=\sin (x+\pi)\) That's because each \(x\) value is having \(\pi\) added to it, so to arrive at the \(x\) value that produces a particular \(y\) -value, we would need to subtract \(\pi\). Here's an example:

In the table above we see the standard \(x\) and \(y\) values for the graph of the sine function. In the table below, we add a column that shows the value that \(x\) would need to be for \(x+\pi\) to be the standard values:

Here's a graph of these values:
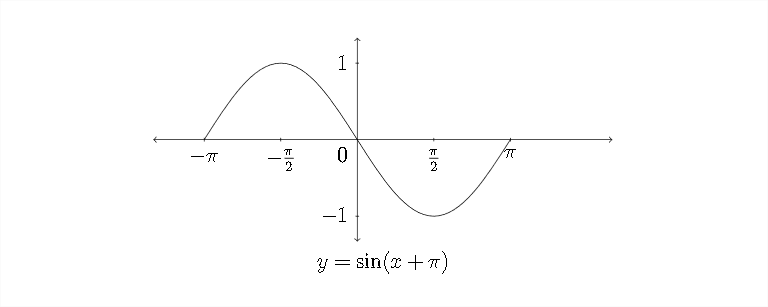
This is the same graph of \(y=\sin (x+\pi)\) that we saw on the previous page, but anchored to different points on the \(x\) -axis. Either graph would be a correct response to a question asking for at least one period of the graph of \(y=\sin (x+\pi)\)
Let's look at another example:
Example 2
Graph at least one period of the given function: \(y=\sin \left(x+\frac{\pi}{3}\right)\) Be sure to indicate important points along the \(x\) and \(y\) axes.
In this simplified example, we really have only one transformation to worry about - the phase shift. Notice that the amplitude, period and vertical shift have all been left out. When considering a sine or cosine graph that has a phase shift, a good way to start the graph of the function is to determine the new starting point of the graph. In the previous example, we saw how the function \(y=\sin (x+\pi)\)
shifted the graph a distance of \(\pi\) to the left and made the new starting point of the sine curve \(-\pi\)
In graphing the standard sine curve we're generally interested in the quadrantal angles that produce the maximum, minimum and zero points of the graph. In graphing the function \(y=\sin \left(x+\frac{\pi}{3}\right),\) we want to know which values of \(x\) will produce the quadrantal angles when we add \(\frac{\pi}{3}\) to them.
So, to determine the new starting point we want to know the solution to the equation \(x+\frac{\pi}{3}=0\)
\[
\qquad \begin{array}{r}
x+\frac{\pi}{3}=0 \\
-\frac{\pi}{3}-\frac{\pi}{3} \\
x=-\frac{\pi}{3}
\end{array}
\]
This is the new starting point for the graph \(y=\sin \left(x+\frac{\pi}{3}\right) .\) Because this graph has a standard period, the "jump" between each of the quadrantal angles will be
\(\frac{\pi}{2} .\) To graph one period of a typical trigonometric function we'll need at least five quadrantal angle values. So, if our new starting point is \(-\frac{\pi}{3}\), then the next critical value along the \(x\) -axis will be:
\[
-\frac{\pi}{3}+\frac{\pi}{2}=-\frac{2 \pi}{6}+\frac{3 \pi}{6}=\frac{\pi}{6}
\]
Then the subsequent critical values would be:
\[
\begin{array}{c}
\frac{\pi}{6}+\frac{\pi}{2}=\frac{\pi}{6}+\frac{3 \pi}{6}=\frac{4 \pi}{6}=\frac{2 \pi}{3} \\
\frac{4 \pi}{6}+\frac{3 \pi}{6}=\frac{7 \pi}{6} \\
\frac{7 \pi}{6}+\frac{3 \pi}{6}=\frac{10 \pi}{6}=\frac{5 \pi}{3}
\end{array}
\]
So the five critical values along the \(x\) -axis are:
\[
-\frac{2 \pi}{6}, \frac{\pi}{6}, \frac{4 \pi}{6}, \frac{7 \pi}{6} \text { and } \frac{10 \pi}{6}
\]
or, in reduced form:
\[
-\frac{\pi}{3}, \frac{\pi}{6}, \frac{2 \pi}{3}, \frac{7 \pi}{6} \text { and } \frac{5 \pi}{3}
\]
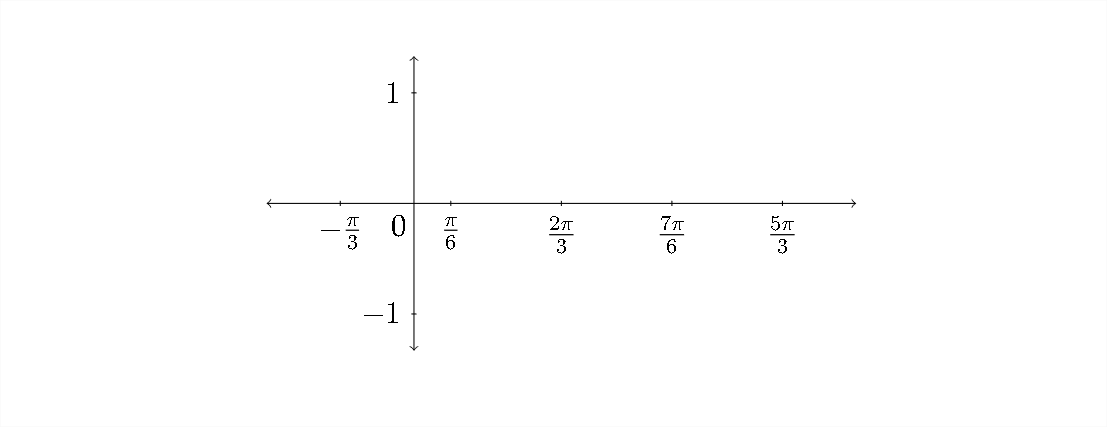
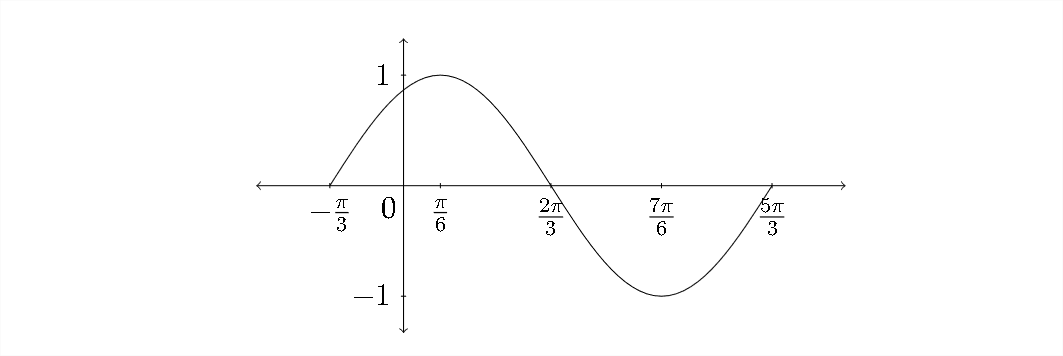
In order to graph the function, we would put these values along the \(x\) -axis and plot the standard quadrantal \(y\) -values to match up with them:
The \(y\) -values for the sine function start at zero, go up to the maximum, back down through zero to the minimum and then back to zero:
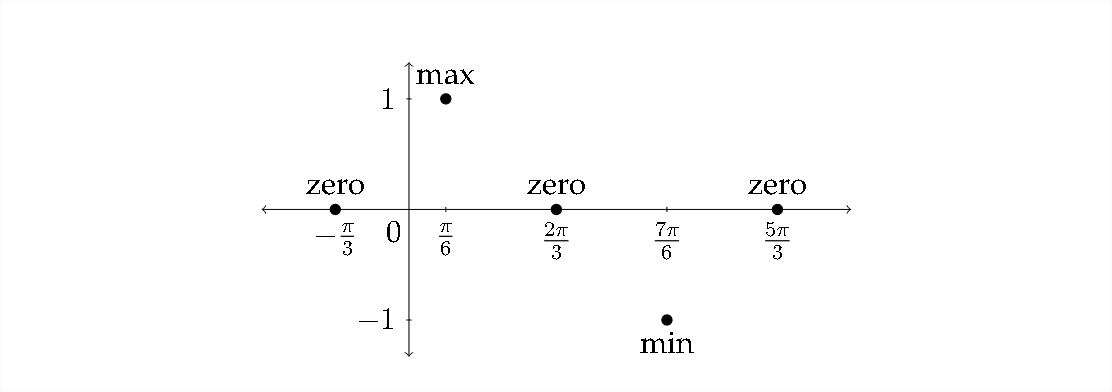
Connecting these points to make a sine curve produces the following graph:
Exercises 2.4
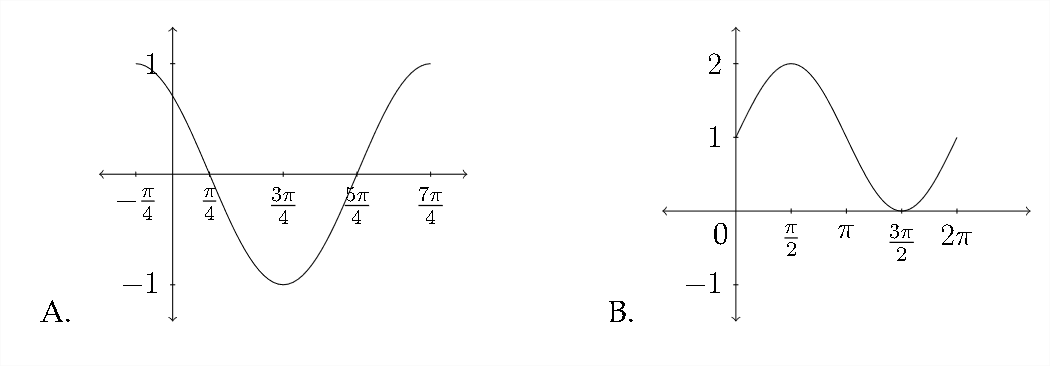
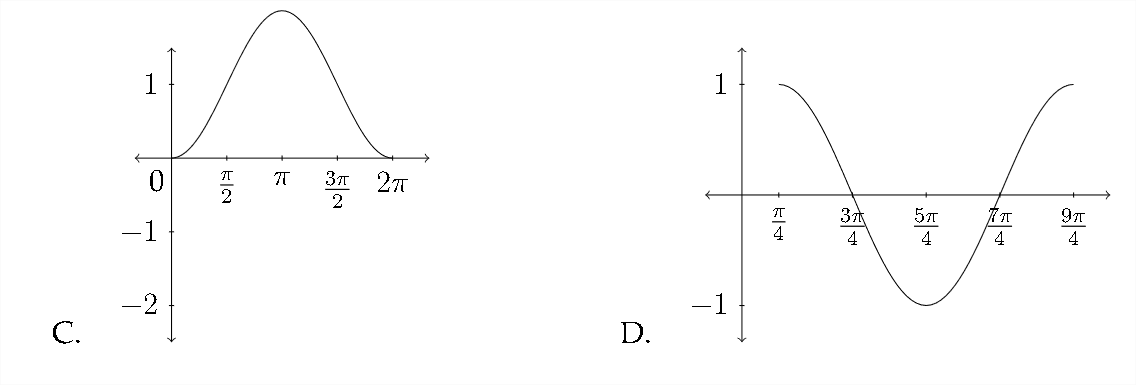
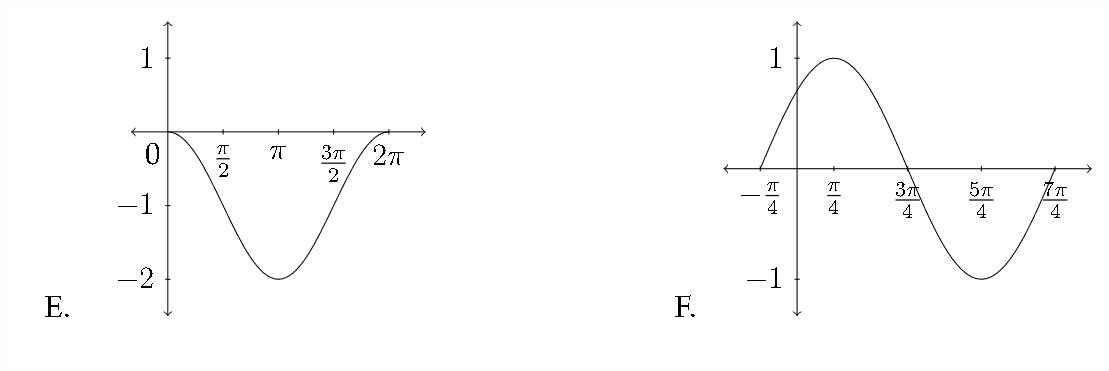
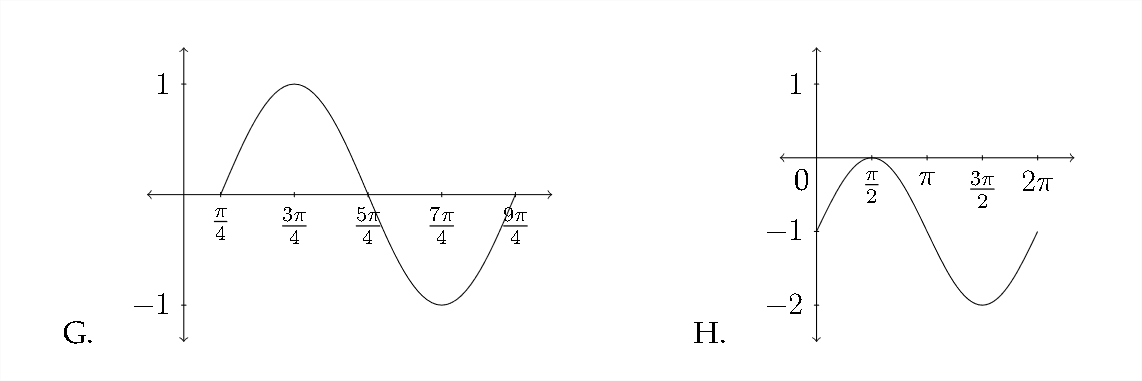
Match each function with the appropriate graph.
1. \(\quad y=\cos \left(x-\frac{\pi}{4}\right)\)
2. \(\quad y=\sin \left(x+\frac{\pi}{4}\right)\)
3. \(\quad y=\cos x-1\)
4. \(\quad y=\sin x+1\)
5. \(\quad y=\sin \left(x-\frac{\pi}{4}\right)\)
6. \(\quad y=1-\cos x\)
7. \(\quad y=\sin x-1\)
8. \(\quad y=\cos \left(x+\frac{\pi}{4}\right)\)
Sketch at least one period for each function. Be sure to include the important values along the \(x\) and \(y\) axes.
9. \(\quad y=\sin \left(x+\frac{\pi}{6}\right)\)
\(10 . \quad y=\cos \left(x-\frac{\pi}{6}\right)\)
11. \(\quad y=\cos \left(x-\frac{\pi}{3}\right)\)
12. \(\quad y=\sin \left(x+\frac{\pi}{3}\right)\)
13. \(\quad y=\sin \left(x-\frac{3 \pi}{4}\right) \quad\)
14. \(\quad y=\cos \left(x+\frac{3 \pi}{4}\right)\)
15. \(\quad y=\cos \left(x+\frac{2 \pi}{3}\right) \quad\)
16. \(\quad y=\sin \left(x-\frac{2 \pi}{3}\right)\)