
7.3: Plotting Points in the Plane
- Page ID
- 49382

The Plane
Ordered Pairs
We are now interested in studying graphs of linear equations in two variables. We know that solutions to equations in two variables consist of a pair of values, one value for each variable. We have called these pairs of values ordered pairs. Since we have a pair of values to graph, we must have a pair of axes (number lines) upon which the values can be located.
Origin
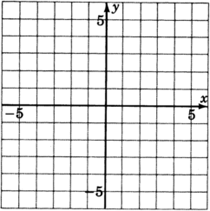
We draw the axes so they are perpendicular to each other and so that they intersect each other at their 0's. This point is called the origin.
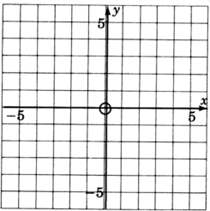
Rectangular Coordinate System
These two lines form what is called a rectangular coordinate system. They also determine a plane.
\(xy\)-plane
A plane is a flat surface, and a result from geometry states that through any two intersecting lines (the axes) exactly one plane (flat surface) may be passed. If we are dealing with a linear equation in the two variables \(x\) and \(y\), we sometimes say we are graphing the equation using a rectangular coordinate system, or that we are graphing the equation in the \(xy\)-plane.
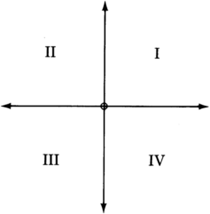
Quadrant
Notice that the two intersecting coordinate axes divide the plane into four equal regions. Since there are four regions, we call each one a quadrant and number them counterclockwise using Roman numerals.
Recall that when we first studied the number line we observed the following:
For each real number there exists a unique point on the number line, and for each point on the number line we can associate a unique real number.
We have a similar situation for the plane.
For each ordered pair \((a, b)\), there exists a unique point in the plane, and to each point in the plane we can associate a unique ordered pair \((a, b)\) of real numbers.
Coordinates of a Point
Coordinates of a Point
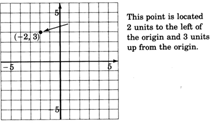
The numbers in an ordered pair that are associated with a particular point are called the coordinates of the point. The first number in the ordered pair expresses the point’s horizontal distance and direction (left or right) from the origin. The second number expresses the point’s vertical distance and direction (up or down) from the origin.
The Coordinates Determine Distance and Direction
A positive number means a direction to the right or up. A negative number means a direction to the left or down.
Plotting Points
Since points and ordered pairs are so closely related, the two terms are sometimes used interchangeably. The following two phrases have the same meaning:
- Plot the point \((a, b)\).
- Plot the ordered pair \((a, b)\).
Plotting a Point
Both phrases mean: Locate, in the plane, the point associated with the ordered pair \((a, b)\) and draw a mark at that position.
Sample Set A
Plot the ordered pair \((2, 6)\).
We begin at the origin. The first number in the ordered pair, 2, tells us we move 2 units to the right (\(+2\) means 2 units to the right) The second number in the ordered pair, 6, tells us we move 6 units up (\(+6\) means 6 units up).
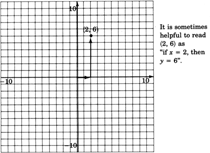
It is sometimes helpful to read \((2,6)\) as "if \(x = 2\), then \(y = 6\).
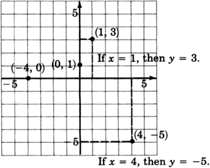
Practice Set A
Plot the ordered pairs.
\((1, 3), (4, −5), (0, 1), (−4, 0)\).
- Answer
-
(Notice that the dotted lines on the graph are only for illustration and should not be included when plotting points.)
Exercises
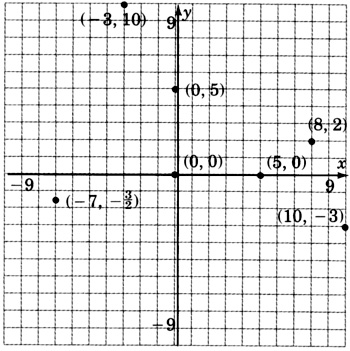
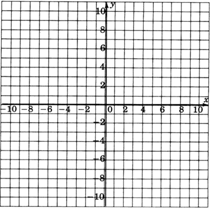
Plot the following ordered pairs. (Do not draw the arrows as in Practice Set A.)
\((8, 2), (10, −3), (−3, 10), (0, 5), (5, 0), (0, 0), (−7, -\dfrac{3}{2})\).
- Answer
-
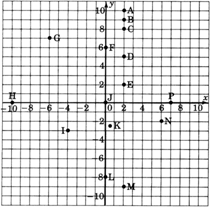
As accurately as possible, state the coordinates of the points that have been plotted on the following graph.
Using ordered pair notation, what are the coordinates of the origin?
- Answer
-
Coordinates of the origin are \((0,0)\).
We know that solutions to linear equations in two variables can be expressed as ordered pairs. Hence, the solutions can be represented as points in the plane. Consider the linear equation \(y=2x−1\). Find at least ten solutions to this equation by choosing \(x\)-values between \(−4\) and \(5\) and computing the corresponding y-values. Plot these solutions on the coordinate system below. Fill in the table to help you keep track of the ordered pairs.
| \(x\) | - | - | - | - | - | - | - | - | - | - | - | - |
| \(y\) | - | - | - | - | - | - | - | - | - | - | - | - |
Keeping in mind that there are infinitely many ordered pair solutions to \(y=2x−1\), speculate on the geometric structure of the graph of all the solutions. Complete the following statement:
The name of the type of geometric structure of the graph of all the solutions to the linear equation
\(y=2x−1\) seems to be __________ .
Where does this figure cross the y-axis? Does this number appear in the equation \(y=2x−1\)?
Place your pencil at any point on the figure (you may have to connect the dots to see the figure clearly). Move your pencil exactly one unit to the right (horizontally). To get back onto the figure, you must move your pencil either up or down a particular number of units. How many units must you move vertically to get back onto the figure, and do you see this number in the equation \(y=2x−1\)?
Consider the \(xy\)-plane.
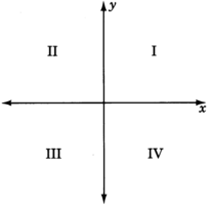
Complete the table by writing the appropriate inequalities.
| I | II | III | IV |
| \(x > 0\) | \(x < 0\) | \(x\) | \(x\) |
| \(y > 0\) | \(y\) | \(y\) | \(y\) |
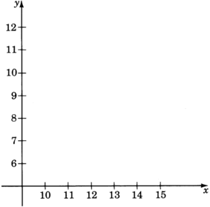
In the following problems, the graphs of points are called scatter diagrams and are frequently used by statisticians to determine if there is a relationship between the two variables under consideration. The first component of the ordered pair is called the input variable and the second component is called the output variable. Construct the scatter diagrams. Determine if there appears to be a relationship between the two variables under consideration by making the following observations: A relationship may exist if
- as one variable increases, the other variable increases
- as one variable increases, the other variable decreases
- Answer
-
I II III IV \(x > 0\) \(x < 0\) \(x < 0\) \(x > 0\) \(y > 0\) \(y > 0\) \(y < 0\) \(y < 0\)
A psychologist, studying the effects of a placebo on assembly line workers at a particular industrial site, noted the time it took to assemble a certain item before the subject was given the placebo, \(x\), and the time it took to assemble a similar item after the subject was given the placebo, \(y\). The psychologist's data are
| \(x\) | \(y\) |
| 10 | 8 |
| 12 | 9 |
| 11 | 9 |
| 10 | 7 |
| 14 | 11 |
| 15 | 12 |
| 13 | 10 |
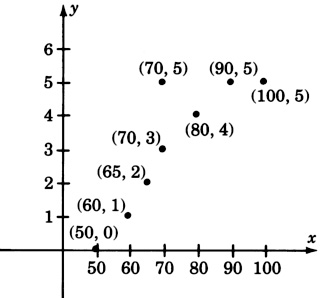
The following data were obtained in an engineer’s study of the relationship between the amount of pressure used to form a piece of machinery, \(x\), and the number of defective pieces of machinery produced, \(y\).
| \(x\) | \(y\) |
| 50 | 0 |
| 60 | 1 |
| 65 | 2 |
| 70 | 3 |
| 80 | 4 |
| 70 | 5 |
| 90 | 5 |
| 100 | 5 |
- Answer
-
Yes, there does appear to be a relation.
The following data represent the number of work days missed per year, \(x\), by the employees of an insurance company and the number of minutes they arrive late from lunch, \(y\).
| \(x\) | \(y\) |
| 1 | 3 |
| 6 | 4 |
| 2 | 2 |
| 2 | 3 |
| 3 | 1 |
| 1 | 4 |
| 4 | 4 |
| 6 | 3 |
| 5 | 2 |
| 6 | 1 |
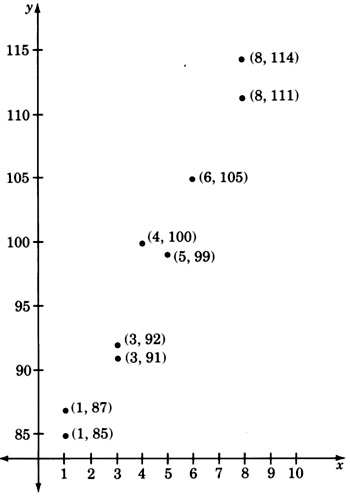
A manufacturer of dental equipment has the following data on the unit cost (in dollars), \(y\), of a particular item and the number of units, \(x\), manufactured for each order.
| \(x\) | \(y\) |
| 1 | 85 |
| 3 | 92 |
| 5 | 99 |
| 3 | 91 |
| 4 | 100 |
| 1 | 87 |
| 6 | 105 |
| 8 | 111 |
| 8 | 114 |
- Answer
-
Yes, there does appear to be a relation.
Exercises for Review
Simplify \((\dfrac{18x^5y^6}{9x^2y^4})^5\)
Supply the missing word. An is a statement that two algebraic expressions are equal.
- Answer
-
equation
Simplify the expression \(5xy(xy−2x+3y)−2xy(3xy−4x)−15xy^2\).
Identify the equation \(x + 2 = x + 1\) as an identity, a contradiction, or a conditional equation.
- Answer
-
contradiction
Supply the missing phrase. A system of axes constructed for graphing an equation is called a