
7.6: Graphing Equations in Slope-Intercept Form
- Page ID
- 49385

Using the Slope and Intercept to Graph a Line
When a linear equation is given in the general form, \(ax+by=c\), we observed that an efficient graphical approach was the intercept method. We let \(x=0\) and computed the corresponding value of \(y\), then let \(y=0\) and computed the corresponding value of \(x\).
When an equation is written in the slope-intercept form, \(y=mx+b\), there are also efficient ways of constructing the graph. One way, but less efficient, is to choose two or three \(x\)-values and compute to find the corresponding \(y\)-values. However, computations are tedious, time consuming, and can lead to errors. Another way, the method listed below, makes use of the slope and the \(y\)-intercept for graphing the line. It is quick, simple, and involves no computations.
- Plot the \(y\)-intercept \((0, b)\).
- Determine another point by using the slope m.
- Draw a line through the two points.
Recall that we defined the slope \(m\) as the ratio \(\dfrac{y_2-y_1}{x_2-x_1}\). The numerator \(y_2−y_1\) represents the number of units that \(y\) changes and the denominator \(x_2 - x_1\) represents the number of units that \(x\) changes. Suppose \(m=pq\). Then \(p\) is the number of units that \(y\) changes and \(q\) is the number of units that \(x\) changes. Since these changes occur simultaneously, start with your pencil at the \(y\)-intercept, move \(p\) units in the appropriate vertical direction, and then move \(q\) units in the appropriate horizontal direction. Mark a point at this location.
Sample Set A
Graph the following lines.
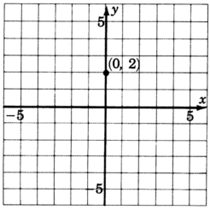
\(y = \dfrac{3}{4}x + 2\)
1. The \(y\)-intercept is the point \((0,2)\). Thus the line crosses the \(y\)-axis \(2\) units above the origin. Mark a point at \((0,2)\).
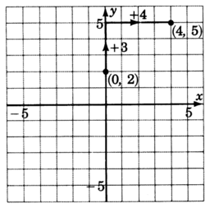
2. The slope, \(m\), is \(\dfrac{3}{4}\). This means that if we start at any point on the line and move our pencil \(3\) units up and then \(4\) units to the right, we’ll be back on the line. Start at a known point, the \(y\)-intercept \((0, 2)\). Move up \(3\) units, then move \(4\) units to the right. Mark a point at this location. (Note also that \dfrac{3}{4} = \dfrac{-3}{-4}\). This means that if we start at any point on the line and move our pencil \(3\) units down and \(4\) units to the left, we’ll be back on the line. Note also that \(\dfrac{3}{4} = \dfrac{\dfrac{3}{4}}{1}\). This means that if we start at any point on the line and move to the right \(1\) unit, we’ll have to move up \(\dfrac{3}{4}\) unit to get back on the line.)
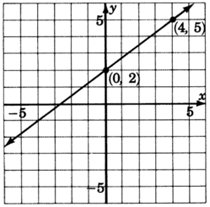
3. Draw a line through both points.
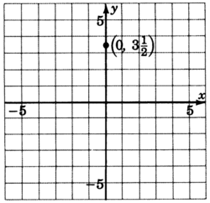
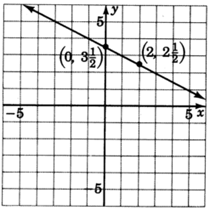
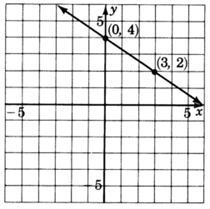
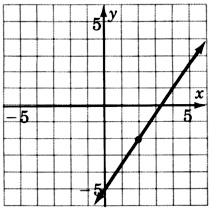
\(y = -\dfrac{1}{2}x + \dfrac{7}{2}\)
1. The \(y\)-intercept is the point \((0, \dfrac{7}{2})\). Thus the line crosses the \(y\)-axis \(\dfrac{7}{2}\) units above the origin. Mark a point \((0, \dfrac{7}{2})\), or \((0, 3\dfrac{1}{2})\).
2. The slope, \(m\), is \(-\dfrac{1}{2}\). We can write \(-\dfrac{1}{2}\) as \(\dfrac{-1}{2}\). Thus, we start at a known point, the \(y\)-intercept \((0, 3\dfrac{1}{2})\), move down one unit (because of the \(-1\)), then move right \(2\) units. Mark a point at this location.
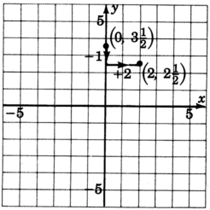
3. Draw a line through both points.
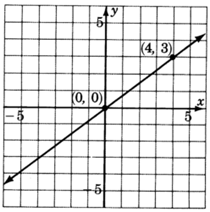
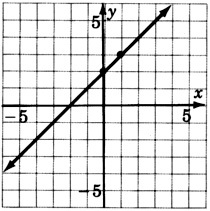
\(y = \dfrac{2}{5}x\)
1. We can put this equation into explicit slope-intercept by writing it as \(y = \dfrac{2}{5}x + 0\).
The \(y\)-intercept is at the point \((0, 0)\), the origin. This line goes right through the origin.
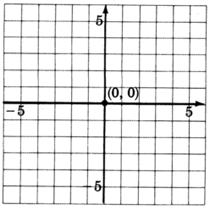
2. The slope, \(m\), is \(\dfrac{2}{5}\). Starting at the origin, we move up \(2\) units, then move to the right \(5\) units. Mark a point at this location.
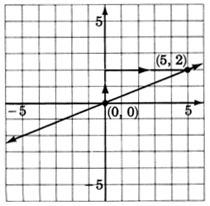
3. Draw a line through the two points.
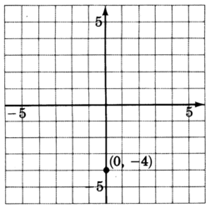
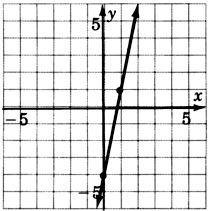
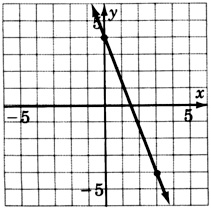
\(y = 2x - 4\)
1. The \(y\)-intercept is the point \((0, -4)\). Thus the line crosses the \(y\)-axis \(4\) units below the origin. Mark a point at \((0, -4)\).
2. The slope, \(m\), is \(2\). If we write the slope as a fraction, \(2 = \dfrac{2}{1}\), we can read how to make the changes. Start at the known point \((0, -4)\), move up \(2\) units, then move right \(1\) unit. Mark a point at this location.
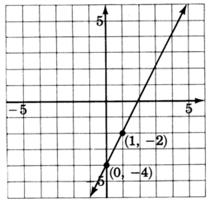
3. Draw a line through the two points.
Practice Set A
Use the \(y\)-intercept and the slope to graph each line.
\(y = \dfrac{-2}{3} + 4\)
- Answer
-
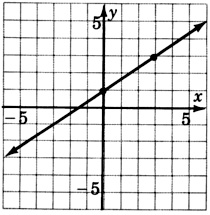
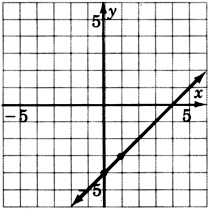
\(y = \dfrac{3}{4}x\)
- Answer
-
Exercises
For the following problems, graph the equations.
\(y = \dfrac{2}{3} + 1\)
- Answer
-
\(y = \dfrac{1}{4}x - 2\)
\(y = 5x - 4\)
- Answer
-
\(y = -\dfrac{6}{5} - 3\)
\(y = \dfrac{3}{2} - 5\)
- Answer
-
\(y = \dfrac{1}{5}x + 2\)
\(y = -\dfrac{8}{3} + 4\)
- Answer
-
\(y = -\dfrac{10}{3} + 6\)
\(y = 1x - 4\)
- Answer
-
\(y = -2x + 1\)
\(y = x + 2\)
- Answer
-
\(y = \dfrac{3}{5}x\)
\(y = -\dfrac{4}{3}\)
- Answer
-
\(y = x\)
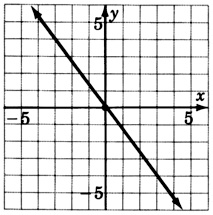
\(y = -x\)
- Answer
-
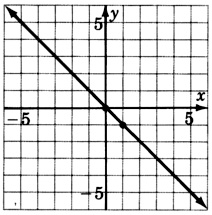
\(3y−2x=−3\)
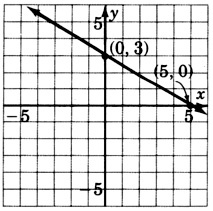
\(6x+10y=30\)
- Answer
-
\(x+y=0\)
Exercises for Review
Solve the inequality \(2 - 4x \ge x - 3\)
- Answer
-
\(x≤1\)
Graph the inequality \(y+3>1.\)
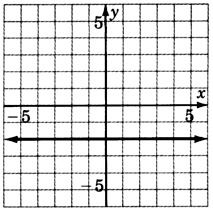
Graph the equation \(y = -2\).
- Answer
-
Determine the slope and \(y\)-intercept of the line \(−4y−3x=16\).
Find the slope of the line passing through the points \((−1, 5)\) and \((2, 3)\).
- Answer
-
\(m = \dfrac{-2}{3}\)