
3.3E: Exercises
- Page ID
- 30302

Practice Makes Perfect
Find the Slope of a Line
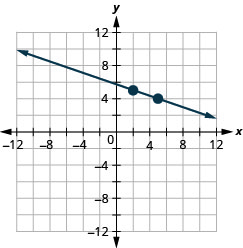
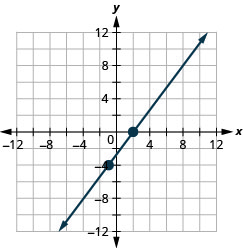
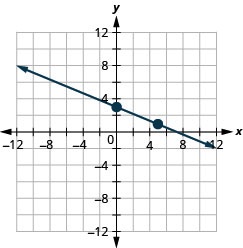
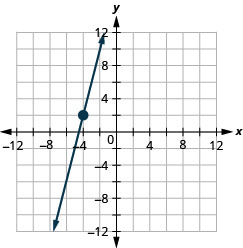
In the following exercises, find the slope of each line shown.
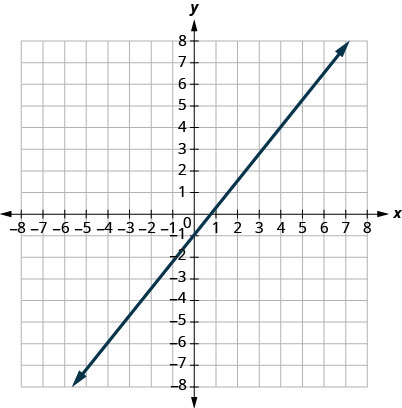
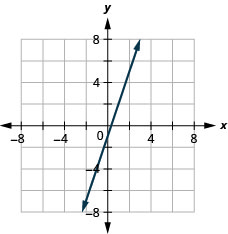
1.
- Answer
-
\(m=\frac{2}{5}\)
2.
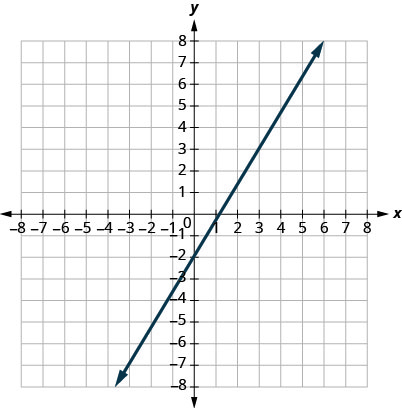
3.
- Answer
-
\(m=\frac{5}{4}\)
4.
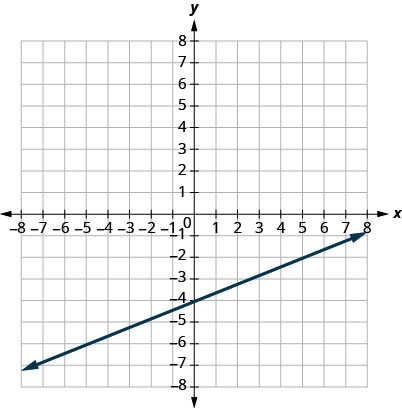
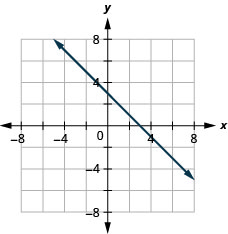
5.
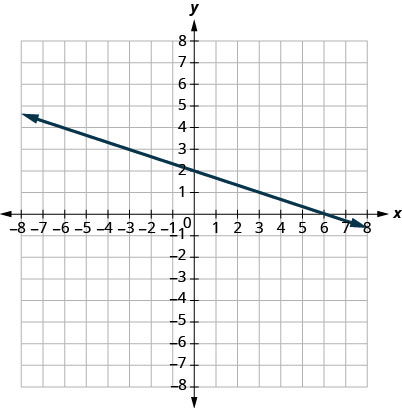
- Answer
-
\(m = -\frac{1}{3}\)
6.
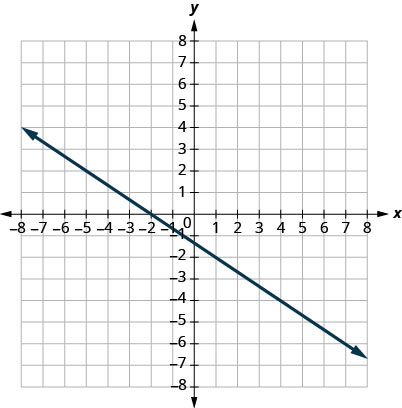
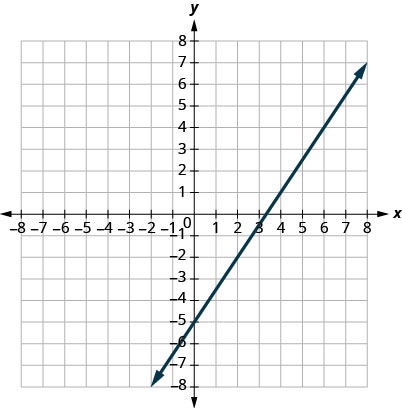
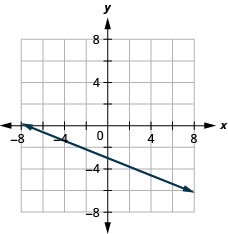
7.
- Answer
-
\(m = -\frac{5}{2}\)
8.
In the following exercises, find the slope of each line.
9. \(y=3\)
- Answer
-
\(m = 0\)
10. \(y=−2\)
11. \(x=−5\)
- Answer
-
undefined
12. \(x=4\)
In the following exercises, use the slope formula to find the slope of the line between each pair of points.
13. \((2,5),\;(4,0)\)
- Answer
-
\(m = -\frac{5}{2}\)
14. \((3,6),\;(8,0)\)
15. \((−3,3),\;(4,−5)\)
- Answer
-
\(m = -\frac{8}{7}\)
16. \((−2,4),\;(3,−1)\)
17. \((−1,−2),\;(2,5)\)
- Answer
-
\(m = \frac{7}{3}\)
18. \((−2,−1),\;(6,5)\)
19. \((4,−5),\;(1,−2)\)
- Answer
-
\(m = -1\)
20. \((3,−6),\;(2,−2)\)
Graph a Line Given a Point and the Slope
In the following exercises, graph each line with the given point and slope.
21. \((2,5)\); \(m=−\frac{1}{3}\)
- Answer
-
22. \((1,4)\); \(m=−\frac{1}{2}\)
23. \((−1,−4)\); \(m=\frac{4}{3}\)
- Answer
-
24. \((−3,−5)\); \(m=\frac{3}{2}\)
25. \(y\)-intercept: \((0, 3)\); \(m=−\frac{2}{5}\)
- Answer
-
26. \(x\)-intercept: \((−2,0)\); \(m=\frac{3}{4}\)
27. \((−4,2)\); \(m=4\)
- Answer
-
28. \((1,5)\); \(m=−3\)
Graph a Line Using Its Slope and Intercept
In the following exercises, identify the slope and y-intercept of each line.
29. \(y=−7x+3\)
- Answer
-
\(m=−7\); \((0,3)\)
30. \(y=4x−10\)
31. \(3x+y=5\)
- Answer
-
\(m=−3\); \((0,5)\)
32. \(4x+y=8\)
33. \(6x+4y=12\)
- Answer
-
\(m=−\frac{3}{2}\); \((0,3)\)
34. \(8x+3y=12\)
35. \(5x−2y=6\)
- Answer
-
\(m=\frac{5}{2}\); \((0,−3)\)
36. \(7x−3y=9\)
In the following exercises, graph the line of each equation using its slope and y-intercept.
37. \(y=3x−1\)
- Answer
-
38. \(y=2x−3\)
39. \(y=−x+3\)
- Answer
-
40. \(y=−x−4\)
41. \(y=−\frac{2}{5}x−3\)
- Answer
-
42. \(y=−\frac{3}{5}x+2\)
43. \(3x−2y=4\)
- Answer
-
44. \(3x−4y=8\)
Choose the Most Convenient Method to Graph a Line
In the following exercises, determine the most convenient method to graph each line.
45. \(x=2\)
- Answer
-
vertical line
46. \(y=5\)
47. \(y=−3x+4\)
- Answer
-
slope-intercept
48. \(x−y=5\)
49. \(x−y=1\)
- Answer
-
intercepts
50. \(y=\frac{2}{3}x−1\)
51. \(3x−2y=−12\)
- Answer
-
intercepts
52. \(2x−5y=−10\)
Graph and Interpret Applications of Slope–Intercept
53. The equation \(P=31+1.75w\) models the relation between the amount of Tuyet’s monthly water bill payment, \(P\), in dollars, and the number of units of water, \(w\), used.
a. Find Tuyet’s payment for a month when \(0\) units of water are used.
b. Find Tuyet’s payment for a month when \(12\) units of water are used.
c. Interpret the slope and \(P\)-intercept of the equation.
d. Graph the equation.
- Answer
-
a. \($31\)
b. \($52\)
c. The slope, \(1.75\), means that the payment, \(P\), increases by \($1.75\) when the number of units of water used, \(w\), increases by \(1\). The \(P\)-intercept means that when the number units of water Tuyet used is \(0\), the payment is \($31\).
d.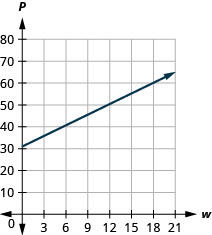
54. The equation \(P=28+2.54w\) models the relation between the amount of Randy’s monthly water bill payment, \(P\), in dollars, and the number of units of water, \(w\), used.
a. Find the payment for a month when Randy used \(0\) units of water.
b. Find the payment for a month when Randy used \(15\) units of water.
c. Interpret the slope and \(P\)-intercept of the equation.
d. Graph the equation.
55. Bruce drives his car for his job. The equation \(R=0.575m+42\) models the relation between the amount in dollars, \(R\), that he is reimbursed and the number of miles, \(m\), he drives in one day.
a. Find the amount Bruce is reimbursed on a day when he drives \(0\) miles.
b. Find the amount Bruce is reimbursed on a day when he drives \(220\) miles.
c. Interpret the slope and \(R\)-intercept of the equation.
d. Graph the equation.
- Answer
-
a. \($42\)
b. \($168.50\)
c. The slope, \(0.575\) means that the amount he is reimbursed, \(R\), increases by \($0.575\) when the number of miles driven, \(m\), increases by \(1\). The \(R\)-intercept means that when the number miles driven is \(0\), the amount reimbursed is \($42\).
d.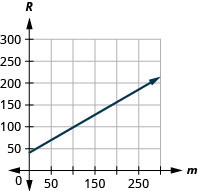
56. Janelle is planning to rent a car while on vacation. The equation \(C=0.32m+15\) models the relation between the cost in dollars, \(C\), per day and the number of miles, \(m\), she drives in one day.
a. Find the cost if Janelle drives the car \(0\) miles one day.
b. Find the cost on a day when Janelle drives the car \(400\) miles.
c. Interpret the slope and \(C\)-intercept of the equation.
d. Graph the equation.
57. Cherie works in retail and her weekly salary includes commission for the amount she sells. The equation \(S=400+0.15c\) models the relation between her weekly salary, \(S\), in dollars and the amount of her sales, \(c\), in dollars.
a. Find Cherie’s salary for a week when her sales were \($0\).
b. Find Cherie’s salary for a week when her sales were \($3,600\).
c. Interpret the slope and \(S\)-intercept of the equation.
d. Graph the equation.
- Answer
-
a. \($400\)
b. \($940\)
c. The slope, \(0.15\), means that Cherie’s salary, S, increases by \($0.15\) for every \($1\) increase in her sales. The \(S\)-intercept means that when her sales are \($0\), her salary is \($400\).
d.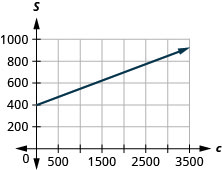
58. Patel’s weekly salary includes a base pay plus commission on his sales. The equation \(S=750+0.09c\) models the relation between his weekly salary, \(S\), in dollars and the amount of his sales, \(c\), in dollars.
a. Find Patel’s salary for a week when his sales were \(0\).
b. Find Patel’s salary for a week when his sales were \(18,540\).
c. Interpret the slope and \(S\)-intercept of the equation.
d. Graph the equation.
59. Costa is planning a lunch banquet. The equation \(C=450+28g\) models the relation between the cost in dollars, \(C\), of the banquet and the number of guests, \(g\).
a. Find the cost if the number of guests is \(40\).
b. Find the cost if the number of guests is \(80\).
c. Interpret the slope and \(C\)-intercept of the equation.
d. Graph the equation.
- Answer
-
a. \($1570\)
b. \($5690\)
c. The slope gives the cost per guest. The slope, \(28\), means that the cost, \(C\), increases by \($28\) when the number of guests increases by \(1\). The \(C\)-intercept means that if the number of guests was \(0\), the cost would be \($450\).
d.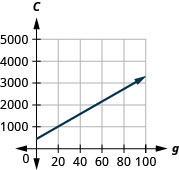
60. Margie is planning a dinner banquet. The equation \(C=750+42g\) models the relation between the cost in dollars, \(C\), of the banquet and the number of guests, \(g\).
a. Find the cost if the number of guests is \(50\).
b. Find the cost if the number of guests is \(100\).
c. Interpret the slope and \(C\)-intercept of the equation.
d. Graph the equation.
Use Slopes to Identify Parallel and Perpendicular Lines
In the following exercises, use slopes and \(y\)-intercepts to determine if the lines are parallel, perpendicular, or neither.
61. \(y=\frac{3}{4}x−3\); \(3x−4y=−2\)
- Answer
-
parallel
62. \(3x−4y=−2\); \(y=\frac{3}{4}x−3\)
63. \(2x−4y=6\); \(x−2y=3\)
- Answer
-
neither
64. \(8x+6y=6\); \(12x+9y=12\)
65. \(x=5\); \(x=−6\)
- Answer
-
parallel
66. \(x=−3\); \(x=−2\)
67. \(4x−2y=5\); \(3x+6y=8\)
- Answer
-
perpendicular
68. \(8x−2y=7\); \(3x+12y=9\)
69. \(3x−6y=12\); \(6x−3y=3\)
- Answer
-
neither
70. \(9x−5y=4\); \(5x+9y=−1\)
71. \(7x−4y=8\); \(4x+7y=14\)
- Answer
-
perpendicular
72. \(5x−2y=11\); \(5x−y=7\)
73. \(3x−2y=8\); \(2x+3y=6\)
- Answer
-
perpendicular
74. \(2x+3y=5\); \(3x−2y=7\)
75. \(3x−2y=1\); \(2x−3y=2\)
- Answer
-
neither
76. \(2x+4y=3\); \(6x+3y=2\)
77. \(y=2\); \(y=6\)
- Answer
-
parallel
78. \(y=−1\); \(y=2\)
Writing Exercises
79. How does the graph of a line with slope \(m=12\) differ from the graph of a line with slope \(m=2\)?
- Answer
-
Answers will vary.
80. Why is the slope of a vertical line “undefined”?
81. Explain how you can graph a line given a point and its slope.
- Answer
-
Answers will vary.
82. Explain in your own words how to decide which method to use to graph a line.
Self Check
a. After completing the exercises, use this checklist to evaluate your mastery of the objectives of this section.
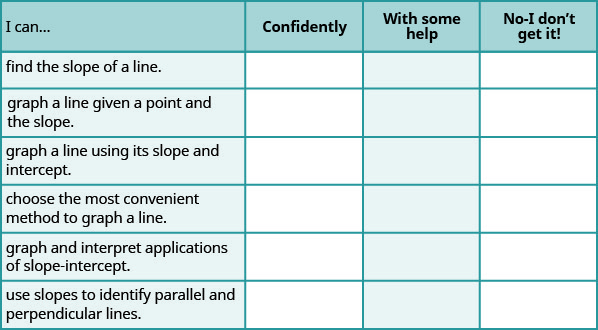
b. After reviewing this checklist, what will you do to become confident for all objectives?