
3.1: Percent Change (Are We Up Or Down?)
- Page ID
- 22076

On your way to work, you notice that the price of gasoline is about 10% higher than it was last month. At the office, reports indicate that input costs are down 5.4% and sales are up 3.6% over last year. Your boss asks you to analyze the year-over-year change in industry sales and submit a report. During your coffee break, you look through the day's e-flyers in your inbox. Home Depot is advertising that all garden furniture is 40% off this week; Safeway’s ad says that Tuesday is 10% off day; and a Globe and Mail story informs you that the cost of living has risen by 3% since last year. You then log in to your financial services account, where you are happy to find that the mutual funds in your RRSP are up 6.7% from last year. What are you going to do with all this information?
Understanding how data changes from one period to the next is a critical business skill. It allows for quick assessment as to whether matters are improving or getting worse. It also allows for easy comparison of changes in different types of data over time. In this section, the concept of percent change is explored, which allows for the calculation of change between two points in time. Then a rate of change over time is introduced, which allows you to determine the change per period when multiple points in time are involved in the calculation.
Percent Change
It can be difficult to understand a change when it is expressed in absolute terms. Can you tell at a glance how good a deal it is to buy a $359 futon for $215.40? It can also be difficult to understand a change when it is expressed as a percentage of its end result. Are you getting a good deal if that $215.40 futon is 60% of the regular price? What most people do find easier to understand is a change expressed as a percentage of its starting amount. Are you getting a good deal if that $359 futon is on sale at 40% off? A percent change expresses in percentage form how much any quantity changes from a starting period to an ending period.
The Formula
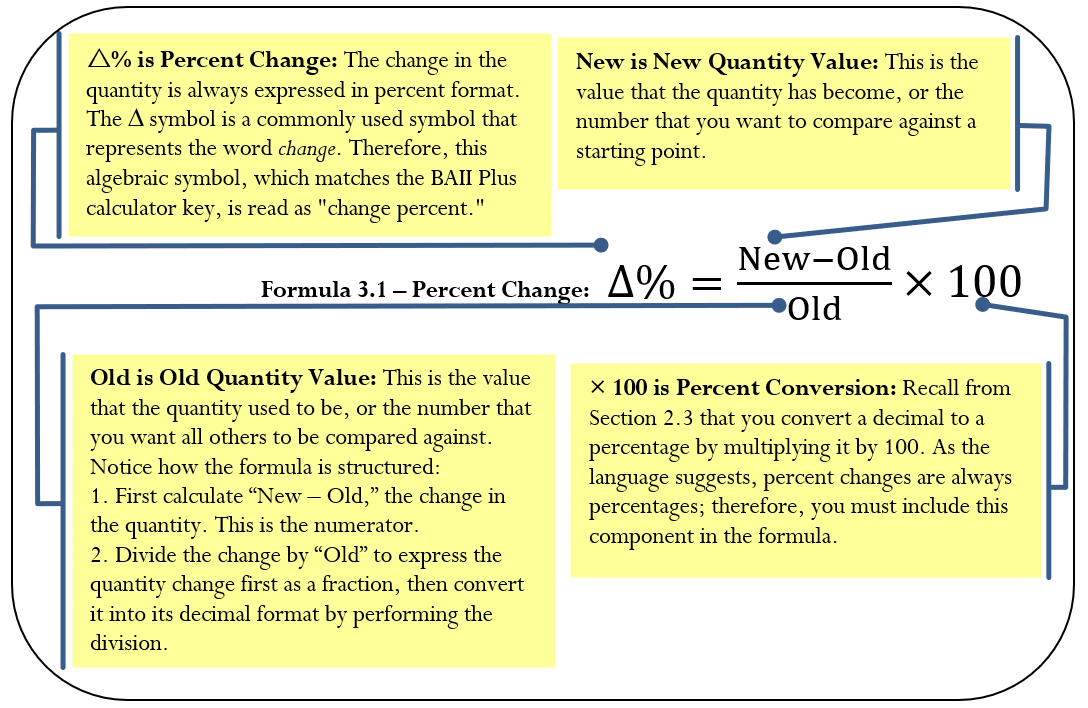
To calculate the percent change in a variable, you need to know the starting number and the ending number. Once you know these, Formula 3.1 (see the figure below) represents how to express the change as a percentage.
Remember two critical concepts about percent change:
- Do Not Include the Original Quantity in the Change. Percent change represents the changes in the quantities, not the values of the quantities themselves. The original quantity does not count toward the percent change. Therefore, if any quantity doubles, its percent change is 100%, not 200%. For example, if the old quantity was 25 and the new quantity is 50, note that the quantity has doubled. However, 25 of the final 50 comes from the original amount and therefore does not count toward the change. We subtract it out of the numerator through calculating 50 − 25 = 25. Therefore, the change as a percentage is \(\dfrac{50-25}{25} \times 100=100 \%\) The same applies to a tripling of quantity. If our new quantity is 75 (which is triple the old quantity of 25), then \(\dfrac{75-25}{25} \times 100=200 \%\) The original value of 25 is once again subtracted out of the numerator. The original 100% is always removed from the formula.
- Negative Changes. A negative change must be expressed with a negative sign or equivalent wording. For example, if the old quantity was 20 and the new quantity is 15, this is a decrease of 5, or a change of 15 − 20 = −5. The percent change is \(\dfrac{15-20}{20} \times 100=-25 \%\). Be careful in expressing a negative percent change. There are two correct ways to do this properly:
- "The change is −25%."
- "It has decreased by 25%."
Note in the second statement that the word “decreased” replaces the negative sign. To avoid confusion, do not combine the negative sign with the word “decreased”—recall that two negatives make a positive, so "It has decreased by −25%" would actually mean the quantity has increased by 25%.
How It Works
To solve any question about percent change, follow these steps:
Step 1: Notice that there are three variables in the formula. Identify the two known variables and the one unknown variable.
Step 2: Solve for the unknown variable using Formula 3.1.
Assume last month your sales were \(\$10,000\), and they have risen to \(\$15,000\) this month. You want to express the percent change in sales.
Step 1: The known variables are \(Old = \$10,000\) and \(New = \$15,000\). The unknown variable is percent change, or \(\Delta \%\).
Step 2: Using Formula 3.1,
Observe that the change in sales is +$5,000 month-over-month. Relative to sales of $10,000 last month, this month's sales have risen by 50%.
Important Notes
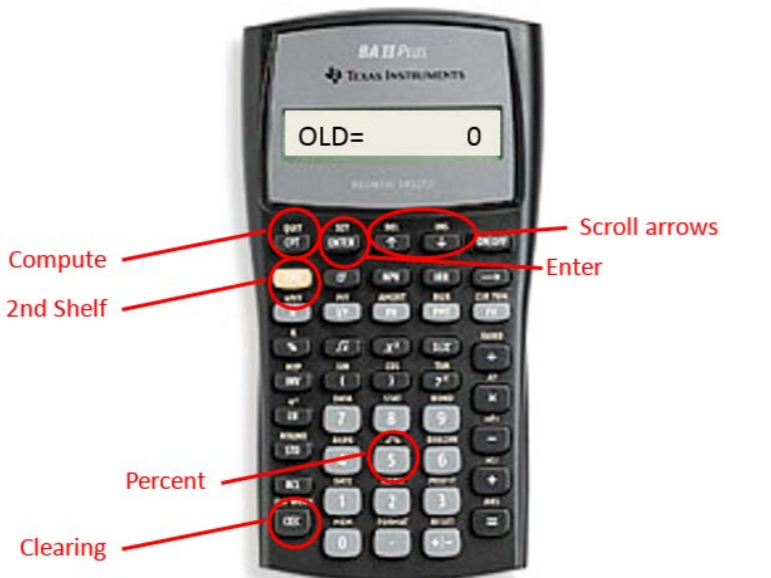
To access the percent change function on your BAII Plus calculator, press 2nd \(\Delta \%\) located above the number 5 on your keypad. Always clear the memory of any previous question by pressing 2nd CLR Work once the function is open. Use the \(\uparrow\) and \(\downarrow\) arrows to scroll through the four lines of this function. To solve for an unknown variable, key in three of the four variables and then press Enter. With the unknown variable on your display, press CPT. Each variable in the calculator is as follows:
- OLD = The old or original quantity; the number that represents the starting point
- NEW = The new or current quantity; the number to compare against the starting point
- %CH = The percent change, or ∆% in its percent format without the % sign
- #PD = Number of consecutive periods for change. By default, it is set to 1. For now, do not touch this variable. Later in this section, when we cover rate of change over time, this variable will be explained.
Things To Watch Out For
Watch out for two common difficulties involving percent changes.
- Rates versus Percent Changes. Sometimes you may be confused about whether questions involve rates (Section 2.3) or percent changes. Recall that a rate expresses the relationship between a portion and a base. Look for some key identifiers, such as "is/are" (the portion) and "of" (the base). For percent change, key identifiers are "by" or "than." For example, "\(x\) has increased by \(y\%\)" and "\(x\) is \(y\%\) more than last year" both represent a percent change.
- Mathematical Operations. You may imagine that you are supposed to add or subtract percent changes, but you cannot do this. Remember that percentages come from fractions. According to the rules of algebra, you can add or subtract fractions only if they share the same base (denominator). For example, if an investment increases in value in the first year by 10% and then declines in the second year by 6%, this is not an overall increase of \(10 \%-6 \%=4 \%\). Why? If you originally had \(\$100\), an increase of \(10\%\) (which is \(\$100 \times 10\% = \$10)\) results in \(\$110\) at the end of the first year. You must calculate the \(6\%\) decline in the second year using the \(\$110\) balance, not the original \(\$100\). This is a decline of \(\$110 \times (−6\%) = −\$6.60\), resulting in a final balance of \(\$103.40\). Overall, the percent change is \(3.4\%\).
Paths To Success
A percent change extends the rate, portion, and base calculations introduced in Section 2.3. The primary difference lies in the portion. Instead of the portion being a part of a whole, the portion represents the change of the whole. Putting the two formulas side by side, you can calculate the rate using either approach.
\[\text { Rate }=\dfrac{\text { Portion }}{\text { Base }}=\dfrac{\text { New }-\text { Old }}{\text { Old }}\nonumber \]
- It has been five years since Juan went shopping for a new car. On his first visit to a car lot, he had sticker shock when he realized that new car prices had risen by about 20%. What does this situation involve?
- Percent change
- Rate, portion, base
- Manuel had his home custom built in 2006 for $300,000. In 2014 he had it professionally appraised at $440,000. He wants to figure out how much his home has appreciated. How would he do so?
- The 2006 price is the "New," and the 2014 price is the "Old."
- The 2006 price is the "Old," and the 2014 price is the "New."
- Answer
-
- a (the question involves how car prices have changed; note the key word "by")
- b (the 2006 price is what the house used to be worth, which is the old quantity; the 2014 price represents the new value of the home)
In 1982, the average price of a new car sold in Canada was $10,668. By 2009, the average price of a new car had increased to $25,683. By what percentage has the price of a new car changed over these years?
Solution
You are trying to find the percent change in the price of the new car, or \(∆\%\).
What You Already Know
Step 1:
You know the old and new prices for the cars:
Old = $10,668, New = $25,683
How You Will Get There
Step 2:
Apply Formula 3.1.
Perform
Step 2:
\[\begin{aligned} \Delta \% &=\dfrac{\$ 25,683-\$ 10,668}{\$ 10,668} \times 100 \\ &=\dfrac{\$ 15,015}{\$ 10,668} \times 100\\ &=140.748 \% \end{aligned}\nonumber \]
Calculator Instructions
| OLD | NEW | %CH | #PD |
|---|---|---|---|
| 10668 | 25683 | Answer: 140.748031 | 1 |
From 1982 to 2009, average new car prices in Canada have increased by 140.748%.
When you purchase a retail item, the tax increases the price of the product. If you buy a $799.00 Bowflex Classic Home Gym machine in Ontario, it is subject to 13% HST. What amount do you pay for the Bowflex including taxes?
Solution
You are looking for the price of the Bowflex after increasing it by the sales tax. This is a "New" price for the Bowflex.
What You Already Know
Step 1:
You know the original price of the machine and how much to increase it by:
\(\text { Old }=\$ 799.00 \quad \Delta \%=13 \%\)
How You Will Get There
Step 2:
Apply Formula 3.1: \(\Delta \%=\dfrac{\text { New }-\text { Old }}{\text { Old }} \times 100\)
Perform
Step 2:
\[\begin{aligned}
&13 \%=\dfrac{\text { New }-\$ 799}{\$ 799} \times 100\\
&0.13=\dfrac{\text { New }-\$ 799}{\$ 799}\\
&\$ 103.87=\text { New }-\$ 799\\
&\$ 902.87=\text { New }
\end{aligned} \nonumber \]
Calculator Instructions
| OLD | NEW | %CH | #PD |
|---|---|---|---|
| 799 | Answer: 902.87 | 13 | 1 |
The price of a Bowflex, after increasing the price by the taxes of 13%, is $902.87.
Consumers often object to price changes in many daily products, even though inflation and other cost changes may justify these increases. To reduce the resistance to a price increase, many manufacturers adjust both prices and product sizes at the same time. For example, the regular selling price for a bottle of shampoo was $5.99 for 240 mL. To account for cost changes, the manufacturer decided to change the price to $5.79, but also reduce the bottle size to 220 mL. What was the percent change in the price per millilitre?
Solution
You need to find the percent change in the price per millilitre, or \(\Delta \%\).
What You Already Know
Step 1:
You know the old price and bottle size, as well as the planned price and bottle size:
\[\begin{array}{ll}{\text { Old price }=\$ 5.99} & {\text { Old size }=240 \mathrm{mL}} \\ {\text { New price }=\$ 5.79} & {\text { New size }=220 \mathrm{mL}}\end{array}\nonumber \]
How You Will Get There
Step 1 (continued):
Convert the price and size to a price per millilitre by taking the price and dividing by the size.
Step 2:
Apply Formula 3.1.
Perform
Step 1:
\[\dfrac{\text { Old price }}{\text { Old size }}=\dfrac{\$ 5.99}{240 \mathrm{mL}}=\$ 0.024958 \text{ per } \mathrm{mL}\nonumber \]
\[\dfrac{\text { New price }}{\text { New size }}=\dfrac{\$ 5.79}{220 \mathrm{mL}}=\$ 0.026318 \text { per } \mathrm{mL}\nonumber \]
Step 2:
\[\begin{array}{ll}{\Delta \%} & {=\dfrac{\$ 0.026318-\$ 0.024958}{\$ 0.024958} \times 100} \\ { } & {=\dfrac{\$ 0.001359}{\$ 0.024958} \times 100=5.4485 \%}\end{array}\nonumber \]
Calculator Instructions
| OLD | NEW | %CH | #PD |
|---|---|---|---|
| \(5.99 \div 240=\) | \(5.79 \div 200=\) | Answer: 5.4484 | 1 |
The price per mL has increased by 5.4485%. Note that to the consumer, it would appear as if the price has been lowered from $5.99 to $5.79, as most consumers would not notice the change in the bottle size.
Rate of Change over Time
The percent change measures the change in a variable from start to end overall. It is based on the assumption that only a single change occurs. What happens when the ending number results from multiple changes and you want to know the typical value of each change? For example, the population of the Toronto census metropolitan area (CMA) has grown from 4,263,759 in 1996 to 5,113,149 in 2006. What annual percentage growth in population does this reflect? Notice that we are not interested in calculating the change in population over the 10 years; instead we want to determine the percentage change in each of the 10 years. The rate of change over time measures the percent change in a variable per time period.
The Formula
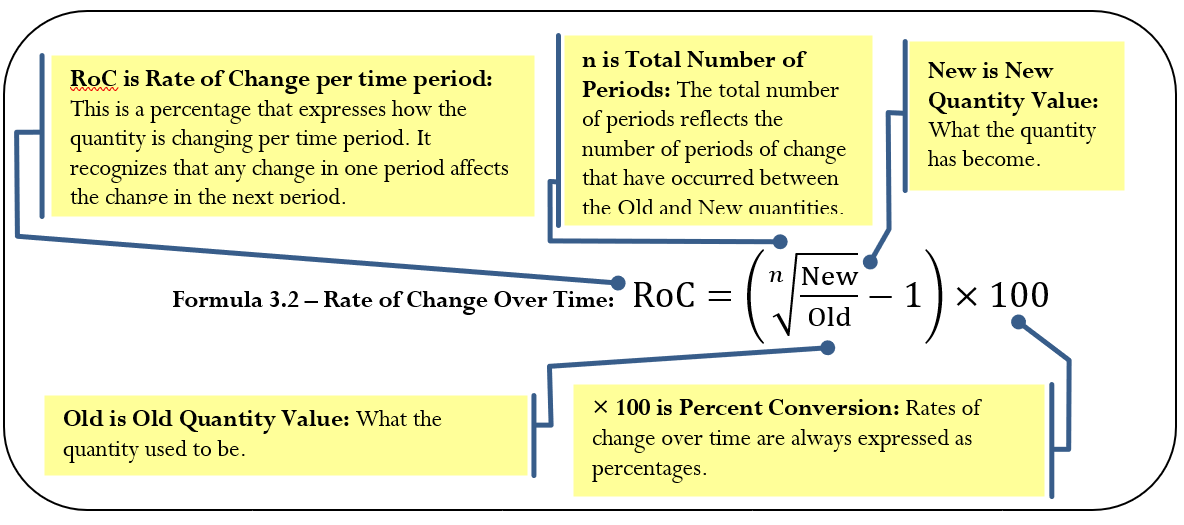
Calculating the rate of change over time is not as simple as dividing the percent change by the number of time periods involved, because you must consider the change for each time period relative to a different starting quantity. For example, in the Toronto census example, the percent change from 1996 to 1997 is based on the original population size of 4,263,759. However, the percent change from 1997 to 1998 is based on the new population figure for 1997. Thus, even if the same number of people were added to the city in both years, the percent change in the second year is smaller because the population base became larger after the first year. As a result, when you need the percent change per time period, you must use Formula 3.2.
How It Works
When you work with any rate of change over time, follow these steps:
Step 1: Identify the three known variables and the one unknown variable.
Step 2: Solve for the unknown variable using Formula 3.2.
Important Notes
On your calculator, calculate the rate of change over time using the percent change (\(\Delta \%\)) function. Previously, we had ignored the #PD variable in the function and it was always assigned a value of 1. In rate of change, this variable is the same as \(n\) in our equation. Therefore, if our question involved 10 changes, such as the annual population change of the Toronto CMA from 1996 to 2006, then this variable is set to 10.
Paths To Success
You may find it difficult to choose which formula to use: percent change or rate of change over time. To distinguish between the two, consider the following:
- If you are looking for the overall rate of change from beginning to end, you need to calculate the percent change.
- If you are looking for the rate of change per interval, you need to calculate the rate of change over time.
Ultimately, the percent change formula is a simplified version of the rate of change over time formula where \(n = 1\). Thus you can solve any percent change question using Formula 3.2 instead of Formula 3.1.
For each of the following, distinguish whether you should solve the question by the percent change formula or the rate of change over time formula.
- When Peewee started five-pin bowling with the Youth Bowling Canada (YBC) in 1997, his average was 53. In 2011, he finished his last year of the YBC with an average of 248. How did his average change from 1997 to 2011?
- A stock was priced at $4.34 per share in 2006 and reached $7.15 per share in 2012. What annual return did a shareholder realize?
- In 2004, total sales reached $1.2 million. By 2010, sales had climbed to $4.25 million. What is the growth in sales per year?
- Answer
-
- Percent change; looking for overall change
- Rate of change over time; looking for change per year
- Rate of change over time; looking for change per year
Using the Toronto CMA information, where the population grew from 4,263,759 in 1996 to 5,113,149 in 2006, calculate the annual percent growth in the population.
Solution
We need to calculate the percent change per year, which is the rate of change over time, or \(RoC\).
What You Already Know
Step 1:
We know the starting and ending numbers for the population along with the time frame involved.
Old = 4,263,759, New = 5,113,149
\(n = 2006 − 1996 = 10\) years
How You Will Get There
Step 2:
Apply Formula 3.2.
Perform
Step 2:
\[\begin{aligned}
RoC&=\left (\sqrt[10]{\dfrac{5,113,149}{4,263,759}}-1\right) \times 100 \\
&=(\sqrt[10]{1.199211}-1) \times 100 \\
&=(1.018332-1) \times 100 \\
&=0.018332 \times 100\\
&=1.8332 \%
\end{aligned} \nonumber \]
Calculator Instructions
| OLD | NEW | %CH | #PD |
|---|---|---|---|
| 4263759 | 5113149 | Answer: 1.833244 | 10 |
Over the 10 year span from 1996 to 2006, the CMA of Toronto grew by an average of 1.8332% per year.
Kendra collects hockey cards. In her collection, she has a rookie year Wayne Gretzky card in mint condition. The book value of the card varies depending on demand for the card and its condition. If the estimated book value of the card fell by $84 in the first year and then rose by $113 in the second year, determine the following:
- What is the percent change in each year if the card is valued at $1,003.33 at the end of the first year?
- Over the course of the two years, what was the overall percent change in the value of the card?
- What was the rate of change per year?
Solution
We need to provide four answers to the questions and find the percent change in year 1, or \(∆\%_1\), then the percent change in year 2, or \(∆\%_2\). Using these first two solutions, we calculate both the overall percent change across both years, or \(∆\%_{\text{overall}}\), and the rate of change per year, or \(RoC\).
What You Already Know
Step 1:
We know the price of the card at the end of the first year as well as how it has changed each year.
Price at end of first year = $1,003.33
Price change in first year = −$84
Price change in second year = $113
How You Will Get There
Step 2: Calculate the price at the beginning of the first year.
Step 3: For the percent change in Year 1, apply Formula 3.1: \(\Delta \%_{1}\)
Step 4: Calculate the price at the end of the second year.
Step 5: For the percent change in Year 2, apply Formula 3.1: \(\Delta \%_{2}\)
Step 6: For the overall percent change, take the old price at the beginning of the first year and compare it to the new price at the end of the second year.
Apply Formula 3.1: \(∆\%_{\text{overall}} \)
Step 7: Calculate the rate of change over the two years using the same two prices, but apply Formula 3.2.
Perform
Step 2:
\[\text{New}=\text{Old}+\text { Change; } \quad \$ 1,003.33=\text{Old}-\$ 84.00 ; \quad \$ 1,087.33=\text{Old}\nonumber \]
Step 3:
\[\Delta \%_{1}=\dfrac{\$ 1,003.33-\$ 1,087.33}{\$ 1,087.33} \times 100=-7.7253 \%\nonumber \]
Step 4:
\[\text { New }=\text{Old}+\text { Change }=\$ 1,003.33+\$ 113=\$ 1,116.33\nonumber \]
Step 5:
\[\Delta \%_{2}=\dfrac{\$ 1,116 \cdot 33-\$ 1,003.33}{\$ 1,003.33} \times 100=11.2625 \%\nonumber \]
Step 6:
\[\Delta \%_{\text {overall }}=\dfrac{\$ 1,116.33-\$ 1,087.33}{\$ 1,087.33} \times 100=2.6671 \%\nonumber \]
Step 7:
\[RoC=(\sqrt[2]{\dfrac{\$ 1,116 \cdot 33}{\$ 1,087 \cdot 33}}-1) \times 100=1.3248 \%\nonumber \]
Calculator Instructions
| Calculation | OLD | NEW | %CH | #PD |
|---|---|---|---|---|
| Year 1 | 1087.33 | 1003.33 | Answer: -7.725345 | 1 |
| Year 2 | 1003.33 | 1116.33 | Answer: 11.262495 | 1 |
| Both Years | 1087.33 | 1116.33 | Answer: 2.667083 | 1 |
| RoC | 1087.33 | 1116.33 | Answer: 1.324766 | 2 |
The value of the hockey card dropped 7.7253% in the first year and rose 11.2625% in the second year. Overall, the card rose by 2.6671% across both years, which represents a growth of 1.3248% in each year.