
4.3: Indexes (The Times Are Changing)
- Page ID
- 22085

You read in the Financial Post that the S&P/TSX Composite Index is up 12.74 points while the NASDAQ is down 45.98, and you wonder what this means for your investment portfolio. The consumer price index rose 3.1% since last year, and you wonder if the raise your employer offered you keeps pace. You need to understand indexes to make sense of these numbers.
What Is An Index?
An index is a number used to compare two quantities sharing the same characteristic as measured under different circumstances. Usually, the comparison involves two different points of time. The two quantities are expressed as a rate of one another and are then converted to an index number using a base value (usually 100 or 1,000). The result is called an index number, which expresses the relationship between the two quantities.
How It Works
Follow these steps to calculate an index number:
Step 1: Identify the base and the base value for the index.
Step 2: Identify the value of the chosen quantity to be compared against the base value.
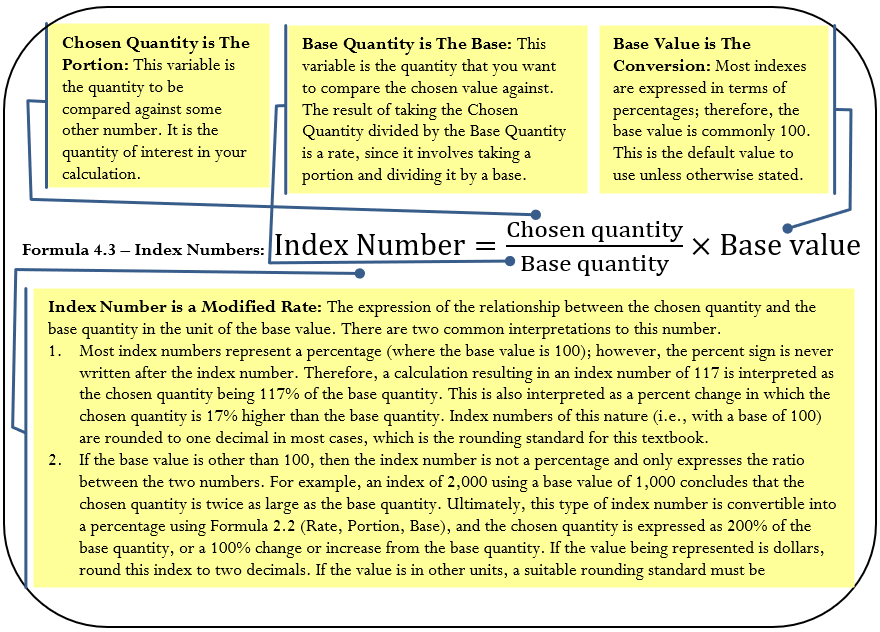
Step 3: Calculate the index number by applying Formula 4.3.
In the above steps, note that in the event that the index number is known and you are solving for a different unknown, identify the known variables in steps 1 and 2. Assume the price of tuition was $3,535.00 in 2009 and $3,978.67 in 2012. The goal is to express the 2012 tuition indexed against the 2009 tuition.
Step 1: The tuition in 2009 is the amount to be compared against; thus, Base Quantity = $3,535. No base value is specified; thus, use the default of Base Value = 100.
Step 2: The 2012 tuition is the quantity for which you wish to compute the index, resulting in Chosen Quantity = $3,978.67.
Step 3: \(\text { The Index Number }=\dfrac{\$ 3,978.67}{\$ 3,535.00} \times 100=112.6\). You can conclude that tuition in 2012 is 112.6% higher than 2009, or that tuition has increased by 12.6% over the three years.
In January 2000, the average price of gold per troy ounce was $284.32 (in US dollars). In May 2011, the average price of gold was $1,494.89. Express the gold price in 2011 indexed against the gold price in 2000.
Solution
You need to calculate an index number that compares the 2011 gold price against the 2000 gold price.
What You Already Know
Step 1:
Base Quantity = 2000 price = $284.32; assume the standard Base Value = 100
Step 2:
Chosen Quantity = 2011 price = $1,494.89
How You Will Get There
Step 3:
Apply Formula 4.3.
Perform
Step 3:
\(\text { Index Number }=\dfrac{\$ 1,494.89}{\$ 284.32} \times 100=525.8\nonumber \)
The May 2011 gold price has an index number of 525.8 when compared to the January 2000 price. This means that the price of gold has increased by 425.8% over the approximate 11-year period.
Specialty Indexes
While indexes can be created for any comparison of two quantities, two specialized indexes are widely used across the business and financial sectors of Canada: the consumer price index and the S&P/TSX Composite Index.
Consumer Price Index
One of the most closely watched price indexes in Canada is the consumer price index, or CPI. Historical values for this index (base year = 2002) are illustrated the graph on the left while the historical rates of inflation (1915-2012) are depicted in the graph on the right.[1]
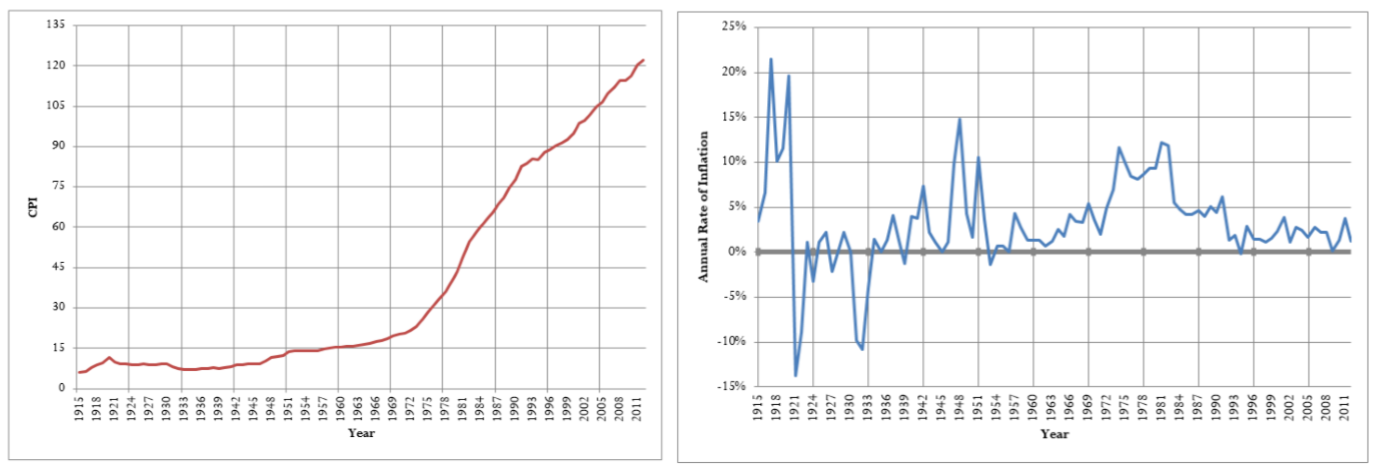
The CPI, calculated by Statistics Canada on a monthly basis, is used as a measure for estimating the rate of inflation or the cost of living (notice the slope of the CPI line increases or decreases in accordance with the change in the rate of inflation). The CPI measures the average price of the goods and services that a typical Canadian household commonly purchases, which is called the market basket. This basket contains about 600 items in categories such as food, housing, transportation, furniture, recreation, and clothing. The CPI is used for many purposes, such as increases in wages, pensions, salaries, prices, the Canada Pension Plan (CPP), and Old Age Security (OAS).
In the section opener, you need to know the CPI in discussing your raise with your employer. Since the CPI reflects the changing cost of living, you must ensure that any raise your employer offers covers, at the barest minimum, the increased costs of living. For example, if the CPI increased from 114.3 to 116.5 over the year, reflecting a 1.78% rate of inflation, then your raise needs to be at least 1.78% to keep you in the same financial position as last year.
S&P/TSX Composite Index
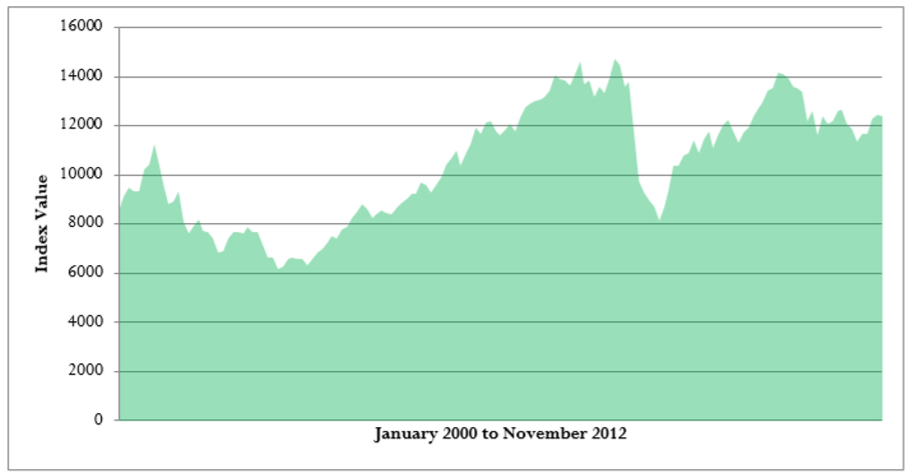
Another index reported daily and nationally across Canada is the Standard & Poor's/Toronto Stock Exchange Composite Index, or S&P/TSX Composite Index. This index captures the equity prices of approximately 200 of Canada's largest companies on the Toronto Stock Exchange as measured by their market capitalization, representing approximately 70% of the Canadian market capitalization listed on the TSX. The historical values of the index are illustrated on the previous page. The exact number of companies in the index continually changes because of strict requirements on market capitalization, liquidity, and domicile that must be met. The index is a measure of the strength and direction of the economy of Canada. For example, during the 2008 subprime mortgage crisis in the United States, the index retreated from a value of 14,714 to just over 8,123 in a very short time frame (demonstrating the close interconnectedness of Canada’s economy with that of the United States). At this time, the Canadian economy entered its first recession in years.
In the section opener, knowing the S&P/TSX Composite Index is invaluable for the meeting with your financial adviser to evaluate the health of your investment portfolio. For example, from May 2010 to May 2011 the index rose approximately 15.7%. If your investment portfolio rose by 9% over the same time frame (which on its own sounds impressive), you know from comparison to the index that your portfolio in fact had a subpar performance.
The Formula
The base year used in CPI calculations is mid-2002, and the base value is 100. The CPI is always rounded to one decimal. The base year used in S&P/TSX calculations is 1975, and the base value is 1,000. The S&P/TSX is always rounded to two decimals. Regardless of which index is being calculated, Formula 4.3 remains unchanged.
Often when you are working with these indexes, you want to compare how quantities have increased or decreased. This requires you to use Formula 3.1 (Percent Change) to calculate percent changes.
How It Works
No new steps or procedures are required when you work with the CPI or the S&P/TSX Composite Index. To calculate the value of an index, apply the index number steps. To calculate the percent change between two index values, apply the percent change steps.
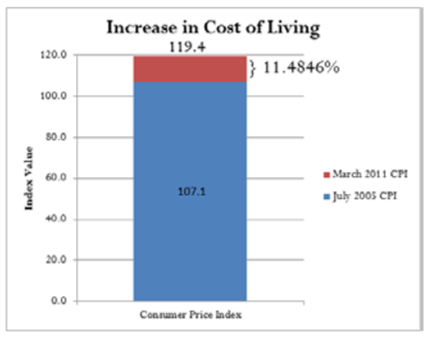
For example, in July 2005 the CPI was 107.1. In March 2011 the CPI was 119.4. How much did the cost of living rise from July 2005 to March 2011?
To solve this problem, apply the percent change steps:
Step 1: New = 119.4 and Old = 107.1. You are looking for the \(\Delta \%\).
Step 2: Substituting into Formula 3.1: \(\Delta \%=\dfrac{119.4-107.1}{107.1} \times 100=11.4846 \%\) You can conclude that the cost of living has risen by 11.4846% over the approximate six-year time frame.
Important Notes
From time to time, Statistics Canada updates the base period for the CPI and adjusts all CPI numbers accordingly. Previously, the base period was 1992 before being adjusted to 2002. Another update to the base period can probably be expected soon; however, this occurs retroactively since it takes time to recalculate all indexes and gather all of the latest data.
If you had invested $15,000 into an S&P/TSX portfolio in 1975, how much money would you have in 2011 when the S&P/TSX Composite Index indicated a value of 13,607.25?
Solution
You need to determine the amount of money in the portfolio at the current time period of 2011. This amount represents the Chosen Quantity.
What You Already Know
Step 1:
Since the money was invested in the base year (1975), the amount of the investment is the base quantity.
Base Quantity = $15,000 Base Value = 1,000
Step 2:
In this case, seek the Chosen Quantity with a known
Index Number = 13,607.25
How You Will Get There
Step 3:
Apply Formula 4.3 and rearrange for Chosen Quantity.
Perform
Step 3:
\(13,607.25=\dfrac{\text { Chosen Quantity }}{\$ 15,000} \times 1,000\)
\(204,108,750=\text { Chosen Quantity } \times 1,000\)
\(\$ 204,108.75=\text { Chosen Quantity }\)
If you had invested $15,000 in the S&P/TSX Composite Index back in 1975, your investment portfolio is now valued at $204,108.75, representing an increase of 1,260.725%.
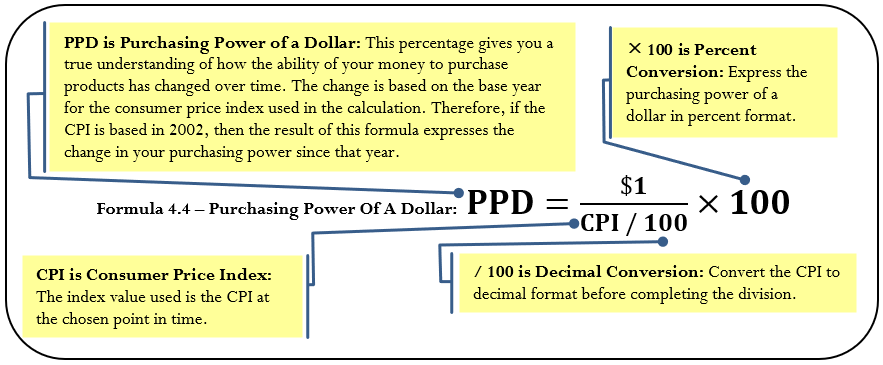
Purchasing Power of a Dollar
The consumer price index is applied in determining the purchasing power of a dollar, which is the amount of goods and services that can be exchanged for a dollar. The result of the calculation is a percentage showing how much more or less product is received in return for every dollar spent. For example, recall that my parents could attend a movie for 25¢ in the 1950s. If my parents had lost that quarter under their mattress and found it today, the quarter no longer can purchase admission to the movie (nor much else!). Therefore, the purchasing power of that quarter has drastically declined.
How It Works
Follow these steps to calculate the purchasing power of a dollar:
Step 1: Choose the point in time to perform the calculation. Identify the value of the CPI at that point in time as well as noting the base year upon which the CPI is determined (so you can properly interpret the calculated amount). Note that in the event that the purchasing power is known and you are solving for a different unknown, you must identify the known variables in this step.
Step 2: Calculate the purchasing power of a dollar by applying Formula 4.4.
Assume the CPI is 111.1 today. How has your purchasing power changed since 2002 (the base year for the CPI)?
Step 1: The \(CPI = 111.1\) and the base year is 2002.
Step 2: Substitute into the formula: \(PPD=\dfrac{\$ 1}{111.1 / 100} \times 100=90.009 \%\). Therefore, your purchasing power is 90.009% what it was in 2002. In 2002, if you could buy 10 loaves of bread with your dollar, today you could buy approximately nine loaves of bread with the same amount of money. In other words, your dollar purchases about 10% less product with the same amount of money.
In March 2006, the CPI was 108.6. By March 2011 it had risen to 119.4. As a percent change, how did your purchasing power change over that time frame?
Solution
You need to calculate the percent change, or \(∆\%\), between the purchasing power of a dollar (\(PPD\)) in 2006 and 2011.
What You Already Know
Step 1:
2006 represents your purchasing power of a dollar in the past, and 2011 represents the present.
Old = \(PPD\) in 2006 New = \(PPD\) in 2011
CPI 2006 = 108.6 CPI 2011 = 119.4
The current CPI is based in 2002.
How You Will Get There
Step 2:
Apply Formula 4.4 to calculate the \(PPD\) for both 2006 and 2011.
Step 3:
Apply Formula 3.1 to calculate the percent change.
Perform
Step 2:
\(PPD\; 2006=\dfrac{\$ 1}{108.6 / 100} \times 100=92.0810 \%\)
\(PPD\; 2011=\dfrac{\$ 1}{119.4 / 100} \times 100=83.7521 \%\)
Step 3:
\(\Delta \%=\dfrac{0.837521-0.920810}{0.920810} \times 100=-9.0452 \%\)
Calculator Instructions
| OLD | NEW | %CH | #PD |
|---|---|---|---|
| 0.920810 | 0.837521 | Answer: -9.045188 | 1 |
From March 2006 to March 2011, your purchasing power declined by 9.0452%. This means that if in March 2006 you were able to buy approximately 92 items with a certain sum of money, in March 2011 you were only able to buy about 83 items with the same amount of money.
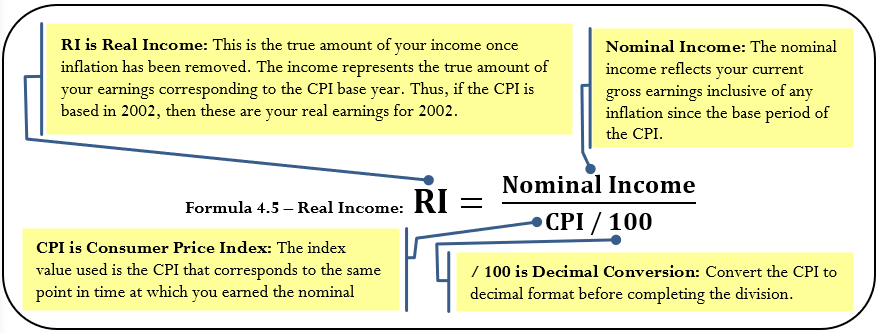
Real Income
Another application of the consumer price index allows you to assess your real earnings. With the cost of living (inflation) always changing, it is difficult to assess how much more or less money you are truly making. Real income allows you to remove the effects of inflation from your income, allowing for a fair comparison of earnings at different points in time. For example, if your gross earnings last year were $50,000 and you received a $1,500 raise this year, how much more are you truly earning if the CPI changed from 114.6 to 116.6 over the same time frame?
How It Works
Follow these steps to calculate your real income:
Step 1: Identify the nominal income. Determine the CPI value that corresponds to the same time frame as the nominal income and note the base year for interpretation purposes. In the event that the real income is known and you are solving for a different unknown, you must identify the known variables in this step.
Step 2: Calculate the real income by applying Formula 4.5.
Assume your gross earnings were $40,000 when the CPI was 111.7. Currently your income is $42,000 and the CPI is 113.3. Calculate your real income to assess how your income has changed.
Step 1: In this case, you have two nominal incomes to convert for comparison purposes. In the past, nominal income = $40,000 and CPI = 111.7. Currently, nominal income = $42,000 and CPI = 113.3.
Step 2: In the past, \(RI=\dfrac{\$ 40,000}{111.7 / 100}=\$ 35,810.21\). Currently, \(RI=\dfrac{\$ 42,000}{1.133 / 100}=\$ 37,069.73\). Comparing the amounts, you see that your real income expressed in 2002 dollars has risen by $37,069.73 − $35,810.21 = $1,259.52. Notice that your nominal income rose by $2,000. This means that of your $2,000 increase in income, you really are only making $1,259.82 more. The other $740.18 represents your increased cost of living.
Now that your boss has conducted your performance review, the time has come to discuss your raise. Currently, you earn $81,250 annually. Your boss has offered you a new salary of $83,000 annually. You know last year that the CPI was 104.1 and this year it sits at 106.6. Assess the salary offer.
Solution
To assess the offer, remove inflation from your nominal incomes, allowing for a fair comparison between the two salary amounts. Calculate the real income (\(RI\)) for each salary.
What You Already Know
Step 1:
You know the following information about your old and new salaries:
Old Nominal Income = $81,250 Old CPI = 104.1
New Nominal Income = $83,000 New CPI = 106.6
Both CPI amounts are based on the year 2002.
How You Will Get There
Step 2:
Apply Formula 4.5 to each salary.
Perform
Step 2:
\(\text { RI Last Year }=\dfrac{\$ 81,250}{104.1 / 100}=\$ 78,049.95\)
\(\text { RI This Year }=\dfrac{\$ 83,000}{106.6 / 100}=\$ 77,861.16\)
$77,861.16 − $78,049.95 = −$188.79
Although it appears as if you are receiving a $1,750 wage increase, when you factor in the increased cost of living you are actually earning $188.79 less than you did last year. Perhaps you should discuss this matter further with your boss. Since the CPI had a percent change of 2.4015%, your income must rise to at least $83,201.25 for you to break even.
References
- Values determined from Bank of Canada “Inflation Calculator” (all index values measured in May of each year). www.bankofcanada.ca/rates/related/inflation-calculator/?page_moved=1 (accessed November 26, 2012).