
5.2: Break-Even Analysis (Sink or Swim)
- Page ID
- 22091

Should you start up the Internet business described in the last section? Right now, all you have are some projected costs and a forecasted level of sales. You imagine you are going to sell 400 units. Is that possible? Is it reasonable to forecast this many sales?
Now you may say to yourself, “400 units a month . . . that's about 13 per day. What's the big deal?” But let’s gather some more information. What if you looked up your industry in Statistics Canada data and learned that the product in question sells just 1,000 units per month in total? Statistics Canada also indicates that there are eight existing companies selling these products. How does that volume of 400 units per month sound now? Unless you are revolutionizing your industry, it is unlikely you will receive a 40% market share in your first month of operations. With so few unit sales in the industry and too many competitors, you might be lucky to sell 100 units. If this is the case, are you still profitable?
Simply looking at the fixed costs, variable costs, potential revenues, contribution margins, and typical net income is not enough. Ultimately, all costs in a business need to be recovered through sales. Do you know how many units have to be sold to pay your bills? The answer to this question helps assess the feasibility of your business idea.
What Is Break-Even Analysis?
If you are starting your own business and head to the bank to initiate a start-up loan, one of the first questions the banker will ask you is your break-even point. You calculate this number through break-even analysis, which is the analysis of the relationship between costs, revenues, and net income with the sole purpose of determining the point at which total revenue equals total cost. This break-even point is the level of output (in units or dollars) at which all costs are paid but no profits are earned, resulting in a net income equal to zero. To determine the break-even point, you can calculate a break-even analysis in two different ways, involving either the number of units sold or the total revenue in dollars. Each of these two methods is discussed in this section.
Method 1: Break-Even Analysis in Units
In this method, your goal is to determine the level of output that produces a net income equal to zero. This method requires unit information, including the unit selling price and unit variable cost.
It is helpful to see the relationship of total cost and total revenue on a graph. Assume that a company has the following information:
\[TFC=\$ 400 \quad S=\$ 100 \quad VC=\$ 60\nonumber \]
The graph shows dollar information on the \(y\)-axis and the level of output on the \(x\)-axis.
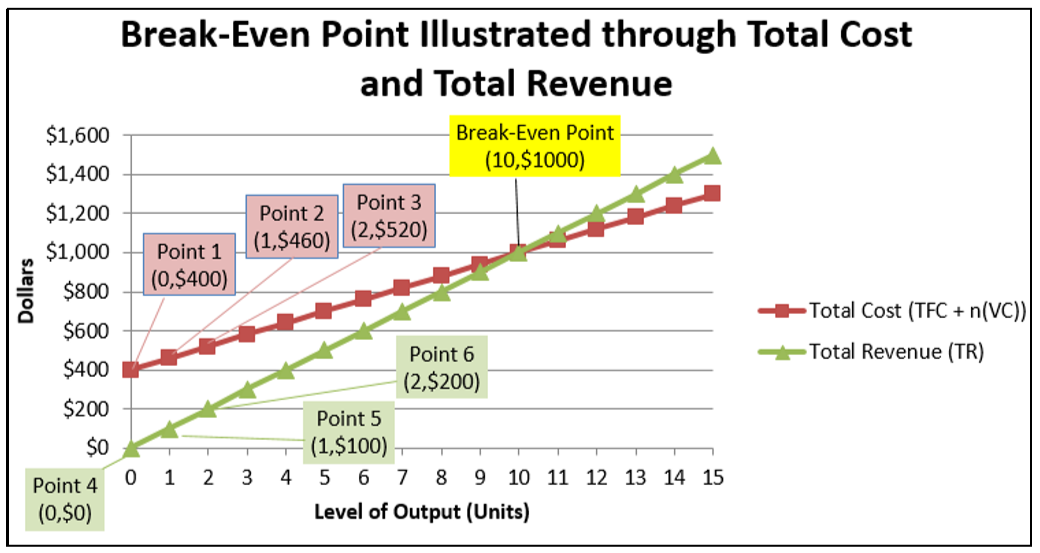
Here is how you construct such a graph:
- Plot the total costs:
- At zero output you incur the total fixed costs of $400. Denote this as Point 1 (0, $400).
- As you add one level of output, the total cost rises in the amount of the unit variable cost. Therefore, total cost is \(TFC+n(VC)=\$ 400+1(\$ 60)=\$ 460\). Denote this as Point 2 (1, $460).
- As you add another level of output (2 units total), the total cost rises once again in the amount of the unit variable cost, producing \(\$ 400+2(\$ 60)=\$ 520\). Denote this as Point 3 (2, $520).
- Repeat this process for each subsequent level of output and plot it onto the figure. The red line plots these total costs at all levels of output.
- Plot the total revenue:
- At zero output, there is no revenue. Denote this as Point 4 (0, $0).
- As you add one level of output, total revenue rises by the selling price of the product. Therefore, total revenue is \(n(S)=1(\$ 100)=\$ 100\). Denote this as Point 5 (1, $100).
- As you add another level of output (2 units total), the total revenue rises once again in the amount of the selling price, producing \(2(\$ 100)=\$ 200\). Denote this as Point 6 (2, $200).
- Repeat this process for each subsequent level of output and plot it onto the figure. The green line plots the total revenue at all levels of output.
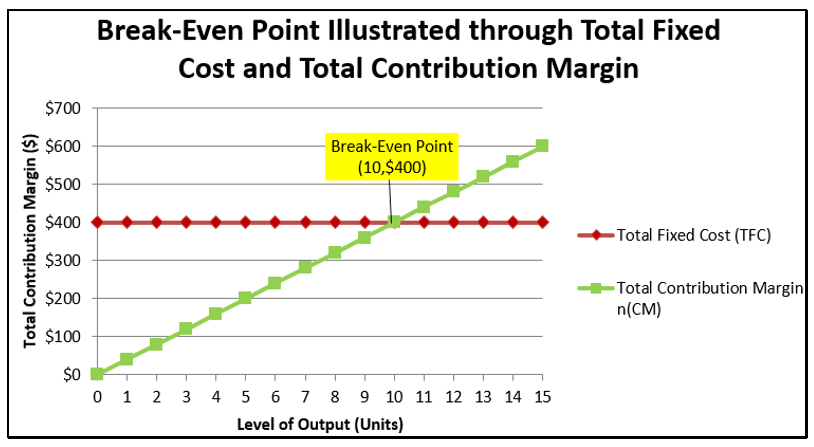
The purpose of break-even analysis is to determine the point at which total cost equals total revenue. The graph illustrates that the break-even point occurs at an output of 10 units. At this point, the total cost is \(\$ 400+10(\$ 60)=\$ 1,000\), and the total revenue is \(10(\$ 100)=\$ 1,000\). Therefore, the net income is \(\$ 1,000-\$ 1,000=\$ 0\); no money is lost or gained at this point.
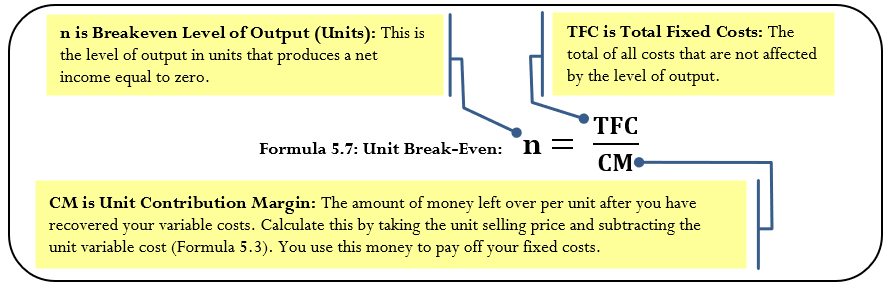
The Formula
Recall that Formula 5.2 states that the net income equals total revenue minus total costs. In break-even analysis, net income is set to zero, resulting in
\[0=n(S)-(TFC+n(VC)) \nonumber \]
Rearranging and solving this formula for \(n\) gives the following:
\[ \begin{align*} 0&=n(S)-TFC-n(VC) \\[4pt] TFC &=n(S)-n(VC) \\[4pt] TFC &=n(S-VC) \\[4pt] \dfrac{TFC}{(S-VC)} &=n \end{align*} \nonumber \]
Formula 5.3 states that \(CM=S-VC\); therefore, the denominator becomes just \(CM\). The calculation of the break-even point using this method is thus summarized in Formula 5.7.
How It Works
Follow these steps to calculate the break-even point in units:
Step 1: Calculate or identify the total fixed costs (\(TFC\)).
Step 2: Calculate the unit contribution margin (\(CM\)) by applying any needed techniques or formulas.
Step 3: Apply Formula 5.7.
Continuing with the example that created the graph on the previous page:
Step 1: Total fixed costs are known, \(TFC=\$ 400\).
Step 2: The unit contribution margin is \(\$ 100-\$ 60=\$ 40\). For each unit sold this is the amount left over that can be applied against total fixed costs.
Step 3: Applying Formula 5.7 results in \(n=\$ 400 \div \$ 40=10\) units.
Important Notes
When you calculate the break-even units, the formula may produce a number with decimals. For example, a break-even point might be 324.39 units. How should you handle the decimal? A partial unit cannot be sold, so the rule is always to round the level of output up to the next integer, regardless of the decimal. Why? The main point of a break-even analysis is to show the point at which you have recovered all of your costs. If you round the level of output down, you are 0.39 units short of recovering all of your costs. In the long-run, you always operate at a loss, which ultimately puts you out of business. If you round the level of output up to 325, all costs are covered and a tiny dollar amount, as close to zero as possible, is left over as profit. At least at this level of output you can stay in business.
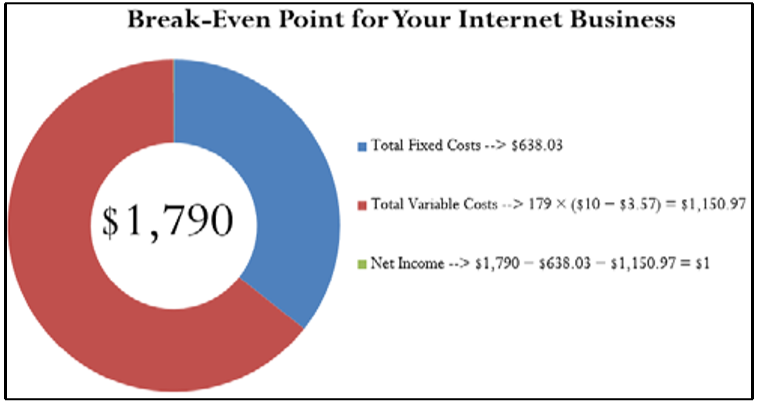
Recall from Section 5.1 the Internet business explored throughout Examples 5.1.1 to 5.1.4. Now let’s determine the break-even point in units. As previously calculated, the total fixed costs are $638.03 and the unit contribution margin is $3.57.
Solution
Calculate the break-even point in units sold, or \(n\) at break-even.
What You Already Know
Step 1:
The total fixed costs are known: \(TFC=\$ 638.03\).
Step 2:
The contribution rate is known: \(CM=\$ 3.57\).
How You Will Get There
Step 3:
Apply Formula 5.7.
Perform
Step 3:
\[n =\dfrac{\$ 638.03}{\$ 3.57}=178.719888\nonumber \]
Round this up to 179.
Calculator Instructions
| FC | VC | P | PFT | Q |
|---|---|---|---|---|
| 638.03 | 6.43 | 10 | 0 | Answer: 178.719888 |
In order for your Internet business to break even, you must sell 179 units. At a price of $10 per unit, that requires a total revenue of $1,790. At this level of output your business realizes a net income of $1 because of the rounding.
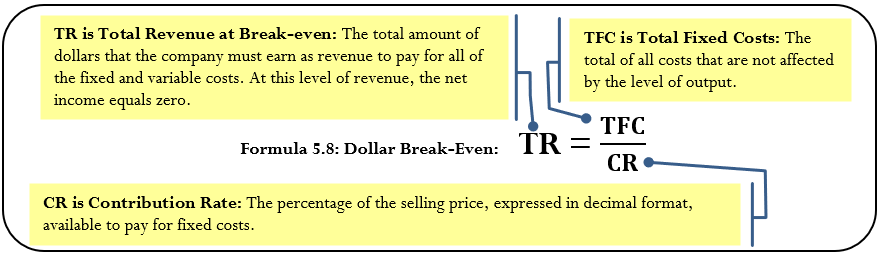
Method 2: Break-Even Analysis in Dollars
The income statement of a company does not display unit information. All information is aggregate, including total revenue, total fixed costs, and total variable costs. Typically, no information is listed about unit selling price, unit variable costs, or the level of output. Without this unit information, it is impossible to apply Formula 5.7.
The second method for calculating the break-even point relies strictly on aggregate information. As a result, you cannot calculate the break-even point in units. Instead, you calculate the break-even point in terms of aggregate dollars expressed as total revenue.
The Formula
To derive the break-even point in dollars, once again start with Formula 5.2, where total revenue at break-even less total fixed costs and total variable costs must equal a net income of zero:
\[NI=TR-(TFC+TVC)\nonumber \]
\[0=TR-(TFC+TVC)\nonumber \]
Rearranging this formula for total revenue gives:
\[0=TR-TFC-TVC\nonumber \]
\[TR=TFC+TVC\nonumber \]
Thus, at the break-even point the total revenue must equal the total cost. Substituting this value into the numerator of Formula 5.6 gives you:
\[CR=(TR-TVC) / TR \times 100\nonumber \]
\[CR=((TFC+TVC)-TVC) / TR \times 100\nonumber \]
\[CR=TFC / TR \times 100\nonumber \]
A final rearrangement results in Formula 5.8, which expresses the break-even point in terms of total revenue dollars.
How It Works
Follow these steps to calculate the break-even point in total revenue dollars:
Step 1: Calculate or identify the total fixed costs (\(TFC\)).
Step 2: Calculate the contribution rate (\(CR\)), by applying any needed techniques or formulas. If not provided, typically the \(CR\) is calculated using Formula 5.6, which requires aggregate information only.
Step 3: Apply Formula 5.8 to calculate the break-even point in dollars.
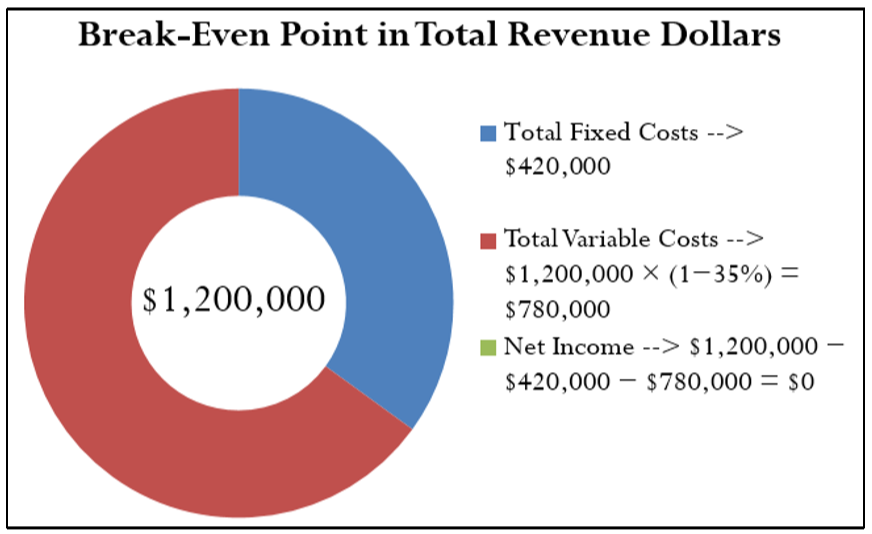
Assume that you are looking at starting your own business. The fixed costs are generally easier to calculate than the variable costs. After running through the numbers, you determine that your total fixed costs are $420,000, or \(TFC=\$ 420,000\). You are not sure of your variable costs but need to gauge your break-even point. Many of your competitors are publicly traded companies, so you go online and pull up their annual financial reports. After analyzing their financial statements, you see that your competitors have a contribution rate of 35%, or \(CR = 0.35\), on average. What is your estimate of your break-even point in dollars?
Step 1: Total fixed costs are \(TFC=\$ 420,000\).
Step 2: The estimated contribution rate is \(CR = 0.35\).
Step 3: Applying Formula 5.8 results in
\(TR=\$ 420,000 \div 0.35=\$ 1,200,000\). If you average a similar contribution rate, you require total revenue of $1,200,000 to cover all costs, which is your break-even point in dollars.
Important Notes
You need to be very careful with the interpretation and application of a break-even number. In particular, the break-even must have a point of comparison, and it does not provide information about the viability of the business.
Break-Even Points Need to Be Compared. The break-even number by itself, whether in units or dollars, is meaningless. You need to compare it against some other quantity (or quantities) to determine the feasibility of the number you have produced. The other number needs to be some baseline that allows you to grasp the scope of what you are planning. This baseline could include but is not limited to the following:
- Industry sales (in units or dollars)
- Number of competitors fighting for market share in your industry
- Production capacity of your business
For example, in your Internet business the break-even point is 179 units per month. Is that good? In the section opener, you explored a possibility where your industry had total monthly sales of 1,000 units and you faced eight competitors. A basic analysis shows that if you enter the industry and if everyone split the market evenly, you would have sales of 1,000 divided by nine companies, equal to 111 units each. To just pay your bills, you would have to sell almost 61% higher than the even split and achieve a 17.9% market share. This doesn't seem very likely, as these other companies are already established and probably have satisfied customers of their own that would not switch to your business.
Break-Even Points Are Not Green Lights. A break-even point alone cannot tell you to do something, but it can tell you not to do something. In other words, break-even points can put up red lights, but at no point does it give you the green light. In the above scenario, your break-even of 179 units put up a whole lot of red lights since it does not seem feasible to obtain. However, what if your industry sold 10,000 units instead of 1,000 units? Your break-even would now be a 1.79% market share (179 units out of 10,000 units), which certainly seems realistic and attainable. This does not mean “Go for it,” however. It just means that from a strictly financial point of view breaking even seems possible. Whether you can actually sell that many units depends on a whole range of factors beyond just a break-even number. For instance, if your Google ad is written poorly you might not be able to generate that many sales. The break-even analysis cannot factor in this non-quantitative variable, and for that reason it cannot offer a “go ahead.”
What would happen to the break-even point in each of the following situations? Would it increase, decrease, or remain the same?
- The unit contribution margin increases.
- The total fixed costs increase.
- The contribution rate decreases.
- Answer
-
- Decrease. In Formula 5.7, the denominator is larger, producing a lower break-even.
- Increase. In both Formula 5.7 and Formula 5.8, the numerator is larger, producing a higher break-even.
- Increase. In Formula 5.8, the denominator is smaller, producing a higher break-even.
In the annual report to shareholders, Borland Manufacturing reported total gross sales of $7,200,000, total variable costs of $4,320,000, and total fixed costs of $2,500,000. Determine Borland's break-even point in dollars.
Solution
Calculate the dollar break-even point, which is the total revenue (\(TR\)) at break-even.
What You Already Know
Step 1:
The total fixed costs are known: \(TFC=\$ 2,500,000\).
Other known information includes the following:
\(TR=\$ 7,200,000, TVC=\$ 4,320,000\)
How You Will Get There
Step 2:
Calculate the contribution rate by applying Formula 5.6.
Step 3:
Apply Formula 5.8.
Perform
Step 2:
\[CR=\dfrac{\$ 7,200,000-\$ 4,320,000}{\$ 7,200,000} \times 100=\dfrac{\$ 2,880,000}{\$ 7,200,000} \times 100=40 \%\nonumber \]
Step 3:
\[TR=\dfrac{\$ 2,500,000}{40 \%}=\dfrac{52,500,000}{0.4}=\$ 6,250,000\nonumber \]
Borland Manufacturing achieves its break-even point at $6,250,000 in total revenue. At this point, total fixed costs are $2,500,000 and total variable costs are $3,750,000, producing a net income of zero.