
9.2: Representing Ratios with Diagrams
- Page ID
- 39921

Lesson
Let's use diagrams to represent ratios.
Exercise \(\PageIndex{1}\): Number Talk: Dividing \(4\) and Multiplying by \(\frac{1}{4}\)
Find the value of each expression mentally.
- \(24\div 4\)
- \(\frac{1}{4}\cdot 24\)
- \(24\cdot\frac{1}{4}\)
- \(5\div 4\)
Exercise \(\PageIndex{2}\): A Collection of Snap Cubes
Here is a collection of snap cubes.
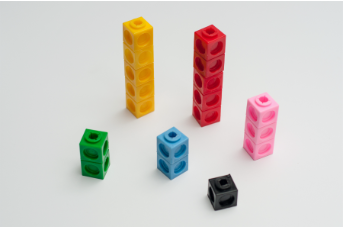
- Choose two of the colors in the image, and draw a diagram showing the number of snap cubes for these two colors.
- Trade papers with a partner. On their paper, write a sentence to describe a ratio shown in their diagram. Your partner will do the same for your diagram.
- Return your partner’s paper. Read the sentence written on your paper. If you disagree, explain your thinking.
Exercise \(\PageIndex{3}\): Blue Paint and Art Paste
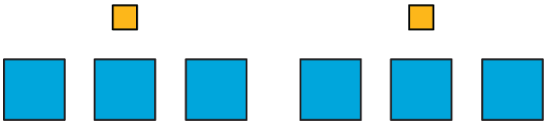
Elena mixed 2 cups of white paint with 6 tablespoons of blue paint.
Here is a diagram that represents this situation.
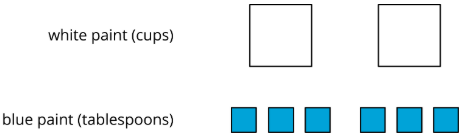
- Discuss each statement, and circle all those that correctly describe this situation. Make sure that both you and your partner agree with each circled answer.
- The ratio of cups of white paint to tablespoons of blue paint is \(2:6\).
- For every cup of white paint, there are 2 tablespoons of blue paint.
- There is 1 cup of white paint for every 3 tablespoons of blue paint.
- There are 3 tablespoons of blue paint for every cup of white paint.
- For each tablespoon of blue paint, there are 3 cups of white paint.
- For every 6 tablespoons of blue paint, there are 2 cups of white paint.
- The ratio of tablespoons of blue paint to cups of white paint is 6 to 2.
- Jada mixed 8 cups of flour with 2 pints of water to make paste for an art project.
- Draw a diagram that represents the situation.
- Write at least two sentences describing the ratio of flour and water.
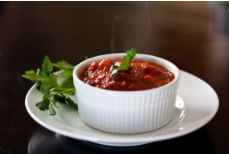
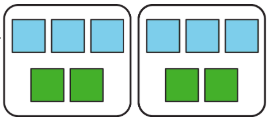
Exercise \(\PageIndex{4}\): Card Sort: Spaghetti Sauce
Your teacher will give you cards describing different recipes for spaghetti sauce. In the diagrams:
- a circle represents a cup of tomato sauce
- a square represents a tablespoon of oil
- a triangle represents a teaspoon of oregano
- Take turns with your partner to match a sentence with a diagram.
- For each match that you find, explain to your partner how you know it’s a match.
- For each match that your partner finds, listen carefully to their explanation. If you disagree, discuss your thinking and work to reach an agreement.
- After you and your partner have agreed on all of the matches, check your answers with the answer key. If there are any errors, discuss why and revise your matches.
- There were two diagrams that each matched with two different sentences. Which were they?
- Diagram _______ matched with both sentences ______ and ______.
- Diagram _______ matched with both sentences ______ and ______.
- Select one of the other diagrams and invent another sentence that could describe the ratio shown in the diagram.
Are you ready for more?
Create a diagram that represents any of the ratios in a recipe of your choice. Is it possible to include more than 2 ingredients in your diagram?
Summary
Ratios can be represented using diagrams. The diagrams do not need to include realistic details. For example, a recipe for lemonade says, “Mix 2 scoops of lemonade powder with 6 cups of water.”
Instead of this:
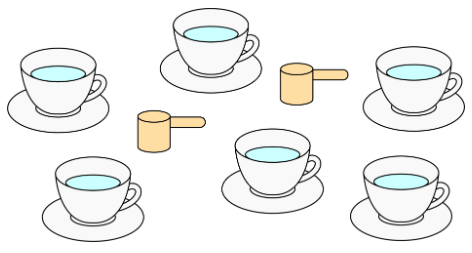
We can draw something like this:
This diagram shows that the ratio of cups of water to scoops of lemonade powder is 6 to 2. We can also see that for every scoop of lemonade powder, there are 3 cups of water.
Glossary Entries
Definition: Ratio
A ratio is an association between two or more quantities.
For example, the ratio \(3:2\) could describe a recipe that uses 3 cups of flour for every 2 eggs, or a boat that moves 3 meters every 2 seconds. One way to represent the ratio \(3:2\) is with a diagram that has 3 blue squares for every 2 green squares.
Practice
Exercise \(\PageIndex{5}\)
Here is a diagram that describes the cups of green and white paint in a mixture.
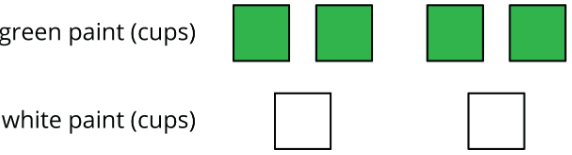
Select all the statements that correctly describe this diagram.
- The ratio of cups of white paint to cups of green paint is 2 to 4.
- For every cup of green paint, there are two cups of white paint.
- The ratio of cups of green paint to cups of white paint is \(4:2\).
- For every cup of white paint, there are two cups of green paint.
- The ratio of cups of green paint to cups of white paint is \(2:4\).
Exercise \(\PageIndex{6}\)
To make a snack mix, combine 2 cups of raisins with 4 cups of pretzels and 6 cups of almonds.
- Create a diagram to represent the quantities of each ingredient in this recipe.
- Use your diagram to complete each sentence.
- The ratio of __________________ to __________________ to __________________ is ________ : ________ : ________.
- There are ________ cups of pretzels for every cup of raisins.
- There are ________ cups of almonds for every cup of raisins.
Exercise \(\PageIndex{7}\)
- A square is 3 inches by 3 inches. What is its area?
- A square has a side length of 5 feet. What is its area?
- The area of a square is 36 square centimeters. What is the length of each side of the square?
(From Unit 1.6.1)
Exercise \(\PageIndex{8}\)
Find the area of this quadrilateral. Explain or show your strategy.
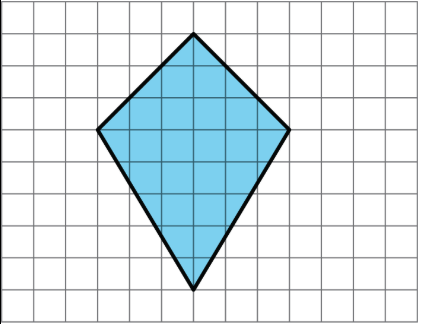
(From Unit 1.4.1)
Exercise \(\PageIndex{9}\)
Complete each equation with a number that makes it true.
- \(\frac{1}{8}\cdot 8=\underline{\qquad}\)
- \(\frac{3}{8}\cdot 8=\underline{\qquad}\)
- \(\frac{1}{8}\cdot 7=\underline{\qquad}\)
- \(\frac{3}{8}\cdot 7=\underline{\qquad}\)
(From Unit 2.1.1)