
11.1: Introducing Double Number Line Diagrams
- Page ID
- 39929
Lesson
Let's use number lines to represent equivalent ratios.
Exercise \(\PageIndex{1}\): Number Talk: Adjusting Another Factor
Find the value of each product mentally.
\((4.5)\cdot 4\)
\((4.5)\cdot 8\)
\(\frac{1}{10}\cdot 65\)
\(\frac{2}{10}\cdot 65\)
Exercise \(\PageIndex{2}\): Drink Mix on a Double Number Line
The other day, we made drink mixtures by mixing 4 teaspoons of powdered drink mix for every cup of water. Here are two ways to represent multiple batches of this recipe:
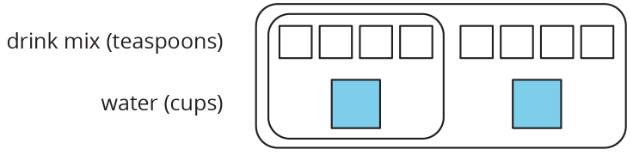
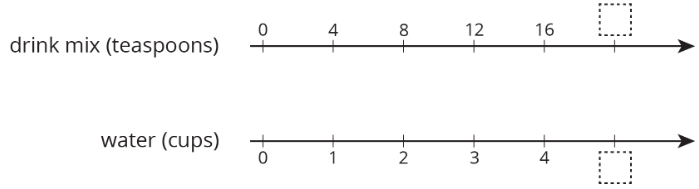
- How can we tell that \(4:1\) and \(12:3\) are equivalent ratios?
- How are these representations the same? How are these representations different?
- How many teaspoons of drink mix should be used with 3 cups of water?
- How many cups of water should be used with 16 teaspoons of drink mix?
- What numbers should go in the empty boxes on the double number line diagram? What do these numbers mean?
Are you ready for more?
Recall that a perfect square is a number of objects that can be arranged into a square. For example, 9 is a perfect square because 9 objects can be arranged into 3 rows of 3. 16 is also a perfect square, because 16 objects can be arranged into 4 rows of 4. In contrast, 12 is not a perfect square because you can’t arrange 12 objects into a square.
- How many whole numbers starting with 1 and ending with 100 are perfect squares?
- What about whole numbers starting with 1 and ending with 1,000?
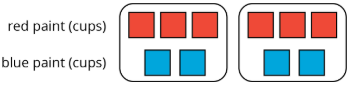
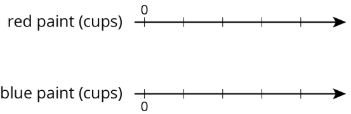
Exercise \(\PageIndex{3}\): Blue Paint on a Double Number Line
Here is a diagram showing Elena’s recipe for light blue paint.
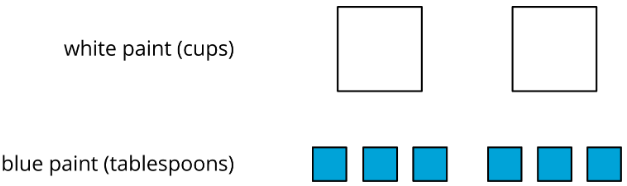
- Complete the double number line diagram to show the amounts of white paint and blue paint in different-sized batches of light blue paint.
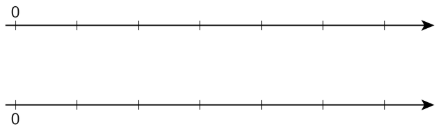
- Compare your double number line diagram with your partner. Discuss your thinking. If needed, revise your diagram.
- How many cups of white paint should Elena mix with 12 tablespoons of blue paint? How many batches would this make?
- How many tablespoons of blue paint should Elena mix with 6 cups of white paint? How many batches would this make?
- Use your double number line diagram to find another amount of white paint and blue paint that would make the same shade of light blue paint.
- How do you know that these mixtures would make the same shade of light blue paint?
Summary
You can use a double number line diagram to find many equivalent ratios. For example, a recipe for fizzy juice says, “Mix 5 cups of cranberry juice with 2 cups of soda water.” The ratio of cranberry juice to soda water is \(5:2\). Multiplying both ingredients by the same number creates equivalent ratios.
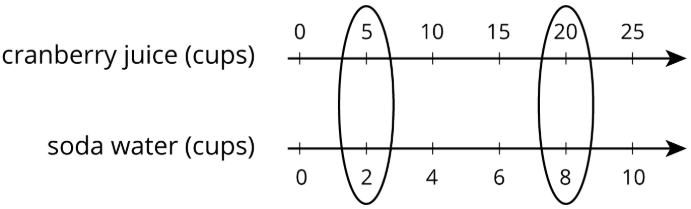
This double number line shows that the ratio \(20:8\) is equivalent to \(5:2\). If you mix 20 cups of cranberry juice with 8 cups of soda water, it makes 4 times as much fizzy juice that tastes the same as the original recipe.
Glossary Entries
Definition: Double Number Line Diagram
A double number line diagram uses a pair of parallel number lines to represent equivalent ratios. The locations of the tick marks match on both number lines. The tick marks labeled 0 line up, but the other numbers are usually different.
Practice
Exercise \(\PageIndex{4}\)
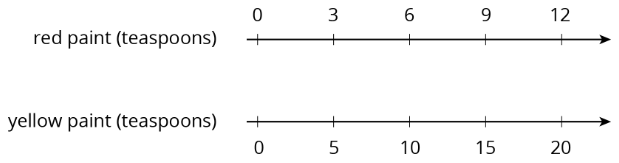
A particular shade of orange paint has 2 cups of yellow paint for every 3 cups of red paint. On the double number line, circle the numbers of cups of yellow and red paint needed for 3 batches of orange paint.
Exercise \(\PageIndex{5}\)
This double number line diagram shows the amount of flour and eggs needed for 1 batch of cookies.
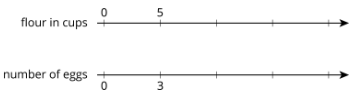
- Complete the diagram to show the amount of flour and eggs needed for 2, 3, and 4 batches of cookies.
- What is the ratio of cups of flour to eggs?
- How much flour and how many eggs are used in 4 batches of cookies?
- How much flour is used with 6 eggs?
- How many eggs are used with 15 cups of flour?
Exercise \(\PageIndex{6}\)
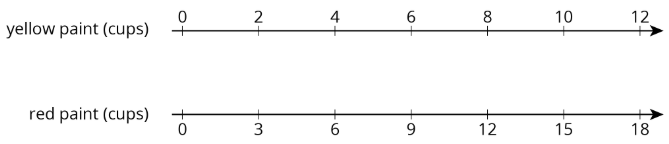
Here is a representation showing the amount of red and blue paint that make 2 batches of purple paint.
- On the double number line, label the tick marks to represent amounts of red and blue paint used to make batches of this shade of purple paint.
- How many batches are made with 12 cups of red paint?
- How many batches are made with 6 cups of blue paint?
Exercise \(\PageIndex{7}\)
Diego estimates that there will need to be 3 pizzas for every 7 kids at his party. Select all the statements that express this ratio.
- The ratio of kids to pizzas is \(7:3\).
- The ratio of pizzas to kids is 3 to 7.
- The ratio of kids to pizzas is \(3:7\).
- The ratio of pizzas to kids is 7 to 3.
- For every 7 kids there need to be 3 pizzas.
(From Unit 2.1.1)
Exercise \(\PageIndex{8}\)
- Draw a parallelogram that is not a rectangle that has an area of 24 square units. Explain or show how you know the area is 24 square units.

- Draw a triangle that has an area of 24 square units. Explain or show how you know the area is 24 square units.
(From Unit 1.2.3)