
34.2: Two Related Quantities, Part 2
- Page ID
- 40619
Lesson
Let's use equations and graphs to describe stories with constant speed.
Exercise \(\PageIndex{1}\): Walking to the Library
Lin and Jada each walk at a steady rate from school to the library. Lin can walk 13 miles in 5 hours, and Jada can walk 25 miles in 10 hours. They each leave school at 3:00 and walk \(3\frac{3}{4}\) miles to the library. What time do they each arrive?
Exercise \(\PageIndex{2}\): The Walk-a-thon
Diego, Elena, and Andre participated in a walk-a-thon to raise money for cancer research. They each walked at a constant rate, but their rates were different.
- Complete the table to show how far each participant walked during the walk-a-thon.
time in hours miles walked by Diego miles walked by Elena miles walked by Andre \(1\) \(2\) \(6\) \(12\) \(11\) \(5\) \(17.5\) Table \(\PageIndex{1}\) - How fast was each participant walking in miles per hour?
- How long did it take each participant to walk one mile?
- Graph the progress of each person in the coordinate plane. Use a different color for each participant.
- Diego says that \(d=3t\) represents his walk, where \(d\) is the distance walked in miles and \(t\) is the time in hours.
- Explain why \(d=3t\) relates the distance Diego walked to the time it took.
- Write two equations that relate distance and time: one for Elena and one for Andre.
- Use the equations you wrote to predict how far each participant would walk, at their same rate, in 8 hours.
- For Diego’s equation and the equations you wrote, which is the dependent variable and which is the independent variable?
Are you ready for more?
- Two trains are traveling toward each other, on parallel tracks. Train A is moving at a constant speed of 70 miles per hour. Train B is moving at a constant speed of 50 miles per hour. The trains are initially 320 miles apart. How long will it take them to meet? One way to start thinking about this problem is to make a table. Add as many rows as you like.
- How long will it take a train traveling at 120 miles per hour to go 320 miles?
- Explain the connection between these two problems.
| train A | train B | |
|---|---|---|
| starting position | \(0\) miles | \(320\) miles |
| after 1 hour | \(70\) miles | \(270\) miles |
| after 2 hours | ||
Summary
Equations are very useful for solving problems with constant speeds. Here is an example.
A boat is traveling at a constant speed of 25 miles per hour.
- How far can the boat travel in 3.25 hours?
- How long does it take for the boat to travel 60 miles?
We can write equations to help us answer questions like these.
Let's use \(t\) to represent the time in hours and \(d\) to represent the distance in miles that the boat travels.
When we know the time and want to find the distance, we can write: \(d=25t\) In this equation, if \(t\) changes, \(d\) is affected by the change, so we \(t\) is the independent variable and \(d\) is the dependent variable.
This equation can help us find \(d\) when we have any value of \(t\). In \(3.25\) hours, the boat can travel \(25(3.25)\) or \(81.25\) miles.
When we know the distance and want to find the time, we can write: \(t=\frac{d}{25}\) In this equation, if \(d\) changes, \(t\) is affected by the change, so we \(d\) is the independent variable and \(t\) is the dependent variable.
This equation can help us find \(t\) when for any value of \(d\). To travel 60 miles, it will take \(\frac{60}{25}\) or \(2\frac{2}{5}\) hours.
These problems can also be solved using important ratio techniques such as a table of equivalent ratios. The equations are particularly valuable in this case because the answers are not round numbers or easy to quickly evaluate.
We can also graph the two equations we wrote to get a visual picture of the relationship between the two quantities:

Glossary Entries
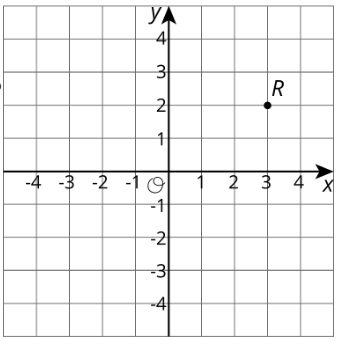
Definition: Coordinate Plane
The coordinate plane is a system for telling where points are. For example. point \(R\) is located at \((3,2)\) on the coordinate plane, because it is three units to the right and two units up.
Definition: Dependent Variable
The dependent variable is the result of a calculation.
For example, a boat travels at a constant speed of 25 miles per hour. The equation \(d=25t\) describes the relationship between the boat's distance and time. The dependent variable is the distance traveled, because \(d\) is the result of multiplying 25 by \(t\).
Definition: Independent Variable
The independent variable is used to calculate the value of another variable.
For example, a boat travels at a constant speed of 25 miles per hour. The equation \(d=25t\) describes the relationship between the boat's distance and time. The independent variable is time, because \(t\) is multiplied by 25 to get \(d\).
Practice
Exercise \(\PageIndex{3}\)
A car is traveling down a road at a constant speed of 50 miles per hour.
- Complete the table with the amounts of time it takes the car to travel certain distances, or the distances traveled for certain amounts of time.
- Write an equation that represents the distance traveled by the car, \(d\), for an amount of time, \(t\).
- In your equation, which is the dependent variable and which is the independent variable?
| time (hours) | distance (miles) |
|---|---|
| \(2\) | |
| \(1.5\) | |
| \(t\) | |
| \(50\) | |
| \(300\) | |
| \(d\) |
Exercise \(\PageIndex{4}\)
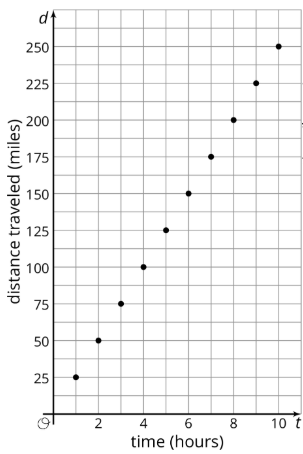
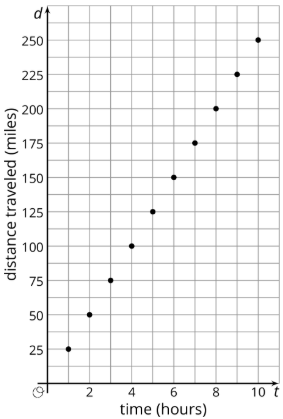
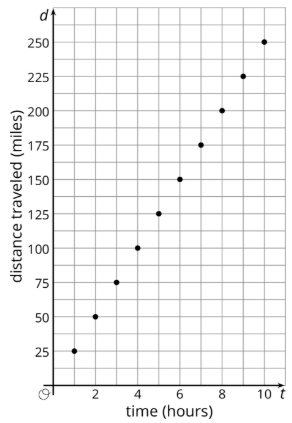
The graph represents the amount of time in hours it takes a ship to travel various distances in miles.
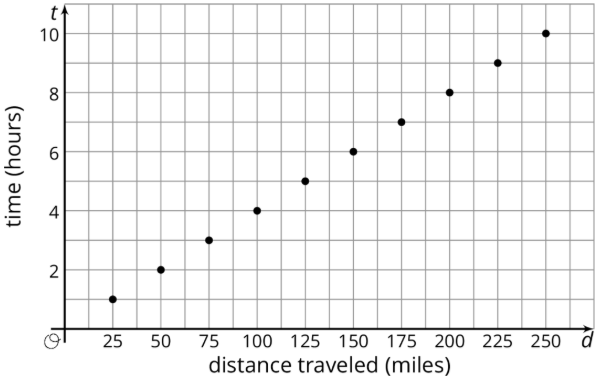
- Write the coordinates of one of point on the graph. What does the point represent?
- What is the speed of the ship in miles per hour?
- Write an equation that relates the time, \(t\), it takes to travel a given distance, \(d\).
Exercise \(\PageIndex{5}\)
Find a solution to each equation in the list that follows (not all numbers will be used):
- \(2^{x}=8\)
- \(2^{x}=2\)
- \(x^{2}=100\)
- \(x^{2}=\frac{1}{100}\)
- \(x^{1}=7\)
- \(2^{x}\cdot 2^{3}=2^{7}\)
- \(\frac{2^{x}}{2^{3}}=2^{5}\)
List:
\(\frac{1}{10}\qquad\frac{1}{3}\qquad 1\qquad 2\qquad 3\qquad 4\qquad 5\qquad 7\qquad 8\qquad 10\qquad 16\)
(From Unit 6.3.4)
Exercise \(\PageIndex{6}\)
Select all the expressions that are equivalent to \(5x+30x-15x\).
- \(5(x+6x-3x)\)
- \((5+30-15)\cdot x\)
- \(x(5+30x-15x)\)
- \(5x(1+6-3)\)
- \(5(x+30x-15x)\)
(From Unit 6.2.6)
Exercise \(\PageIndex{7}\)
Evaluate each expression if \(x\) is 1, \(y\) is 2, and \(z\) is 3.
- \(7x^{2}-z\)
- \((x+4)^{3}-y\)
- \(y(x+3^{3})\)
- \((7-y+z)^{2}\)
- \(0.241x+x^{3}\)
(From Unit 6.3.4)