
38.2: Constructing the Coordinate Plane
- Page ID
- 40828
Lesson
Let's investigate different ways of creating a coordinate plane.
Exercise \(\PageIndex{1}\): English Writer
The following data were collected over one December afternoon in England.
| time after noon (hours) | temperature (\(^{\circ}\text{C}\)) |
|---|---|
| \(0\) | \(5\) |
| \(1\) | \(3\) |
| \(2\) | \(4\) |
| \(3\) | \(2\) |
| \(4\) | \(1\) |
| \(5\) | \(-2\) |
| \(6\) | \(-3\) |
| \(7\) | \(-4\) |
| \(8\) | \(-4\) |
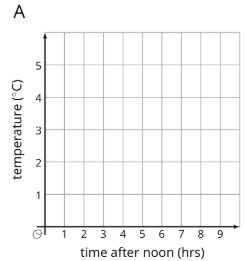
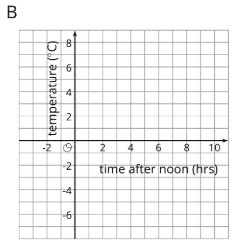
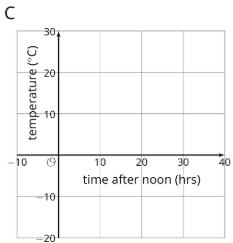
- Which set of axes would you choose to represent these data? Explain your reasoning.
- Explain why the other two sets of axes did not seem as appropriate as the one you chose.
Exercise \(\PageIndex{2}\): Axes Drawing Decisions
- Here are three sets of coordinates. For each set, draw and label an appropriate pair of axes and plot the points.
- \((1,2), (3,-4), (-5,-2), (0, 2.5)\)

- \((50,50), (0,0), (-10, -30), (-35,40)\)
- \(\left(\frac{1}{4},\frac{3}{4}\right), \left(\frac{-5}{4},\frac{1}{2}\right), \left(-1\frac{1}{4},\frac{-3}{4}\right), \left(\frac{1}{4},\frac{-1}{2}\right)\)
- Discuss with a partner:
- How are the axes and labels of your three drawings different?
- How did the coordinates affect the way you drew the axes and label the numbers?
Exercise \(\PageIndex{3}\): Positively A-maze-ing
Here is a maze on a coordinate plane. The black point in the center is (0, 0). The side of each grid square is 2 units long.
- Enter the above maze at the location marked with a green segment. Draw line segments to show your way through and out of the maze. Label each turning point with a letter. Then, list all the letters and write their coordinates.
- Choose any 2 turning points that share the same line segment. What is the same about their coordinates? Explain why they share that feature.
Are you ready for more?
To get from the point \((2,1)\) to \((-4,3)\) you can go two units up and six units to the left, for a total distance of eight units. This is called the “taxicab distance,” because a taxi driver would have to drive eight blocks to get between those two points on a map.
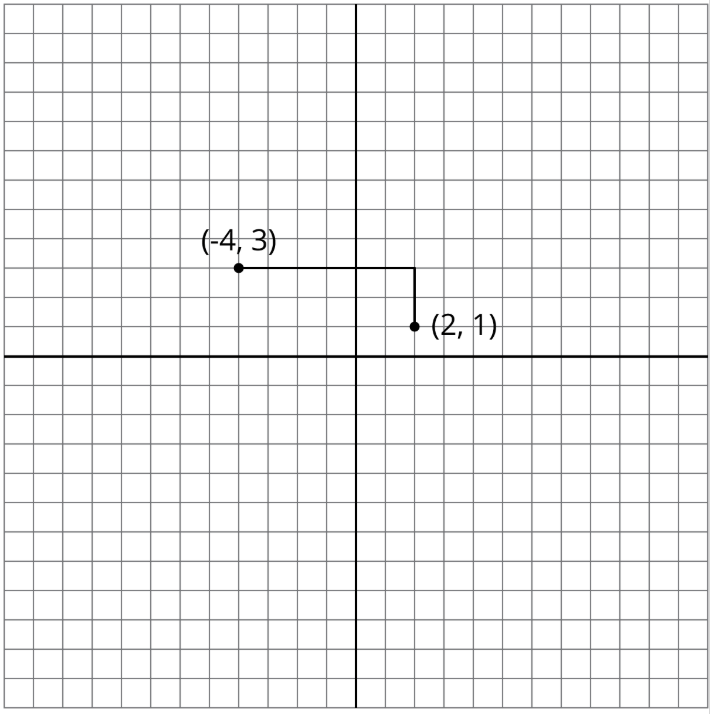
Find as many points as you can that have a taxicab distance of eight units away from \((2,1)\). What shape do these points make?
Summary
The coordinate plane can be used to show information involving pairs of numbers.
When using the coordinate plane, we should pay close attention to what each axis represents and what scale each uses.
Suppose we want to plot the following data about the temperatures in Minneapolis one evening.
| time (hours from midnight) | temperature (degrees C) |
|---|---|
| \(-4\) | \(3\) |
| \(-1\) | \(-2\) |
| \(0\) | \(-4\) |
| \(3\) | \(-8\) |
We can decide that the \(x\)-axis represents number of hours in relation to midnight and the \(y\)-axis represents temperatures in degrees Celsius.
- In this case, \(x\)-values less than 0 represent hours before midnight, and and \(x\)-values greater than 0 represent hours after midnight.
- On the \(y\)-axis, the values represents temperatures above and below the the freezing point of 0 degrees Celsius.
The data involve whole numbers, so it is appropriate that the each square on the grid represents a whole number.
- On the left of the origin, the \(x\)-axis needs to go as far as -4 or less (farther to the left). On the right, it needs to go to 3 or greater.
- Below the origin, the \(y\)-axis has to go as far as -8 or lower. Above the origin, it needs to go to 3 or higher.
Here is a graph of the data with the axes labeled appropriately.
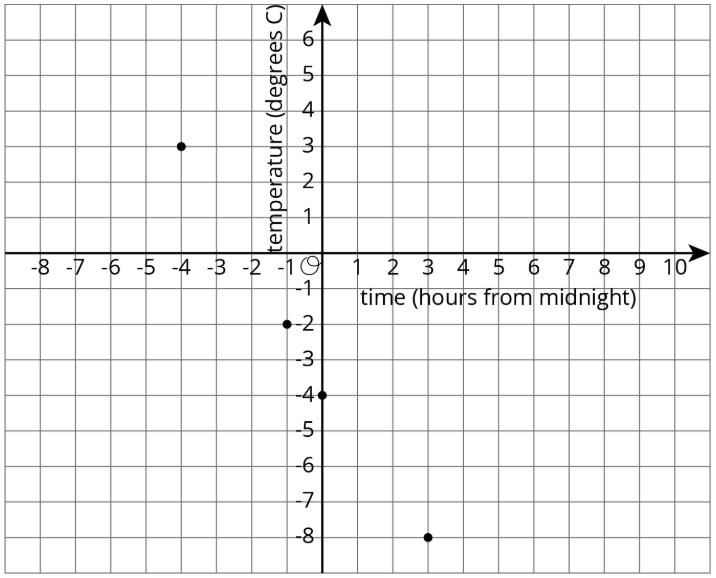
On this coordinate plane, a point at \((0,0)\) would mean a temperature of 0 degrees Celsius at midnight. The point at \((-4,3)\) means a temperature of 3 degrees Celsius at 4 hours before midnight (or 8 p.m.).
Glossary Entries
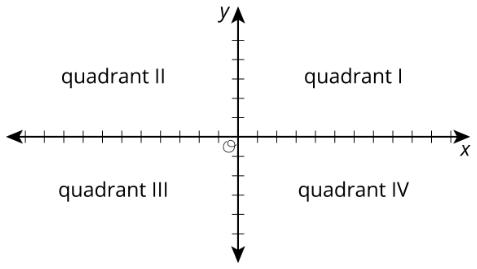
Definition: Quadrant
The coordinate plane is divided into 4 regions called quadrants. The quadrants are numbered using Roman numerals, starting in the top right corner.
Practice
Exercise \(\PageIndex{4}\)
Draw and label an appropriate pair of axes and plot the points.
\(\left(\frac{1}{5},\frac{4}{5}\right)\)
\(\left(-\frac{3}{5},\frac{2}{5}\right)\)
\(\left(-1\frac{1}{5},-\frac{4}{5}\right)\)
\(\left(\frac{1}{5},-\frac{3}{5}\right)\)
Exercise \(\PageIndex{5}\)
Diego was asked to plot these points: \((-50,0), (150,100), (200,-100), (350, 50), (-250, 0)\). What interval could he use for each axis? Explain your reasoning.
Exercise \(\PageIndex{6}\)
- Name 4 points that would form a square with the origin at its center.
- Graph these points to check if they form a square.
Exercise \(\PageIndex{7}\)
Which of the following changes would you represent using a negative number? Explain what a positive number would represent in that situation.
- A loss of 4 points
- A gain of 50 yards
- A loss of $10
- An elevation above sea level
(From Unit 7.1.5)
Exercise \(\PageIndex{8}\)
Jada is buying notebooks for school. The cost of each notebook is $1.75.
- Write an equation that shows the cost of Jada’s notebooks, \(c\), in terms of the number of notebooks, \(n\), that she buys.
- Which of the following could be points on the graph of your equation?
\((1.75, 1)\qquad (2, 3.50)\qquad (5,8.75)\qquad (17.50,10)\qquad (9, 15.35)\)
(From Unit 6.4.1)
Exercise \(\PageIndex{9}\)
A corn field has an area of 28.6 acres. It requires about 15,000,000 gallons of water. About how many gallons of water per acre is that?
- \(5,000\)
- \(50,000\)
- \(500,000\)
- \(5,000,000\)
(From Unit 5.4.5)