
44.1: Median
- Page ID
- 40885
Lesson
Let's explore the median of a data set and what it tells us.
Exercise \(\PageIndex{1}\): The Plot of the Story
- Here are two dot plots and two stories. Match each story with a dot plot that could represent it. Be prepared to explain your reasoning.
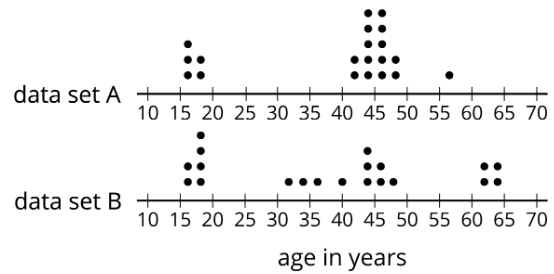
- Twenty people—high school students, teachers, and invited guests—attended a rehearsal for a high school musical. The mean age was 38.5 years and the MAD was 16.5 years.
- High school soccer team practice is usually watched by supporters of the players. One evening, twenty people watched the team practice. The mean age was 38.5 years and the MAD was 12.7 years.
- Another evening, twenty people watched the soccer team practice. The mean age was similar to that from the first evening, but the MAD was greater (about 20 years).
Make a dot plot that could illustrate the distribution of ages in this story.
Exercise \(\PageIndex{2}\): Siblings in the House
Here is data that shows the numbers of siblings of ten students in Tyler’s class.
\(1\qquad 0\qquad 2\qquad 1\qquad 7\qquad 0\qquad 2\qquad 0\qquad 1\qquad 10\)
- Represent the data shown with a dot plot.
- Without making any calculations, estimate the center of the data based on your dot plot. What is a typical number of siblings for these sixth-grade students? Mark the location of that number on your dot plot.
- Find the mean. Show your reasoning.
-
- How does the mean compare to the value that you marked on the dot plot as a typical number of siblings? (Is it a little larger, a lot larger, exactly the same, a little smaller, or a lot smaller than your estimate?)
- Do you think the mean summarizes the data set well? Explain your reasoning.
Are you ready for more?
Invent a data set with a mean that is significantly lower than what you would consider a typical value for the data set.
Exercise \(\PageIndex{3}\): Finding the Middle
- Your teacher will give you an index card. Write your first and last names on the card. Then record the total number of letters in your name. After that, pause for additional instructions from your teacher.
- Here is the data set on numbers of siblings from an earlier activity.
\(1\qquad 0\qquad 2\qquad 1\qquad 7\qquad 0\qquad 2\qquad 0\qquad 1\qquad 10\)
- Sort the data from least to greatest, and then find the median.
- In this situation, do you think the median is a good measure of a typical number of siblings for this group? Explain your reasoning.
- Here is the dot plot showing the travel time, in minutes, of Elena’s bus rides to school.
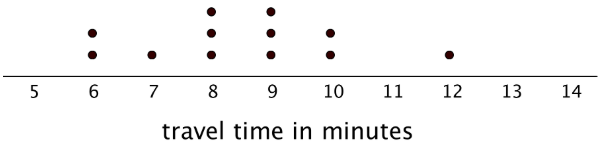
- Find the median travel time. Be prepared to explain your reasoning.
- What does the median tell us in this context?
Summary
The median is another measure of center of a distribution. It is the middle value in a data set when values are listed in order. Half of the values in a data set are less than or equal to the median,and half of the values are greater than or equal to the median.
To find the median, we order the data values from least to greatest and find the number in the middle.
Suppose we have 5 dogs whose weights, in pounds, are shown in the table. The median weight for this group of dogs is 32 pounds because three dogs weigh less than or equal to 32 pounds and three dogs weigh greater than or equal to 32 pounds.
\(20\qquad 25\qquad 32\qquad 40\qquad 55\)
Now suppose we have 6 cats whose weights, in pounds, are as shown in the table. Notice that there are two values in the middle: 7 and 8.
\(4\qquad 6\qquad 7\qquad 8\qquad 10\qquad 10\)
The median weight must be between 7 and 8 pounds, because half of the cats weigh less or equal to 7 pounds and half of the cats weigh greater than or equal to 8 pounds.
In general, when we have an even number of values, we take the number exactly in between the two middle values. In this case, the median cat weight is 7.5 pounds because \((7+8)\div 2=7.5\).
Glossary Entries
Definition: Median
The median is one way to measure the center of a data set. It is the middle number when the data set is listed in order.
For the data set 7, 9, 12, 13, 14, the median is 12.
For the data set 3, 5, 6, 8, 11, 12, there are two numbers in the middle. The median is the average of these two numbers. \(6+8=14\) and \(14\div 2=7\).
Practice
Exercise \(\PageIndex{4}\)
Here is data that shows a student's scores for 10 rounds of a video game.
\(130\qquad 150\qquad 120\qquad 170\qquad 130\qquad 120\qquad 160\qquad 160\qquad 190\qquad 140\)
What is the median score?
- \(125\)
- \(145\)
- \(147\)
- \(150\)
Exercise \(\PageIndex{5}\)
When he sorts the class’s scores on the last test, the teacher notices that exactly 12 students scored better than Clare and exactly 12 students scored worse than Clare. Does this mean that Clare’s score on the test is the median? Explain your reasoning.
Exercise \(\PageIndex{6}\)
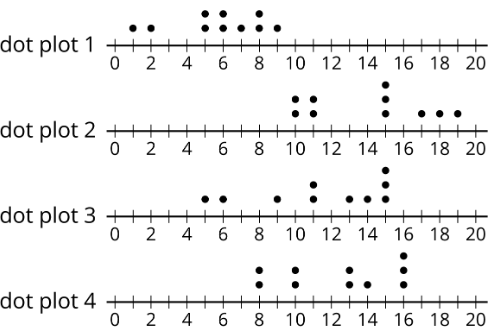
The medians of the following dot plots are 6, 12, 13, and 15, but not in that order. Match each dot plot with its median.
Exercise \(\PageIndex{7}\)
Invent a data set with five numbers that has a mean of 10 and a median of 12.
Exercise \(\PageIndex{8}\)
Ten sixth-grade students reported the hours of sleep they get on nights before a school day. Their responses are recorded in the dot plot.
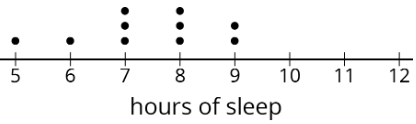
Looking at the dot plot, Lin estimated the mean number of hours of sleep to be 8.5 hours. Noah's estimate was 7.5 hours. Diego's estimate was 6.5 hours.
Which estimate do you think is best? Explain how you know.
(From Unit 8.3.2)
Exercise \(\PageIndex{9}\)
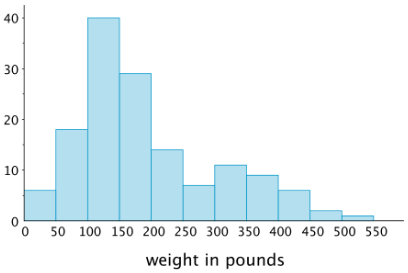
In one study of wild bears, researchers measured the weights, in pounds, of 143 wild bears that ranged in age from newborn to 15 years old. The data were used to make this histogram.
- What can you say about the heaviest bear in this group?
- What is a typical weight for the bears in this group?
- Do more than half of the bears in this group weigh less than 250 pounds?
- If weight is related to age, with older bears tending to have greater body weights, would you say that there were more old bears or more young bears in the group? Explain your reasoning.
(From Unit 8.2.6)