
3.2: Functions given by graphs
- Page ID
- 48962

In many situations, a function is represented by its graph. The graph of a function \(f\) is the set of all points (on the coordinate plane) of the form \((x,f(x))\), where \(x\) is in the domain of \(f\). We have already seen an example of graphing a function when we discussed lines and their graphs. Here is another example that shows how the formulaic definition relates to the graph of the function.
Let \(y=x^2\) with domain \(D=\mathbb{R}\) being the set of all real numbers. We can graph this after calculating a table as follows:
\[\begin{array}{|c||c|c|c|c|c|c|c|}
\hline x & -3 & -2 & -1 & 0 & 1 & 2 & 3 \\
\hline \hline y & 9 & 4 & 1 & 0 & 1 & 4 & 9 \\
\hline
\end{array} \nonumber \]
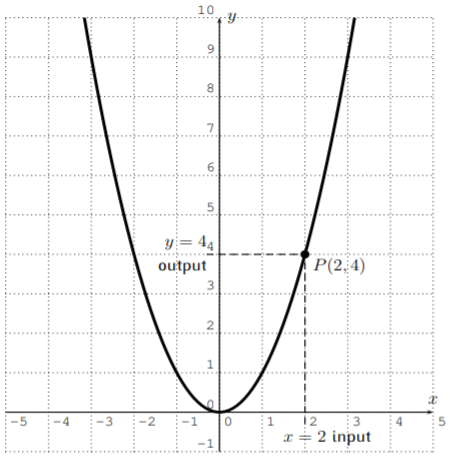
Many function values can be read from this graph. For example, for the input \(x=2\), we obtain the output \(y=4\). This corresponds to the point \(P(2,4)\) on the graph as depicted above.
In general, an input (placed on the \(x\)-axis) gets assigned to an output (placed on the \(y\)-axis) according to where the vertical line at \(x\) intersects with the given graph. This is used in the next example.
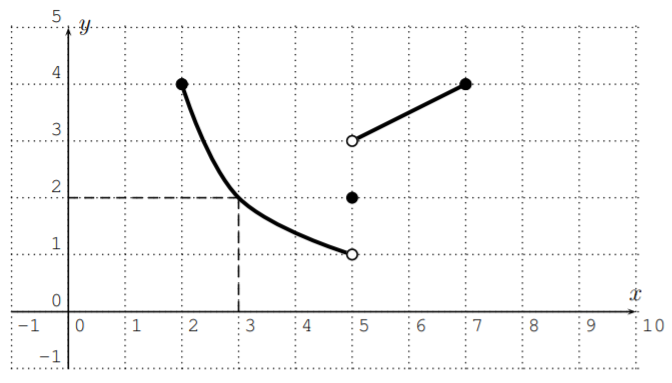
Let \(f\) be the function given by the following graph. Find the domain and range of \(f\).
Solution
Here, the dashed lines show, that the input \(x=3\) gives an output of \(y=2\). Similarly, we can obtain other output values from the graph:
\[f(2)=4, \quad f(3)=2, \quad f(5)=2, \quad f(7)=4 \nonumber \]
Note, that in the above graph, a closed point means that the point is part of the graph, whereas an open point means that it is not part of the graph.
The domain is the set of all possible input values on the \(x\)-axis. Since we can take any number \(2\leq x \leq7\) as an input, the domain is the interval \(D=[2,7]\).
The range is the set of all possible output values on the \(y\)-axis. Since any number \(1<y\leq 4\) is obtained as an output, the range is \(R=(1,4]\). Note in particular, that \(y=1\) is not an output, since \(f(5)=2\).
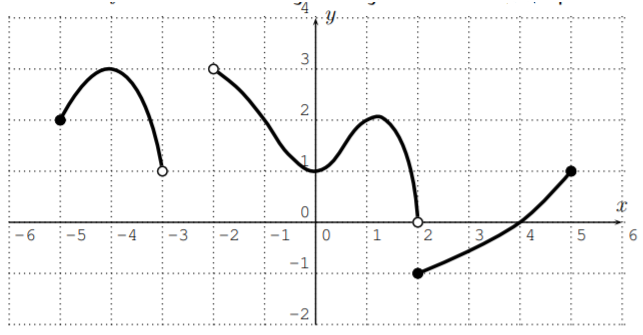
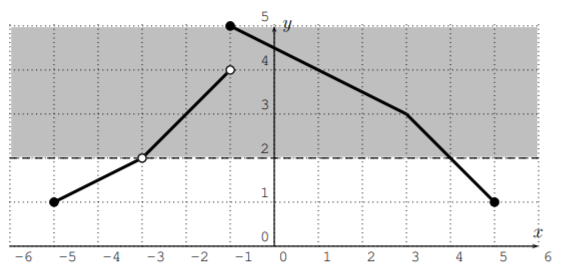
Let \(f\) be the function given by the following graph. Find the domain and range of \(f\).
Solution
Here are some function values that can be read from the graph:
\[\begin{aligned} & f(-5)=2, \quad f(-4)=3, \quad f(-3) \text{ and } f(-2) \text{ are undefined},\\ & f(-1)=2, \quad f(0)=1, \quad f(1)=2, \quad f(2)=-1, \quad f(4)=0, \quad f(5)=1\end{aligned}\]
Note, that the output value \(f(3)\) is somewhere between \(-1\) and \(0\), but we can only read off an approximation of \(f(3)\) from the graph.
To find the domain of the function, we need to determine all possible \(x\)-coordinates (or in other words, we need to project the graph onto the \(x\)-axis). The possible \(x\)-coordinates are from the interval \([-5,-3)\) together with the intervals \((-2,2)\) and \([2,5]\). The last two intervals may be combined. We get the domain:
\[D=[-5,-3)\cup (-2,5] \nonumber \]
For the range, we look at all possible \(y\)-values. These are given by the intervals \((1,3]\) and \((0,3)\) and \([-1,1]\). Combining these three intervals, we obtain the range
\[R=[-1,3] \nonumber \]
Consider the following graph.
Solution
Consider the input \(x=4\). There are several outputs that we get for \(x=4\) from this graph:
\[f(4)=1, \quad f(4)=2, \quad f(4)=3 \nonumber \]
However, in a function, it is not allowed to obtain more than one output for one input! Therefore, this graph is not the graph of a function! The reason why this example is not a function is due to some input having more than one output: \(f(4)=1, f(4)=2, f(4)=3\).
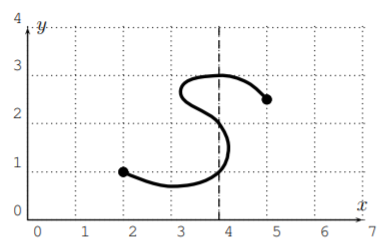
In other words, there is a vertical line (\(x=4\)) which intersects the graph in more than one point.
This observation is generalized in the following vertical line test.
A graph is the graph of a function precisely when every vertical line intersects the graph at most once.
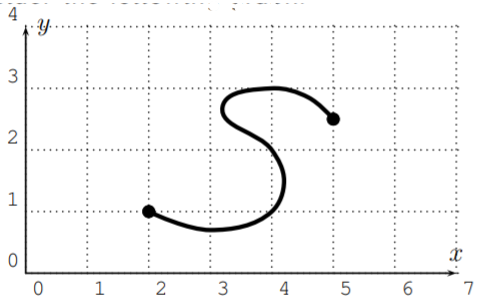
Consider the graph of the equation \(x=y^2\):
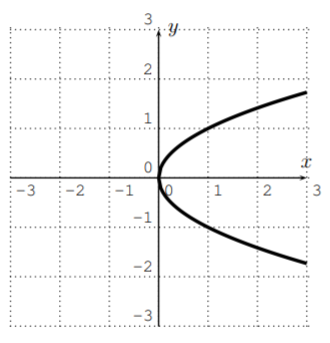
Is \(y\) is a function of \(x\)?
Solution
This does not pass the vertical line test so \(y\) is not a function of \(x\). However, \(x\) is a function of \(y\) since, if you consider \(y\) to be the input, each input has exactly one output (it passes the ‘horizontal line’ test).
Let \(f\) be the function given by the following graph.
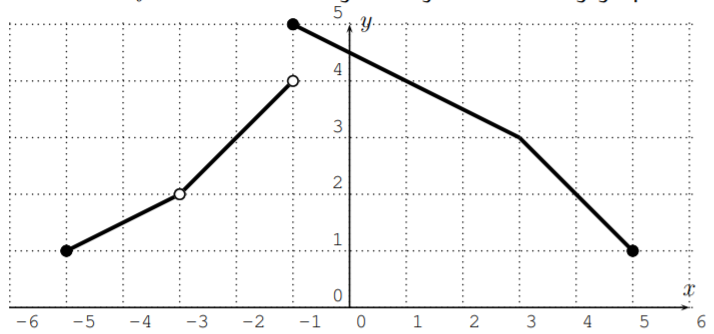
- What is the domain of \(f\)?
- What is the range of \(f\)?
- For which \(x\) is \(f(x)=3\)?
- For which \(x\) is \(f(x)=2\)?
- For which \(x\) is \(f(x)>2\)?
- For which \(x\) is \(f(x)\leq 4\)?
- Find \(f(1)\) and \(f(4)\).
- Find \(f(1)+f(4)\).
- Find \(f(1)+4\).
- Find \(f(1+4)\).
Most of the answers can be read immediately from the graph.
Solution
- For the domain, we project the graph to the \(x\)-axis. The domain consists of all numbers from \(-5\) to \(5\) without \(-3\), that is \(D=[-5,-3)\cup (-3,5]\).
- For the range, we project the graph to the \(y\)-axis. The domain consists of all numbers from \(1\) to \(5\), that is \(R=[1,5]\).
- To find \(x\) with \(f(x)=3\) we look at the horizontal line at \(y=3\):
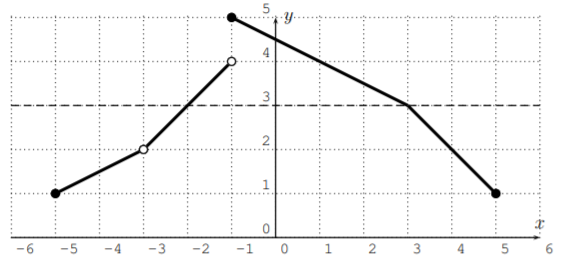
We see that there are two numbers \(x\) with \(f(x)=3\):
\[f(-2)=3, \quad\quad f(3)=3 \nonumber \]
Therefore, the answer is \(x=-2\) or \(x=3\).
- Looking at the horizontal line \(y=2\), we see that there is only one \(x\) with \(f(x)=2\); namely \(f(4)=2\). Note, that \(x=-3\) does not solve the problem, since \(f(-3)\) is undefined. The answer is \(x=4\).
- To find \(x\) with \(f(x)>2\), the graph has to lie above the line \(y=2\).
We see that the answer is those numbers \(x\) greater than \(-3\) and less than \(4\). The answer is therefore the interval \((-3,4)\).
- For \(f(x)\leq 4\), we obtain all numbers \(x\) from the domain that are less than \(-1\) or greater or equal to \(1\). The answer is therefore,
\[[-5,-3)\cup (-3,-1)\cup [1,5] \nonumber \]
Note that \(-3\) is not part of the answer, since \(f(-3)\) is undefined.
- \(f(1)=4\), and \(f(4)=2\)
- \(f(1)+f(4)=4+2=6\)
- \(f(1)+4=4+4=8\)
- \(f(1+4)=f(5)=1\)
The following graph shows the population size in a small city in the years 2001-2011 in thousands of people.
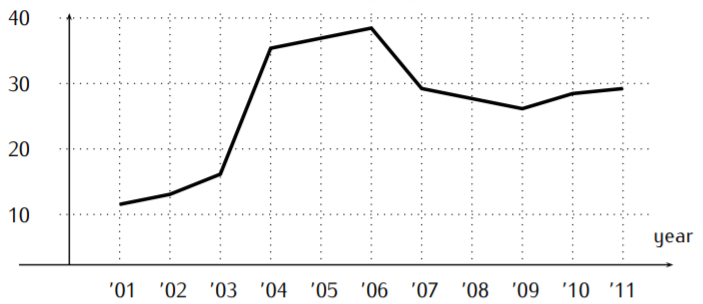
- What was the population size in the years 2004 and 2009?
- In what years did the city have the most population?
- In what year did the population grow the fastest?
- In what year did the population decline the fastest?
Solution
- The population size in the year 2004 was approximately \(36,000\). In the year 2009, it was approximately \(26,000\).
- The largest population was in the year 2006, where the graph has its maximum.
- The fastest growth in the population was between the years 2003 and 2004. That is when the graph has the largest slope.
- Finally, the fastest decline happened in the years 2006-2007.
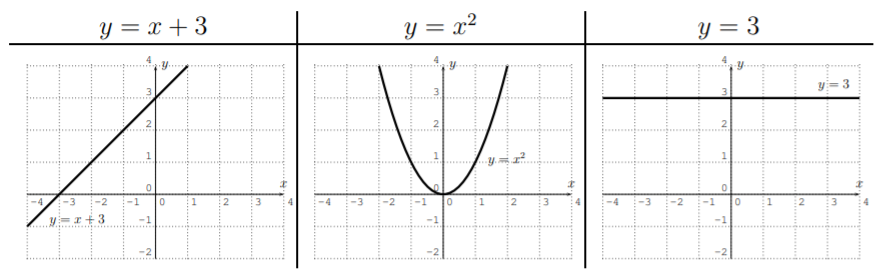
Graph the function described by the following formula:
\[f(x)=\left\{ \begin{matrix} x+3 & \text{, for}& -3\leq x< -1 \\ x^2 & \text{, for}& -1<x<1 \\ 3 & \text{, for} & 2<x\leq 3 \end{matrix} \right.\nonumber\]
Solution
We really have to graph all three functions \(y=x+3\), \(y=x^2\), and \(y=3\), and then restrict them to their respective domain. Graphing the three functions, we obtain the following tables and associated graphs, which we draw in one \(x\)-\(y\)-plane:
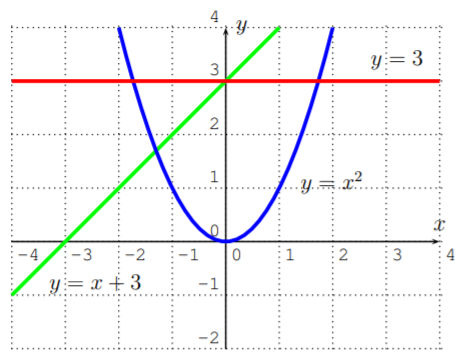
However, we need to cut off the functions according to their specific input domain that is given by the original function.
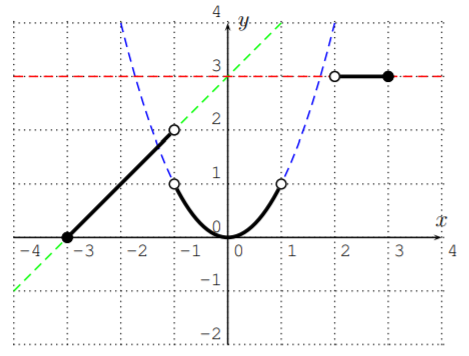
Note, how the open and closed circles at the endpoints of each branch correspond to the “\(<\)” and “\(\leq\)” rules in the original description of the function.