
11.2: Bottom-up Approaches
- Page ID
- 7715

In a sense, all networks are composed of groups (or sub-graphs). When two actors have a tie, they form a "group". One approach to thinking about the group structure of a network begins with this most basic group, and seeks to see how far this kind of close relationship can be extended. This is a useful way of thinking, because sometimes more complex social structures evolve, or emerge, from very simple ones.
A clique extends the dyad by adding to it members who are tied to all of the members of the group. This strict definition can be relaxed to include additional nodes that are not quite so tightly tied (n-cliques, n-clans, and k-plexes). The notion, however, is to build outward from single ties to "construct" the network. A map of the whole network can be built up by examining the sizes of various cliques and clique-like groupings, and noting their sizes and overlaps.
These kinds of approaches to thinking about the sub-structures of networks tend to emphasize how the macro might emerge out of the micro. They tend to focus our attention on individuals first, and try to understand how they are embedded in the web of overlapping groups in the larger structure. I make a point of these seemingly obvious ideas because it is also possible to approach the question of the sub-structure of networks from the top-down. Usually, both approaches are worthwhile and complementary. We will turn our attention first to "bottom-up" thinking.
Cliques
The idea of a clique is relatively simple. At the most general level, a clique is a sub-set of a network in which the actors are more closely and intensely tied to one another than they are to other members of the network. In terms of friendship ties, for example, it is not unusual for people in human groups to form "cliques" on the basis of age, gender, race, ethnicity, religion/ideology, and many other things. The smallest "cliques" are composed of two actors: the dyad. But dyads can be "extended" to become more and more inclusive - forming strong or closely connected regions in graphs. A number of approaches to finding groups in graphs can be developed by extending the close-coupling of dyads to larger structures.
The formal definition of a "clique" as it is used in network analysis is much more narrow and precise than the general notion of a high local density. Formally, a clique is the maximum number of actors who have all possible ties present among themselves. A "Maximal complete sub-graph" is such a grouping, expanded to include as many actors as possible. The UCINET algorithm Network>Subgroups>Cliques produces a census of all cliques, and some useful additional analysis. The result, applied to our symmetrized Knoke information matrix, is shown in Figures 11.3 through 11.5.
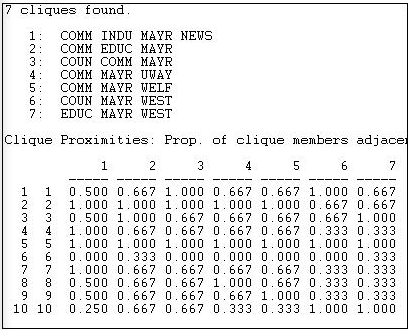
Figure 11.3: Clique and actor-by-clique analysis of reciprocity-symmetrized Knoke information network
There are seven maximal complete sub-graphs present in these data (see if you can find them in Figure 11.2). The largest one is composed of four of the ten actors, and all of the other smaller cliques share some overlap with some part of the largest clique. The second panel shows how "adjacent" each actor (row) is to each clique (column). Actor 1, for example, is adjacent to 2/3 of the members of clique 5. There is a very high degree of common membership in these data.
We might be interested in the extent to which these sub-structures overlap, and which actors are most "central" and most "isolated" from the cliques. We can examine these questions by looking at "co-membership".
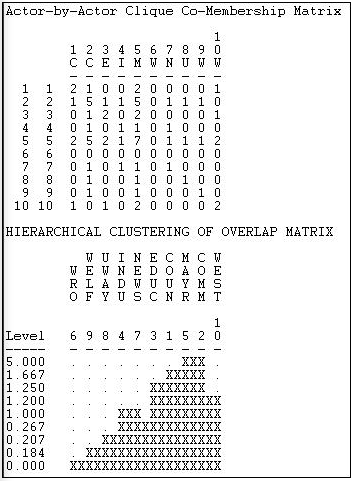
Figure 11.4: Actor-by-actor analysis of reciprocity-symmetrized Knoke information network
The first panel here shows how many cliques each pair of actors are both members of. It is immediately apparent that actor #6 is a complete isolate, and that actors #2 and #5 overlap with almost all other actors in at least one clique. We see that actors #2 and #5 are "closest" in the sense of sharing membership in five of the seven cliques. We can take this kind of analysis one step further by using single linkage agglomerative cluster analysis to create a "joining sequence" based on how many clique memberships actors have in common. This is shown in the second panel of Figure 11.4. We see that actors 2 and 5 are "joined" first as being close because they share 5 clique memberships in common.
Moving to still a higher level, we can look at the extent to which the cliques overlap with one another, as measured by the numbers of members in common, as in Figure 11.5.
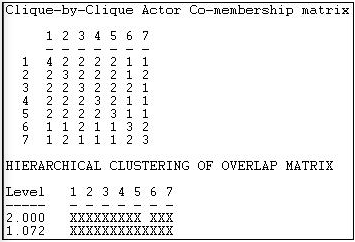
Figure 11.5: Clique-by-clique analysis of reciprocity-symmetrized Knoke information network
A cluster analysis of the closeness of the cliques shows that cliques 6 and 7 are (a little) separate from the other cliques.
You might note that the (rather lengthy) output again points to the multi-level nature of network analysis. We can see actors related to actors to define groups; we can see actors related to groups; and we can see groups related to groups in this analysis of the clique structure.
Insisting that every member of a clique be connected to every other member is a very strong definition of what we mean by a group. There are a number of ways in which this restriction could be relaxed. Two major approaches are the n-clique/n-clan approach and the k-plex approach.
N-cliques
The strict clique definition (maximal fully-connected sub-graph) may be too strong for many purposes. It insists that every member of a sub-group have a direct tie with each and every other member. You can probably think of cases of "cliques" where at least some members are not so tightly or closely connected. There are two major ways that the "clique" definition has been "relaxed" to try to make it more helpful and general.
One alternative is to define an actor as a member of a clique if they are connected to every other member of the group at a distance greater than one. Usually, the path distance two is used. This corresponds to being "a friend of a friend". This approach to defining sub-structures is called n-clique, where n stands for the length of the path allowed to make a connection to all other members. Network>Subgroups>N-Cliques finds these sub-structures and performs overlap analysis. Figure 11.6 shows the census of n-cliques for n=2.
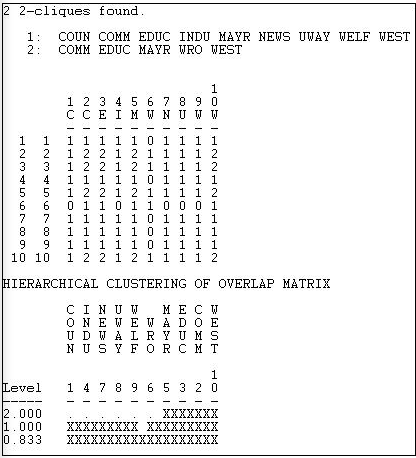
Figure 11.6: N-cliques of reciprocity-symmetrized Knoke information network (n=2)
The cliques that we saw before have been made more inclusive by the relaxed definition of group membership. The first n-clique includes everyone but actor #6. The second is more restricted, and includes #6 (WRO), along with two elements of the core. Because our definition of how closely linked actors must be to be members of a clique has been relaxed, there are fewer maximal cliques. With larger and fewer sub-groups, the mayor (#5) no longer appears to be quite so critical. With the more relaxed definition, there is now an "inner circle" of actors that are members of both larger groupings. This can be seen in the co-membership matrix, and by clustering.
N-clans
The n-clique approach tends to find long and stringy groupings rather than the tight and discrete ones of the maximal approach. In some cases, n-cliques can be found that have a property that is probably undesirable for many purposes: it is possible for members of n-cliques to be connected by actors who are not, themselves, members of the clique. For most sociological applications, this is quite troublesome.
To overcome this problem, some analysis have suggested restricting n-cliques by insisting that the total span or path distance between any two members of an n-clique also satisfy a condition. The additional restriction has the effect of forcing all ties among members of an n-clique to occur by way of other members of the n-clique. This is the n-clan approach. Network>Subgroups>N-Clan can be used to produce a clique analysis using the n-clan rule. For the Knoke information matrix, as symmetrized here, the result is identical to the n-clique approach.
The n-clique and n-clan approaches provide an alternative to the stricter "clique" definition, and this more relaxed approach often makes good sense with sociological data. In essence, the n-clique approach allows an actor to be a member of a clique even if they do not have ties to all other clique members; just so long as they do have ties to some member, and are no further away than n steps (usually 2) from all members of the clique. The n-clan approach is a relatively minor modification on the n-clique approach that requires that all the ties among actors occur through other members of the group.
If one is uncomfortable with regarding the fried of a clique member as also being a member of the clique (the n-clique approach), one might consider an alternative way of relaxing the strict assumptions of the clique definition - the k-plex approach.
K-plexes
An alternative way of relaxing the strong assumptions of the "Maximal Complete Sub-Graph" is to allow that actors may be members of a clique even if they have ties to all but k other members. For example, if A has ties with B and C, but not D; while both B and C have ties with D, all four actors could fall in clique under the k-plex approach. This approach says that a node is a member of a clique of size n if it has direct ties to n-k members of that clique.
The k-plex approach would seem to have quite a bit in common with the n-clique approach, but k-plex analysis often gives quite a different picture of the sub-structures of a graph. Rather than the large and "stringy" groupings sometimes produced by n-clique analysis, k-plex analysis tends to find relatively large numbers of smaller groupings. This tends to focus attention on overlaps and co-presence (centralization) more than solidarity and reach.
In our example, below, we have allowed k to be equal to two, but insisted that a k-plex grouping include at least four members. That is, an actor is considered to be a member of a clique if that actor has ties to all but two others (at a minimum, half) in that clique. Figure 11.7 shows the dialog of Network>Subgroups>K-Plex that specifies our definition.
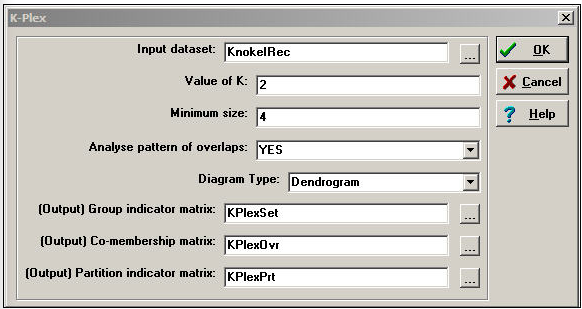
Figure 11.7: Dialog of Network>Subgroups>K-Plex for groups of at least four with k=2
The results of the k-plex analysis are shown in Figure 11.8.
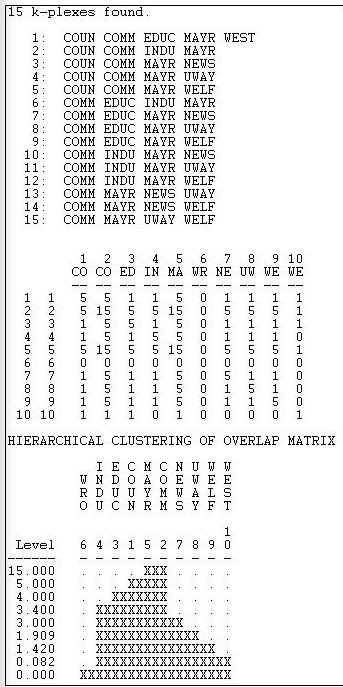
Figure 11.8: Analysis of k-plex groups in Knoke reciprocity-symmetrized information network
The COMM is present in every k-component; the MAYR is present in all but one. Clearly these two actors are "central" in the sense of playing a bridging role among multiple slightly different social circles. Again we note that organization #6 (WRO) is not a member of any k-plex clique. The k-plex method of defining cliques tends to find "overlapping social circles" when compared to the maximal or n-clique methods.
The k-plex approach to defining sub-structures makes a good deal of sense for many problems. It requires that members of a group have ties to (most) other group members - ties by way of intermediaries (like the n-clique approach) do not qualify a node for membership. The picture of group structure that emerges from k-plex approaches can be rather different from that of n-clique analysis. Again, it is not that one is "right" and the other "wrong". Depending on the goals of the analysis, both can yield valuable insights into the sub-structure of groups.
K-cores
A k-core is a maximal group of actors, all of whom are connected to some number (k) of other members of the group. To be included in a k-plex, an actor must be tied to all but k other actors in the group. The k-core approach is more relaxed, allowing actors to join the group if they are connected to k members, regardless of how many other members they may not be connected to. By varying the value of k (that is, how many members of the group you have to be connected to), different pictures can emerge. K-cores can be (and usually are) more inclusive than k-plexes. And, as k becomes smaller, group sizes will increase.
NetDraw includes a tool for identifying and coloring a graph according to its k-cores. The UCINET algorithm for identifying k-cores is located at Network>Regions>K-Core.
In our example data, if we require that each member of a group have ties to 3 other members (a 3-core), a rather large central group of actors is identified {1,2,3,4,5,7,10}. Each of the seven members of this core has ties to at least three others. If we relax the criterion to require only two ties, actors 8 and 9 are added to the group (and 6 remains an isolate). If we require only one tie (really, the same thing as a component), all actors are connected.
The k-core definition is intuitively appealing for some applications. If an actor has ties to a sufficient number of members of a group, they may feel tied to that group - even if they don't know many, or even most, members. It may be that identity depends on connection, rather than on immersion in a sub-group.
F-groups
All of the approaches we've examined so far deal with binary (and usually symmetric) relations. If we have information on the strength, cost, or probability of relations, we might also want to apply "bottom-up" thinking to find maximal groups. One approach would be to simply dichotomize the data (maybe at several different cut-points). Network>Subgroups>f-Groups is an algorithm that builds on this idea, and combines it with the notion that larger groups are composed of triadic relations.
F-groups identify maximal groups made up of "strongly transitive" and "weakly transitive" triads. A strong tie triad is formed when, if there is a tie XY and a tie YZ, there is also a tie XZ that is equal in value to the XY and YZ ties. A weakly transitive triad is formed if the ties XY and YZ are both stronger than the tie XZ, but the tie XZ is greater than some cut-off value.
Network>Subgroups>f-Groups takes the value of a strong tie to be equal to the largest valued tie in a graph. The user selects the cut-off value for what constitutes a weak tie.
Figure 11.9 shows the results of using this algorithm to identify strong and weak groups among the top 100 donors to California political campaigns. The value of the relation in these data is the number of campaigns to which donors both contributed. We have set our cut-off for a "weak tie" to be three campaigns in common.
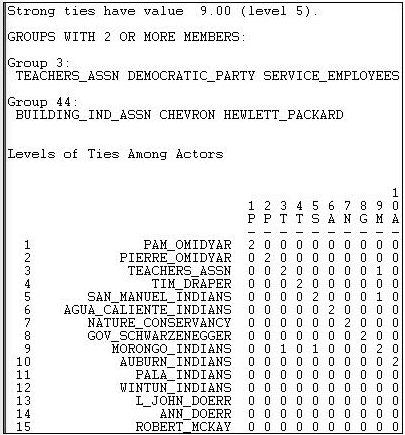
Figure 11.9: F-groups among California political donors (truncated)
There happen to be two f-groups in these data. One is composed of strongly transitive ties, and is moderately large (seven members). "Group 3" (meaning that the first member of this group is node 3, the California Teacher's Association) contains a number of actors among whom all ties have the value 9 (the highest value in the graph). The members are listed in the top part of the output; the bottom part of the output shows the same results in matrix form, with "1" indicating co-presence in a weak component, and "2" indicating co-presence in a strongly transitive component. Our second component is a weakly transitive one, composed of the Building Industry Association and two large corporations (Chevron Oil and Hewlett-Packard). This is a grouping in which all the ties satisfy the criteria of weak transitivity.