
5.5E: Exercises
- Page ID
- 49909
Practice Makes Perfect
Verify Solutions to an Inequality in Two Variables
In the following exercises, determine whether each ordered pair is a solution to the given inequality.
1. Determine whether each ordered pair is a solution to the inequality \(y>x−1\):
a. \((0,1)\)
b. \((−4,−1)\)
c. \((4,2)\)
d. \((3,0)\)
e. \((−2,−3)\)
- Answer
-
a. yes b. yes c. no d. no e. no
2. Determine whether each ordered pair is a solution to the inequality \(y>x−3\):
a. \((0,0)\)
b. \((2,1)\)
c. \((−1,−5)\)
d. \((−6,−3)\)
e. \((1,0)\)
3. Determine whether each ordered pair is a solution to the inequality \(y<3x+2\):
a. \((0,3)\)
b. \((−3,−2)\)
c. \((−2,0)\)
d. \((0,0)\)
e. \((−1,4)\)
- Answer
-
a. no b. no c. yes d. yes e. no
4. Determine whether each ordered pair is a solution to the inequality \(y<−2x+5\):
a. \((−3,0)(−3,0)
b. \((1,6)\)
c. \((−6,−2)\)
d. \((0,1)\)
e. \((5,−4)\)
5. Determine whether each ordered pair is a solution to the inequality \(3x−4y>4\):
a. \((5,1)\)
b. \((−2,6)\)
c. \((3,2)\)
d. \((10,−5)\)
e. \((0,0)\)
- Answer
-
a. yes b. no c. no d. no e. no
6. Determine whether each ordered pair is a solution to the inequality \(2x+3y>2\):
a. \((1,1)\)
b. \((4,−3)\)
c. \((0,0)\)
d. \((−8,12)\)
e. \((3,0)\)
Recognize the Relation Between the Solutions of an Inequality and its Graph
In the following exercises, write the inequality shown by the shaded region.
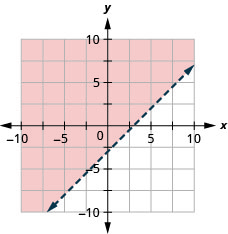
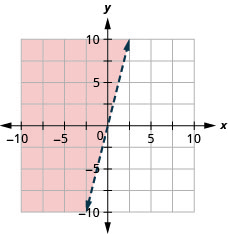
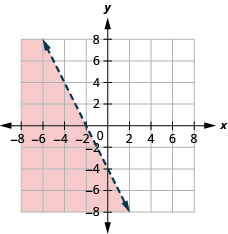
7. Write the inequality shown by the graph with the boundary line \(y=3x−4\).
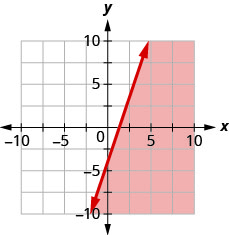
- Answer
-
\(y\leq 3x−4\)
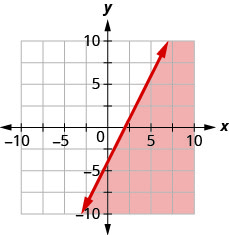
8. Write the inequality shown by the graph with the boundary line \(y=2x−4\).
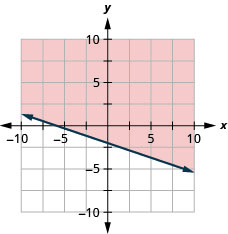
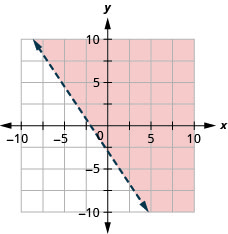
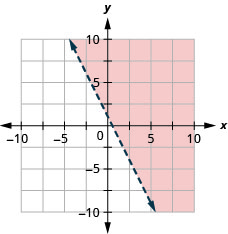
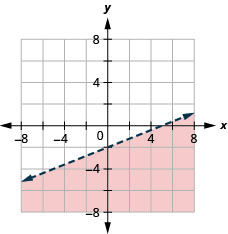
9. Write the inequality shown by the graph with the boundary line \(y=−\frac{1}{2}x+1\).
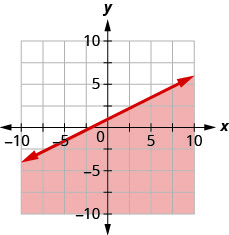
- Answer
-
\(y\leq −\frac{1}{2}x+1\)
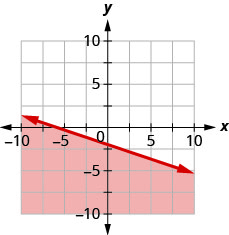
10. Write the inequality shown by the graph with the boundary line \(y=-\frac{1}{3}x−2\).
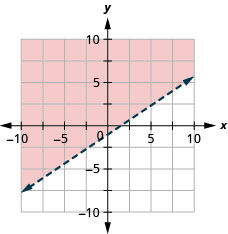
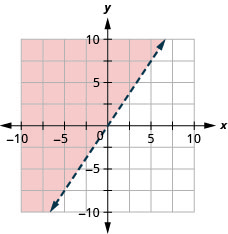
11. Write the inequality shown by the shaded region in the graph with the boundary line \(x+y=5\).
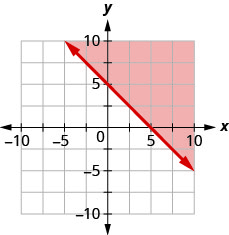
- Answer
-
\(x+y\geq 5\)
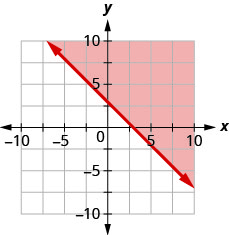
12. Write the inequality shown by the shaded region in the graph with the boundary line \(x+y=3\).
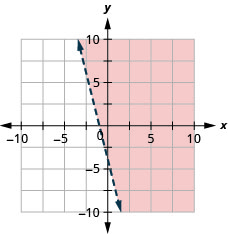
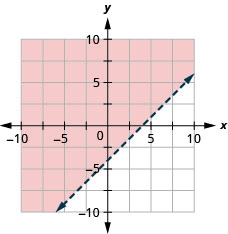
13. Write the inequality shown by the shaded region in the graph with the boundary line \(3x−y=6\).
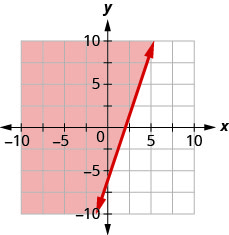
- Answer
-
\(3x−y\leq 6\)
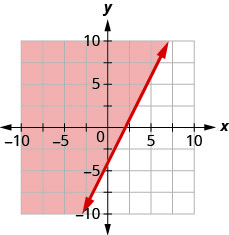
14. Write the inequality shown by the shaded region in the graph with the boundary line \(2x−y=4\).
Graph Linear Inequalities in Two Variables
In the following exercises, graph each linear inequality.
15. Graph the linear inequality: \(y>\frac{2}{3}x−1\).
- Answer
-
16. Graph the linear inequality: \(y<\frac{3}{5}x+2\).
17. Graph the linear inequality: \(y\leq −\frac{1}{2}x+4\).
- Answer
-
18. Graph the linear inequality: \(y\geq −\frac{1}{3}x−2\).
19. Graph the linear inequality: \(x−y\leq 3\).
- Answer
-
20. Graph the linear inequality: \(x−y\geq −2\).
21. Graph the linear inequality: \(4x+y>−4\).
- Answer
-
22. Graph the linear inequality: \(x+5y<−5\).
23. Graph the linear inequality: \(3x+2y\geq −6\).
- Answer
-
24. Graph the linear inequality: \(4x+2y\geq −8\).
25. Graph the linear inequality: \(y>4x\).
- Answer
-
26. Graph the linear inequality: \(y\leq −3x\).
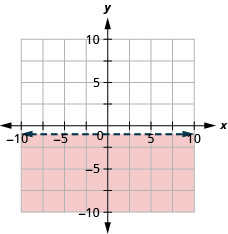
27. Graph the linear inequality: \(y<−10\).
- Answer
-
28. Graph the linear inequality: \(y\geq 2\).
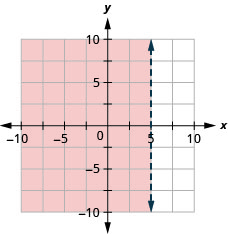
29. Graph the linear inequality: \(x\leq 5\).
- Answer
-
30. Graph the linear inequality: \(x\geq 0\).
31. Graph the linear inequality: \(x−y<4\).
- Answer
-
32. Graph the linear inequality: \(x−y<−3\).
33. Graph the linear inequality: \(y\geq \frac{3}{2}x\).
- Answer
-
34. Graph the linear inequality: \(y\leq \frac{5}{4}x\).
35. Graph the linear inequality: \(y>−2x+1\).
- Answer
-
36. Graph the linear inequality: \(y<−3x−4\).
37. Graph the linear inequality: \(2x+y\geq −4\).
- Answer
-
38. Graph the linear inequality: \(x+2y\leq −2\).
39. Graph the linear inequality: \(2x−5y>10\).
- Answer
-
40. Graph the linear inequality: \(4x−3y>12\).
Solve Applications using Linear Inequalities in Two Variables
41. Harrison works two part time jobs. One at a gas station that pays $11 an hour and the other is IT troubleshooting for $16.50$16.50an hour. Between the two jobs, Harrison wants to earn at least $330 a week. How many hours does Harrison need to work at each job to earn at least $330?
a. Let x be the number of hours he works at the gas station and let y be the number of (hours he works troubleshooting. Write an inequality that would model this situation.
b. Graph the inequality.
c. Find three ordered pairs \((x,y)\) that would be solutions to the inequality. Then, explain what that means for Harrison.
- Answer
-
a. \(11x+16.5y\geq 330\)
b.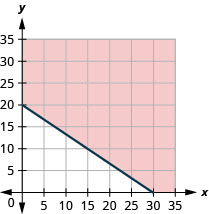
c. Answers will vary.
42. Elena needs to earn at least $450 a week during her summer break to pay for college. She works two jobs. One as a swimming instructor that pays $9 an hour and the other as an intern in a genetics lab for $22.50 per hour. How many hours does Elena need to work at each job to earn at least $450 per week?
a. Let x be the number of hours she works teaching swimming and let y be the number of hours she works as an intern. Write an inequality that would model this situation.
b. Graph the inequality.
c. Find three ordered pairs (x,y)(x,y) that would be solutions to the inequality. Then, explain what that means for Elena.
43. The doctor tells Laura she needs to exercise enough to burn 500 calories each day. She prefers to either run or bike and burns 15 calories per minute while running and 10 calories a minute while biking.
a. If x is the number of minutes that Laura runs and y is the number minutes she bikes, find the inequality that models the situation.
b. Graph the inequality.
c. List three solutions to the inequality. What options do the solutions provide Laura?
- Answer
-
a. \(15x+10y\geq 500\)
b.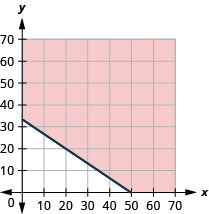
c. Answers will vary.
44. Armando’s workouts consist of kickboxing and swimming. While kickboxing, he burns 10 calories per minute and he burns 7 calories a minute while swimming. He wants to burn 600 calories each day.
a. If x is the number of minutes that Armando will kickbox and y is the number minutes he will swim, find the inequality that will help Armando create a workout for today.
b. Graph the inequality.
c. List three solutions to the inequality. What options do the solutions provide Armando?
Writing Exercises
45. Lester thinks that the solution of any inequality with a >> sign is the region above the line and the solution of any inequality with a << sign is the region below the line. Is Lester correct? Explain why or why not.
- Answer
-
Answers will vary.
46. Explain why, in some graphs of linear inequalities, the boundary line is solid but in other graphs it is dashed.
Self Check
a. After completing the exercises, use this checklist to evaluate your mastery of the objectives of this section.
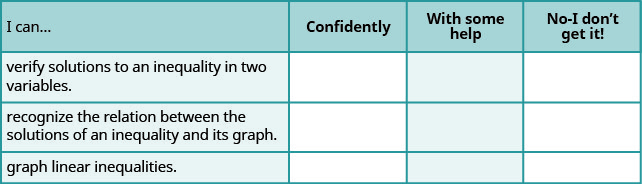
b. On a scale of 1–10, how would you rate your mastery of this section in light of your responses on the checklist? How can you improve this?