

1.2.3: Additional Exercises
- Page ID
- 192219
\( \newcommand{\vecs}[1]{\overset { \scriptstyle \rightharpoonup} {\mathbf{#1}} } \)
\( \newcommand{\vecd}[1]{\overset{-\!-\!\rightharpoonup}{\vphantom{a}\smash {#1}}} \)
\( \newcommand{\dsum}{\displaystyle\sum\limits} \)
\( \newcommand{\dint}{\displaystyle\int\limits} \)
\( \newcommand{\dlim}{\displaystyle\lim\limits} \)
\( \newcommand{\id}{\mathrm{id}}\) \( \newcommand{\Span}{\mathrm{span}}\)
( \newcommand{\kernel}{\mathrm{null}\,}\) \( \newcommand{\range}{\mathrm{range}\,}\)
\( \newcommand{\RealPart}{\mathrm{Re}}\) \( \newcommand{\ImaginaryPart}{\mathrm{Im}}\)
\( \newcommand{\Argument}{\mathrm{Arg}}\) \( \newcommand{\norm}[1]{\| #1 \|}\)
\( \newcommand{\inner}[2]{\langle #1, #2 \rangle}\)
\( \newcommand{\Span}{\mathrm{span}}\)
\( \newcommand{\id}{\mathrm{id}}\)
\( \newcommand{\Span}{\mathrm{span}}\)
\( \newcommand{\kernel}{\mathrm{null}\,}\)
\( \newcommand{\range}{\mathrm{range}\,}\)
\( \newcommand{\RealPart}{\mathrm{Re}}\)
\( \newcommand{\ImaginaryPart}{\mathrm{Im}}\)
\( \newcommand{\Argument}{\mathrm{Arg}}\)
\( \newcommand{\norm}[1]{\| #1 \|}\)
\( \newcommand{\inner}[2]{\langle #1, #2 \rangle}\)
\( \newcommand{\Span}{\mathrm{span}}\) \( \newcommand{\AA}{\unicode[.8,0]{x212B}}\)
\( \newcommand{\vectorA}[1]{\vec{#1}} % arrow\)
\( \newcommand{\vectorAt}[1]{\vec{\text{#1}}} % arrow\)
\( \newcommand{\vectorB}[1]{\overset { \scriptstyle \rightharpoonup} {\mathbf{#1}} } \)
\( \newcommand{\vectorC}[1]{\textbf{#1}} \)
\( \newcommand{\vectorD}[1]{\overrightarrow{#1}} \)
\( \newcommand{\vectorDt}[1]{\overrightarrow{\text{#1}}} \)
\( \newcommand{\vectE}[1]{\overset{-\!-\!\rightharpoonup}{\vphantom{a}\smash{\mathbf {#1}}}} \)
\( \newcommand{\vecs}[1]{\overset { \scriptstyle \rightharpoonup} {\mathbf{#1}} } \)
\(\newcommand{\longvect}{\overrightarrow}\)
\( \newcommand{\vecd}[1]{\overset{-\!-\!\rightharpoonup}{\vphantom{a}\smash {#1}}} \)
\(\newcommand{\ket}[1]{\left| #1 \right>}\)
\(\newcommand{\bra}[1]{\left< #1 \right|}\)
\(\newcommand{\braket}[2]{\left< #1 \vphantom{#2} \right| \left. #2 \vphantom{#1} \right>}\)
\(\newcommand{\braopket}[3]{\left< #1 \vphantom{#2}\vphantom{#3} \right| #2 \vphantom{#1}\vphantom{#3} \left| #3 \vphantom{#1}\vphantom{#2} \right>}\)
\(\newcommand{\qmvec}[1]{\mathbf{\vec{#1}}}\)
\(\newcommand{\op}[1]{\hat{\mathbf{#1}}}\)
\(\newcommand{\expect}[1]{\langle #1 \rangle}\)
\(\newcommand{\dfn}[1]{\emph{\textbf{#1}}}\)
Reading Questions
- How does using a graph help in estimating \( \displaystyle \lim_{x \to a} f(x)\)?
- What are two potential pitfalls when trying to determine a limit solely from a graph?
- If a graph of \(f(x)\) has an open circle at the point \((a, L)\) but the curve smoothly approaches this point from both the left and the right, what is \( \displaystyle \lim_{x \to a} f(x)\)? What can be said about \(f(a)\)?
- Explain how to find \( \displaystyle \lim_{x \to a^-} f(x)\) and \( \displaystyle \lim_{x \to a^+} f(x)\) by looking at a graph.
- If \( \displaystyle \lim_{x \to a^-} f(x) = L_1\) and \( \displaystyle \lim_{x \to a^+} f(x) = L_2\), where \(L_1 \neq L_2\), what can you conclude about \( \displaystyle \lim_{x \to a} f(x)\) based on its graph?
- What does the graph of a function typically show near a value \(x=a\) if \( \displaystyle \lim_{x \to a} f(x) = \infty\)?
- According to the definition provided in this section, what conditions involving limits must be met for a function \(f(x)\) to have a vertical asymptote at \(x=a\)?
- When evaluating a limit like \( \displaystyle \lim_{x \to a} \frac{N(x)}{D(x)}\) where \(N(x) \to k \neq 0\) and \(D(x) \to 0\), what information about \(N(x)\) and \(D(x)\) as \(x \to a\) is needed to determine if the limit is \(\infty\) or \(-\infty\)?
- Why is it incorrect to write \( \displaystyle \lim_{x \to c} f(x) = \frac{k}{0}\)? What notation should be used to show the conceptual steps?
- In Example 7, part d, \( \displaystyle \lim_{x \to (\pi/2)^-} \ln(\cot x)\), describe the step-by-step thought process for evaluating this limit conceptually by considering the behavior of the inner function \(\cot x\) and then the outer function \(\ln(u)\).
- How does Figure 6 (the graph of \(f(x) = \sin(1/x)\)) visually demonstrate that \( \displaystyle \lim_{x \to 0} \sin(1/x)\) does not exist?
- What does the graph in Figure 10 illustrate about the relationship between \(f(c)\) and \( \displaystyle \lim_{x \to c} f(x)\) at various points \(c\)?
Homework
In exercises 1 - 2, set up a table of values and round to eight significant digits. Based on the table of values, make a guess about what the limit is. Then, use a calculator to graph the function and determine the limit. Was the conjecture correct? If not, why does the method of tables fail?
1) \(\displaystyle \lim_{ \theta \to 0}\sin\left(\frac{ \pi }{ \theta }\right)\)
| \( \theta \) | \(\sin\left(\frac{ \pi }{ \theta }\right)\) | \( \theta \) | \(\sin\left(\frac{ \pi }{ \theta }\right)\) |
|---|---|---|---|
| -0.1 | a. | 0.1 | e. |
| -0.01 | b. | 0.01 | f. |
| -0.001 | c. | 0.001 | g. |
| -0.0001 | d. | 0.0001 | h. |
2) \(\displaystyle \lim_{ \alpha \to 0^+} \frac{1}{ \alpha }\cos\left(\frac{ \pi }{ \alpha }\right)\)
| \(\alpha\) | \(\frac{1}{ \alpha }\cos\left(\frac{ \pi }{ \alpha }\right)\) |
|---|---|
| 0.1 | a. |
| 0.01 | b. |
| 0.001 | c. |
| 0.0001 | d. |
In exercises 3 - 6, consider the graph of the function\(y=f(x)\) shown here. Which of the statements about \(y=f(x)\) are true and which are false? Explain why a statement is false.

3) \(\displaystyle \lim_{x \to 10}f(x)=0\)
4) \(\displaystyle \lim_{x \to −2^+}f(x)=3\)
5) \(\displaystyle \lim_{x \to −8}f(x)=f(−8)\)
6) \(\displaystyle \lim_{x \to 6}f(x)=5\)
In exercises 7 - 11, use the following graph of the function \(y=f(x)\) to find the values, if possible. Estimate when necessary.

7) \(\displaystyle \lim_{x \to 1^−}f(x)\)
8) \(\displaystyle \lim_{x \to 1^+}f(x)\)
9) \(\displaystyle \lim_{x \to 1}f(x)\)
10) \(\displaystyle \lim_{x \to 2}f(x)\)
11) \(f(1)\)
In exercises 12 - 15, use the graph of the function \(y=f(x)\) shown here to find the values, if possible. Estimate when necessary.

12) \(\displaystyle \lim_{x \to 0^−}f(x)\)
13) \(\displaystyle \lim_{x \to 0^+}f(x)\)
14) \(\displaystyle \lim_{x \to 0}f(x)\)
15) \(\displaystyle \lim_{x \to 2}f(x)\)
In exercises 16 - 21, use the graph of the function \(y=f(x)\) shown here to find the values, if possible. Estimate when necessary.

16) \(\displaystyle \lim_{x \to −2^−}f(x)\)
17) \(\displaystyle \lim_{x \to −2^+}f(x)\)
18) \(\displaystyle \lim_{x \to −2}f(x)\)
19) \(\displaystyle \lim_{x \to 2^−}f(x)\)
20) \(\displaystyle \lim_{x \to 2^+}f(x)\)
21) \(\displaystyle \lim_{x \to 2}f(x)\)
In exercises 22 - 24, use the graph of the function \(y=g(x)\) shown here to find the values, if possible. Estimate when necessary.

22) \(\displaystyle \lim_{x \to 0^−}g(x)\)
23) \(\displaystyle \lim_{x \to 0^+}g(x)\)
24) \(\displaystyle \lim_{x \to 0}g(x)\)
In exercises 25 - 27, use the graph of the function \(y=h(x)\) shown here to find the values, if possible. Estimate when necessary.

25) \(\displaystyle \lim_{x \to 0^−}h(x)\)
26) \(\displaystyle \lim_{x \to 0^+}h(x)\)
27) \(\displaystyle \lim_{x \to 0}h(x)\)
In exercises 28 - 32, use the graph of the function \(y=f(x)\) shown here to find the values, if possible. Estimate when necessary.

28) \(\displaystyle \lim_{x \to 0^−}f(x)\)
29) \(\displaystyle \lim_{x \to 0^+}f(x)\)
30) \(\displaystyle \lim_{x \to 0}f(x)\)
31) \(\displaystyle \lim_{x \to 1}f(x)\)
32) \(\displaystyle \lim_{x \to 2}f(x)\)
In exercises 33 - 37, sketch the graph of a function with the given properties.
33) \[ \lim_{x \to 2}f(x)=1, \nonumber \]\[ \lim_{x \to 4^−}f(x)=3, \nonumber \]\[\lim_{x \to 4^+}f(x)=6, \nonumber \]\[ \text{ and } x=4 \text{ is not defined.}\nonumber \]
34) \[ \lim_{x \to − \infty }f(x)=0, \nonumber \]\[ \lim_{x \to −1^−}f(x)=− \infty , \nonumber \]\[ \lim_{x \to −1^+}f(x)= \infty , \nonumber \]\[ \lim_{x \to 0}f(x)=f(0), \nonumber \]\[ f(0)=1, \nonumber \]\[ \text{ and } \lim_{x \to \infty }f(x)=− \infty. \nonumber \]
35) \[ \lim_{x \to − \infty }f(x)=2, \nonumber \]\[ \lim_{x \to 3^−}f(x)=− \infty , \nonumber \]\[ \lim_{x \to 3^+}f(x)= \infty , \nonumber \]\[ \lim_{x \to \infty }f(x)=2,\nonumber \]\[\text{ and } f(0)=-\dfrac{1}{3}. \nonumber \]
36) \[ \lim_{x \to − \infty }f(x)=2, \nonumber \]\[ \lim_{x \to −2}f(x)=− \infty , \nonumber \]\[ \lim_{x \to \infty }f(x)=2, \nonumber \]\[ \text{ and } f(0)=0. \nonumber \]
37) \[ \lim_{x \to − \infty }f(x)=0, \nonumber \]\[\lim_{x \to −1^−}f(x)= \infty , \nonumber \]\[ \lim_{x \to −1^+}f(x)=− \infty , \nonumber \]\[ f(0)=−1, \nonumber \]\[ \lim_{x \to 1^−}f(x)=− \infty , \nonumber \]\[ \lim_{x \to 1^+}f(x)= \infty , \nonumber \]\[ \text{ and } \lim_{x \to \infty }f(x)=0. \nonumber \]
38) Shock waves arise in many physical applications, ranging from supernovas to detonation waves. A graph of the density of a shock wave with respect to distance, \(x\), is shown here. We are mainly interested in the location of the front of the shock, labeled \(X_{SF}\) in the diagram.
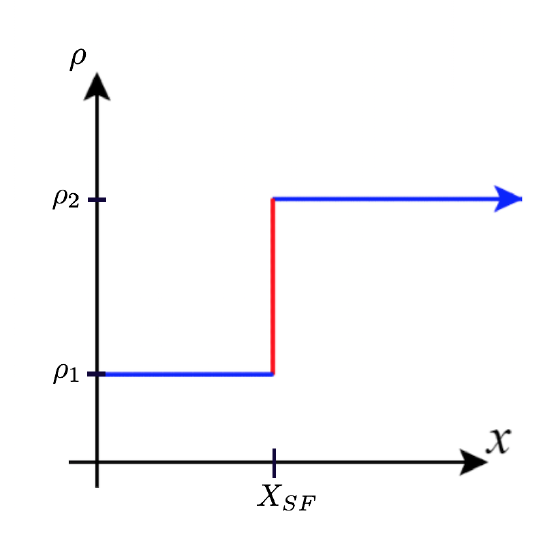
a. Evaluate \(\displaystyle \lim_{x \to X_{SF}^+} \rho (x)\).
b. Evaluate \(\displaystyle \lim_{x \to X_{SF}^−} \rho (x)\).
c. Evaluate \(\displaystyle \lim_{x \to X_{SF}} \rho (x)\). Explain the physical meanings behind your answers.