
2.7E: Exercises
- Page ID
- 56718
Practice Makes Perfect
Use Geoboards to Model Slope
In the following exercises, find the slope modeled on each geoboard.

- Answer
-
\(\frac{1}{4}\)


- Answer
-
\(\frac{2}{3}\)


- Answer
-
\(\frac{-3}{2}=-\frac{3}{2}\)


- Answer
-
\(-\frac{2}{3}\)

In the following exercises, model each slope. Draw a picture to show your results.
\(\frac{2}{3}\)
- Answer
-

\(\frac{3}{4}\)
\(\frac{1}{4}\)
- Answer
-

\(\frac{4}{3}\)
\(-\frac{1}{2}\)
- Answer
-

\(-\frac{3}{4}\)
\(-\frac{2}{3}\)
- Answer
-

\(-\frac{3}{2}\)
Use \(m=\frac{rise}{run}\) to find the Slope of a Line from its Graph
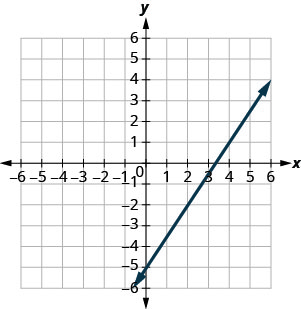
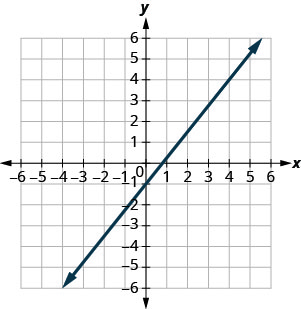
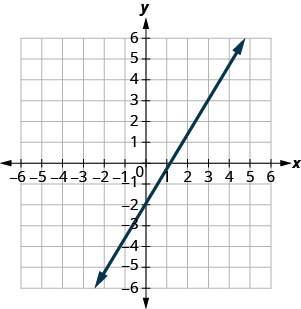
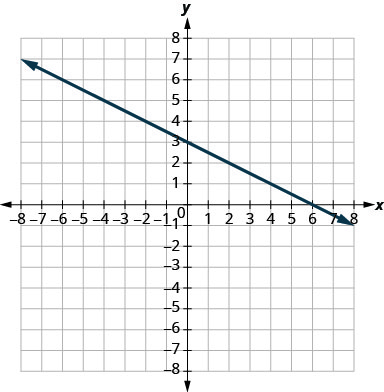
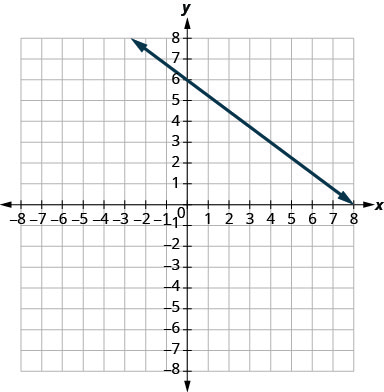
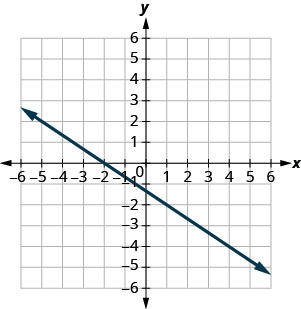
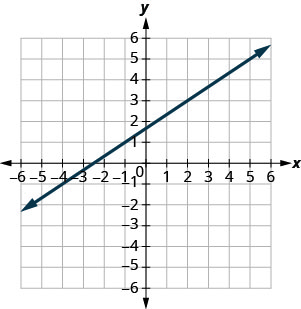
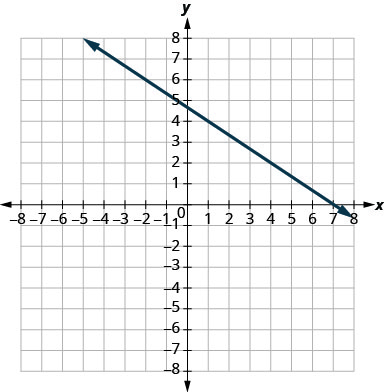
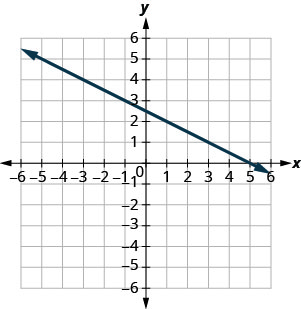
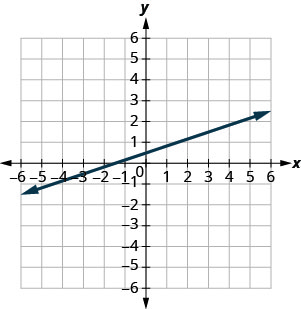
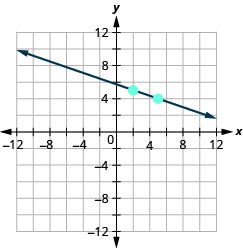
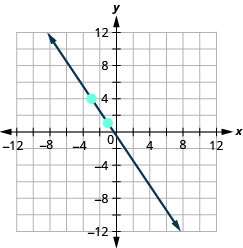
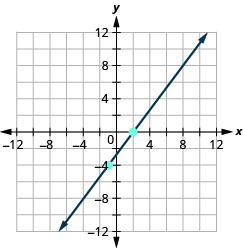
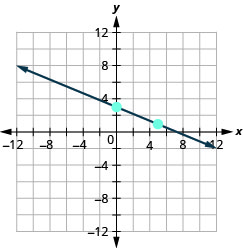
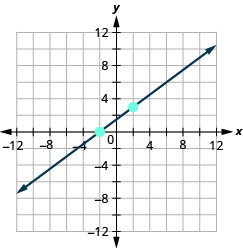
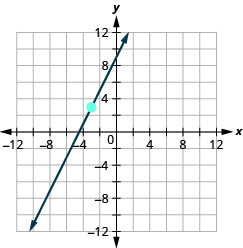
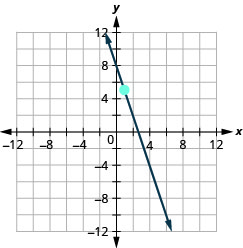
In the following exercises, find the slope of each line shown.

- Answer
-
\(\frac{2}{5}\)
- Answer
-
\(\frac{5}{4}\)
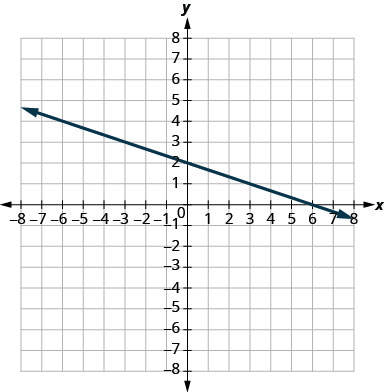
- Answer
-
\(-\frac{1}{3}\)
- Answer
-
\(-\frac{3}{4}\)
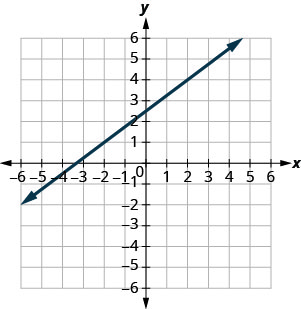
- Answer
-
\(\frac{3}{4}\)
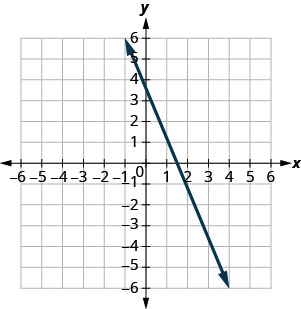
- Answer
-
\(-\frac{5}{2}\)
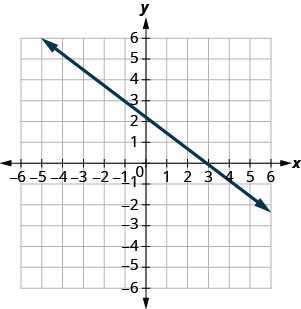
- Answer
-
\(-\frac{2}{3}\)
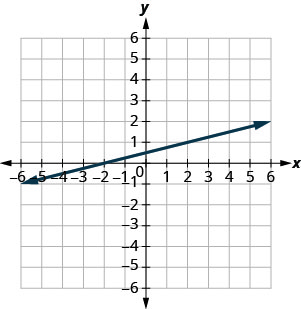
- Answer
-
\(\frac{1}{4}\)
Find the Slope of Horizontal and Vertical Lines
In the following exercises, find the slope of each line.
y=3
- Answer
-
0
y=1
x=4
- Answer
-
undefined
x=2
y=−2
- Answer
-
0
y=−3
x=−5
- Answer
-
undefined
x=−4
Use the Slope Formula to find the Slope of a Line between Two Points
In the following exercises, use the slope formula to find the slope of the line between each pair of points.
(1,4),(3,9)
- Answer
-
\(\frac{5}{2}\)
(2,3),(5,7)
(0,3),(4,6)
- Answer
-
\(\frac{3}{4}\)
(0,1),(5,4)
(2,5),(4,0)
- Answer
-
\(-\frac{5}{2}\)
(3,6),(8,0)
(−3,3),(4,−5)
- Answer
-
\(-\frac{8}{7}\)
(−2,4),(3,−1)
(−1,−2),(2,5)
- Answer
-
\(\frac{7}{3}\)
(−2,−1),(6,5)
(4,−5),(1,−2)
- Answer
-
−1
(3,−6),(2,−2)
Graph a Line Given a Point and the Slope
In the following exercises, graph each line with the given point and slope.
\((1,-2) ; m=\frac{3}{4}\)
- Answer
-

\((1,-1) ; m=\frac{2}{3}\)
\((2,5) ; m=-\frac{1}{3}\)
- Answer
-
\((1,4) ; m=-\frac{1}{2}\)
\((-3,4) ; m=-\frac{3}{2}\)
- Answer
-
\((-2,5) ; m=-\frac{5}{4}\)
\((-1,-4) ; m=\frac{4}{3}\)
- Answer
-
\((-3,-5) ; m=\frac{3}{2}\)
\(y\) -intercept \(3 ; m=-\frac{2}{5}\)
- Answer
-
\(y\) -intercept \(5 ; m=-\frac{4}{3}\)
\(x\) -intercept \(-2 ; m=\frac{3}{4}\)
- Answer
-
\(x\) -intercept \(-1 ; m=\frac{1}{5}\)
\((-3,3) ; m=2\)
- Answer
-
\((-4,2) ; m=4\)
\((1,5) ; m=-3\)
- Answer
-
\((2,3) ; m=-1\)
Everyday Math
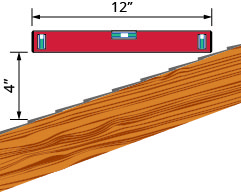
Slope of a roof. An easy way to determine the slope of a roof is to set one end of a 12 inch level on the roof surface and hold it level. Then take a tape measure or ruler and measure from the other end of the level down to the roof surface. This will give you the slope of the roof. Builders, sometimes, refer to this as pitch and state it as an “x 12 pitch” meaning \(\frac{x}{12}\), where x is the measurement from the roof to the level—the rise. It is also sometimes stated as an “x-in-12 pitch”.
- What is the slope of the roof in this picture?
- What is the pitch in construction terms?
- Answer
-
- \(\frac{1}{3}\)
- 4 12 pitch or 4-in-12 pitch
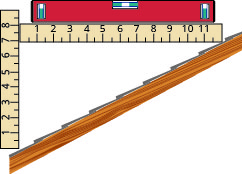
The slope of the roof shown here is measured with a 12” level and a ruler. What is the slope of this roof?
Road grade. A local road has a grade of 6%. The grade of a road is its slope expressed as a percent. Find the slope of the road as a fraction and then simplify. What rise and run would reflect this slope or grade?
- Answer
-
\(\frac{3}{50} ;\) rise \(=3,\) run \(=50\)
Highway grade. A local road rises 2 feet for every 50 feet of highway.
- What is the slope of the highway?
- The grade of a highway is its slope expressed as a percent. What is the grade of this highway?
Wheelchair ramp. The rules for wheelchair ramps require a maximum 1-inch rise for a 12-inch run.
- How long must the ramp be to accommodate a 24-inch rise to the door?
- Create a model of this ramp.
- Answer
-
- 288 inches (24 feet)
- Models will vary.
Wheelchair ramp. A 1-inch rise for a 16-inch run makes it easier for the wheelchair rider to ascend a ramp.
- How long must a ramp be to easily accommodate a 24-inch rise to the door?
- Create a model of this ramp.
Writing Exercises
What does the sign of the slope tell you about a line?
- Answer
-
When the slope is a positive number the line goes up from left to right. When the slope is a negative number the line goes down from left to right.
How does the graph of a line with slope \(m=\frac{1}{2}\) differ from the graph of a line with slope \(m=2 ?\)
Why is the slope of a vertical line “undefined”?
- Answer
-
A vertical line has 0 run and since division by 0 is undefined the slope is undefined.
Self Check
ⓐ After completing the exercises, use this checklist to evaluate your mastery of the objectives of this section.
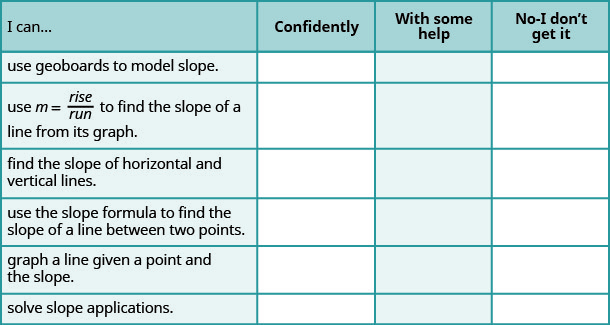
ⓑ On a scale of 1–10, how would you rate your mastery of this section in light of your responses on the checklist? How can you improve this?
Glossary
- geoboard
- A geoboard is a board with a grid of pegs on it.
- negative slope
- A negative slope of a line goes down as you read from left to right.
- positive slope
- A positive slope of a line goes up as you read from left to right.
- rise
- The rise of a line is its vertical change.
- run
- The run of a line is its horizontal change.
- slope formula
- The slope of the line between two points \(\left(x_{1}, y_{1}\right)\) and \(\left(x_{2}, y_{2}\right)\) is \(m=\frac{y_{2}-y_{1}}{x_{2}-x_{1}}\).
- slope of a line
- The slope of a line is \(m=\frac{\text { rise }}{\text { run }}\). The rise measures the vertical change and the run measures the horizontal change.