
3.4: Applications of Systems
- Page ID
- 51456
Learning Objectives
- Solve mixture problems
- Write a system of linear equations representing a mixture problem, solve the system and interpret the results
- Solve value problems
- Write a system of linear equations representing a number problem
- Determine and apply an appropriate method for solving the system
- Solve cost and revenue problems
- Specify what the variables in a cost/ revenue system of linear equations represent
- Determine and apply an appropriate method for solving the system
- Write a system of inequalites that represents the profit region
- Interpret the solutions to a system of cost/ revenue equations and inequalities
Write a system of linear equations representing a mixture problem, solve the system and interpret the results
One application of systems of equations are mixture problems. Mixture problems are ones where two different solutions are mixed together resulting in a new final solution. A solution is a mixture of two or more different substances like water and salt or vinegar and oil. Most biochemical reactions occur in liquid solutions, making them important for doctors, nurses, and researchers to understand. There are many other disciplines that use solutions as well.
The concentration or strength of a liquid solution is often described as a percentage. This number comes from the ratio of how much mass is in a specific volume of liquid. For example if you have 50 grams of salt in a 100mL of water you have a 50% salt solution based on the following ratio:
\(\frac{50\text{ grams }}{100\text{ mL }}=0.50\frac{\text{ grams }}{\text{ mL }}=50\text{ % }\)
Solutions used for most purposes typically come in pre-made concentrations from manufacturers, so if you need a custom concentration, you would need to mix two different strengths. In this section, we will practice writing equations that represent the outcome from mixing two different concentrations of solutions.
We will use the following table to help us solve mixture problems:
| Amount | Concentration (%) | Total | |
|---|---|---|---|
| Solution 1 | |||
| Solution 2 | |||
| Final Solution |
To demonstrate why the table is helpful in solving for unknown amounts or concentrations of a solution, consider two solutions that are mixed together, one is 120mL of a 9% solution, and the other is 75mL of a 23% solution. If we mix both of these solutions together we will have a new volume and a new mass of solute and with those we can find a new concentration.
First, find the total mass of solids for each solution by multiplying the volume by the concentration.
| Amount | Concentration (%) | Total Mass | |
|---|---|---|---|
| Solution 1 | 120 mL | 0.09 \(\left(120\cancel{\text{ mL}}\right)\left(0.09\frac{\text{ grams }}{\cancel{\text{ mL }}}\right)=10.8\text{ grams }\) | |
| Solution 2 | 75 mL | 0.23 \(\left(75\cancel{\text{ mL}}\right)\left(0.23\frac{\text{ grams }}{\cancel{\text{ mL }}}\right)=17.25\text{ grams }\) | |
| Final Solution |
Next we add the new volumes and new masses.
| Amount | Concentration (%) | Total Mass | |
|---|---|---|---|
| Solution 1 | 120 mL | 0.09 \(\left(120\cancel{\text{ mL}}\right)\left(0.09\frac{\text{ grams }}{\cancel{\text{ mL }}}\right)=10.8\text{ grams }\) | |
| Solution 2 | 75 mL | 0.23 \(\left(75\cancel{\text{ mL}}\right)\left(0.23\frac{\text{ grams }}{\cancel{\text{ mL }}}\right)=17.25\text{ grams }\) | |
| Final Solution | 195 mL | \(10.8\text{ grams }+17.25\text{ grams }=28.05\text{ grams }\) |
Now we have used mathematical operations to describe the result of mixing two different solutions. We know the new volume, concentration and mass of solute in the new solution. In the following examples, you will see that we can use the table to find an unknown final volume or concentration. These problems can have either one or two variables. We will start with one variable problems, then move to two variable problems.
Example
A chemist has 70 mL of a 50% methane solution. How much of an 80% solution must she add so the final solution is 60% methane?
[reveal-answer q=”274848″]Show Solution[/reveal-answer]
[hidden-answer a=”274848″]
Let’s use the problem solving process outlined in Module 1 to help us work through a solution to the problem.
Read and Understand: We are looking for a new amount – in this case a volume – based on the words “how much”. We know two starting concentrations and the final concentration, as well as one volume.
Define and Translate: Solution 1 is the 70 mL of 50% methane and solution 2 is the unknown amount with 80% methane. We can call our unknown amount x.
Write and Solve: Set up the mixture table. Remember that concentrations are written as decimals before we can perform mathematical operations on them.
| Amount | Concentration (%) | Total Mass | |
|---|---|---|---|
| Solution 1 | 70 | 0.5 | |
| Solution 2 | x | 0.8 | |
| Final Solution | 0.6 |
Multiply amount by concentration to get total, be sure to distribute on the last row: \(\left(70 + x\right)0.6\)Add the entries in the amount column to get final amount. The concentration for this amount is 0.6 because we want the final solution to be 60% methane.
| Amount | Concentration (%) | Total Mass | |
|---|---|---|---|
| Solution 1 | 70 | 0.5 | 35 |
| Solution 2 | x | 0.8 | 0.8x |
| Final Solution | 70+x | 0.6 | \(42+0.6x\) |
Add the total mass for solution 1 and solution 2 to get the total mass for the 60% solution. This is our equation for finding the unknown volume.
\(35+0.8x=42+0.6x\)
\(\begin{array}{c}35+0.8x=42+0.6x\\\underline{-0.6x}\,\,\,\,\,\,\,\underline{-0.6x}\\35+0.2x=42\\\end{array}\)
Subtract 35 from both sides
\(\begin{array}{c}35+0.2x=42\\\underline{-35}\,\,\,\,\,\,\,\underline{-35}\\0.2x=7\end{array}\)
Divide both sides by 0.2
\(\begin{array}{c}0.2x=7\\\frac{0.2x}{0.2}=\frac{7}{0.2}\end{array}\)
x=35
Answer
35mL must be added to the original 70 mL to gain a solution with a concentration of 60%
[/hidden-answer]
The above problem illustrates how we can use the mixture table to define an equation to solve for an unknown volume. In the next example we will start with two known concentrations and use a system of equations to find two starting volumes necessary to achieve a specified final concentration.
Example
A farmer has two types of milk, one that is 24% butterfat and another which is 18% butterfat. How much of each should he use to end up with 42 gallons of 20% butterfat?
[reveal-answer q=”966963″]Show Solution[/reveal-answer]
[hidden-answer a=”966963″]
Read and Understand: We are asked to find two starting volumes of milk whose concentrations of butterfat are both known. We also know the final volume is 42 gallons. There are two unknowns in this problem.
Define and Translate: We will call the unknown volume of the 24% solution x, and the unknown volume of the 18% solution y.
Write and Solve: Fill in the table with the information we know.
| Amount | Concentration (%) | Total Mass | |
|---|---|---|---|
| Solution 1 | x | 0.24 | |
| Solution 2 | y | 0.18 | |
| Final Solution | 42 | 0.2 |
Find the total mass by multiplying the amount of each solution by the concentration. The total mass of the final solution comes from
| Amount | Concentration (%) | Total Mass | |
|---|---|---|---|
| Solution 1 | x | 0.24 | 0.24x |
| Solution 2 | y | 0.18 | 0.18y |
| Final Solution | x+y=42 | 0.2 | 8.4 |
When you sum the amount column you get one equation: x+ y = 42
When you sum the total column you get a second equation: 0.24x + 0.18y = 8.4
Use elimination to find a value for x, and y.
Multiply the first equation by -0.18
-0.18(x+y) = (42)(-0.18)
-0.18x – -0.18y = -7.56
Now our system of equations looks like this:
-0.18x – -0.18y = -7.56
0.24x + 0.18y = 8.4
Adding the two equations together to eliminate the y terms gives this equation:
0.06x = 8.4
Divide by 0.06 on each side:
x = 14
Now substitute the value for x into one of the equations in order to solve for y.
(14) + y = 42
y = 28
Answer
This can be interpreted as 14 gallons of 24% butterfat milk added to 28 gallons of 18% butterfat milk will give 42 gallons of 20% butterfat milk.
[/hidden-answer]
In the following video you will be given an example of how to solve a mixture problem without using a table, and interpret the results.

A YouTube element has been excluded from this version of the text. You can view it online here: pb.libretexts.org/ba/?p=82
Write a system of linear equations representing a value problem
Systems of equations are a very useful tool for modeling real-life situations and answering questions about them. If you can translate the application into two linear equations with two variables, then you have a system of equations that you can solve to find the solution. You can use any method to solve the system of equations.
One application of system of equations are known as value problems. Value problems are ones where each variable has a value attached to it. For example, the marketing team for an event venue wants to know how to focus their advertising based on who is attending specific events—children, or adults? They know the cost of a ticket to a basketball game is $25.00 for children and $50.00 for adults. Additionally, on a certain day, attendance at the game is 2,000 and the total gate revenue is $70,000. How can the marketing team use this information to find out whether to spend more money on advertising directed toward children or adults?
We will use a table to help us set up and solve this value problem. The basic structure of the table is shown below:
| Number (usually what you are trying to find) | Value | Total |
|---|---|---|
| Item 1 | ||
| Item 2 | ||
| Total |
The first column in the table is used for the number of things we have. Quite often, this will be our variables. The second column is used for the value each item has. The third column is used for the total value which we calculate by multiplying the number by the value.
Example
Find the total number of child and adult tickets sold given that the cost of a ticket to a basketball game is $25.00 for children and $50.00 for adults. Additionally, on a certain day, attendance at the game is 2,000 and the total gate revenue is $70,000.
[reveal-answer q=”181202″]Show Solution[/reveal-answer]
[hidden-answer a=”181202″]
Read and Understand: We want to find the number of child and adult tickets, we know the total number of tickets sold, the total revenue and the cost of a child and adult ticket.
Define and Translate: Let c = the number of children and a = the number of adults in attendance. Revenue comes from number of tickets sold multiplied by the price of the ticket. We will get revenue for adults by multiplying $50.00 times a. $25.00 times c will give the revenue from the number of child tickets sold.
Write and Solve: We can use a table as we did in the mixture problems section to organize the information we have. Although a table is not necessary, it can help you get started. For this problem, we labeled columns as amount, value, and total revenue because that is the information we are given.
The total number of people is \(2,000\).
| Amount | Value | Total Revenue | |
|---|---|---|---|
| Child Tickets | c | $25.00 | 25c |
| Adult Tickets | a | $50.00 | 50a |
| Total Tickets | 2000 | $70,000 |
The total revenue is $70,000. We can use this and the revenue from child and adult tickets to write an equation for the revenue.\(25c+50a=70,000\)
| Amount | Value | Total Revenue | |
|---|---|---|---|
| Child Tickets | c | $25.00 | 25c |
| Adult Tickets | a | $50.00 | 50a |
| Total Tickets | 2000 | \(25c+50a=70,000\) |
The number of people at the game that day is the total number of child tickets sold plus the total number of adult tickets, \(c+a=2,000\)
| Amount | Value | Total Revenue | |
|---|---|---|---|
| Child Tickets | c | $25.00 | 25c |
| Adult Tickets | a | $50.00 | 50a |
| Total Tickets | \(25c+50a=70,000\) |
We now have a system of linear equations in two variables.\(\begin{array}{r}c+a=2,000\,\,\,\\ 25c+50a=70,000\end{array}\).
We can use any method of solving systems of equations to solve this system for a and c. Substitution looks easiest because we can solve the first equation for either \(a\). We will solve for \(a\).
\(\begin{array}{c}c+a=2,000\\ a=2,000-c\end{array}\)
Substitute the expression \(a\) and solve for \(c\).
\(\begin{array}{r} 25c+50\left(2,000-c\right)=70,000\,\,\,\, \\ 25c+100,000 - 50c=70,000\,\,\,\, \\ -25c=-30,000 \\ c=1,200\,\,\,\,\,\,\, \end{array}\)
Substitute \(a\).
\(\begin{array}{r}1,200+a=2,000 \\ a=800\,\,\,\,\,\, \end{array}\)
Answer
We find that \(800\) adults bought tickets to the game that day. The marketing group may want to focus their advertising toward attracting young people.
[/hidden-answer]
This example showed you how to find two unknown values given information that connected the two unknowns. With two equations, you are able to find a solution for two unknowns. If you were to have three unknowns, you would need three equations to find them, and so on.
In the following video, you are given an example of how to use a system of equations to find the number of children and adults admitted to an amusement park based on entrance fees and total revenue. This example shows how to write equations and solve the system without a table.

A YouTube element has been excluded from this version of the text. You can view it online here: pb.libretexts.org/ba/?p=82
In the next example, we will find the number of coins in a change jar given the total amount of money in the jar and the fact that the coins are either quarters or dimes.
Example
In a change jar there are 11 coins that have a value of S1.85. The coins are either quarters or dimes. How many of each kind of coin is in the jar?
[reveal-answer q=”698872″]Show Solution[/reveal-answer]
[hidden-answer a=”698872″]
Read and Understand: We want to find the number of quarters and the number of dimes in the jar. We know that dimes are $0.10 and quarters are $0.25, and the total number of coins is 11.
Define and Translate: We will call the number of quarters q and the number of dimes d. The part of the total $1.85 that comes from quarters will be determined by how many quarters and the fact that each one is worth $0.25, so $0.25q represents the amount of $1.85 that is quarters. The same idea can be used for dimes, so $0.10d represents the amount of $1.85 that is dimes.
Write and Solve: We can label a new table with the information we are given.
| number | value | total | |
|---|---|---|---|
| quarters | q | $0.25 | $0.25q |
| dimes | d | $0.10 | $0.10d |
| total number of coins | q+d=11 | $0.25q+$0.10d=$1.85 |
We can write our two equations, remember that we need two to solve for two unknowns.
\(\begin{array}{r}q+d=11\,\,\,\\0.25q+0.10d=1.85\end{array}\)
Substitution looks like the easiest path to a solution, solve for q.
\(\begin{array}{c}q+d=11\\ q=11-d\end{array}\)
Substitute this into the other equation, and solve for d.
\(\begin{array}{r}0.25\left(11-d\right)+0.10d=1.85\,\,\,\, \\2.75-0.25d+0.10d=1.85\,\,\,\,\\ 2.75-0.15d=1.85\\-0.15d=-0.9\\\,\,\,\,\,\,\, d=6\end{array}\)
Substitute \(q\).
\(\begin{array}{r}q+6=11 \\q=5\,\,\,\,\,\, \end{array}\)
Answer
We have 6 dimes and 5 quarters.
[/hidden-answer]
In the following video, you will see an example similar to the previous one, except that the equations are written and solved without the use of a table.

A YouTube element has been excluded from this version of the text. You can view it online here: pb.libretexts.org/ba/?p=82
Cost and Revenue Problems
A skateboard manufacturer introduces a new line of boards. The manufacturer tracks its costs, which is the amount it spends to produce the boards, and its revenue, which is the amount it earns through sales of its boards. How can the company determine if it is making a profit with its new line? How many skateboards must be produced and sold before a profit is possible?

Using what we have learned about systems of equations, we can answer these questions. The skateboard manufacturer’s revenue equation is the equation used to calculate the amount of money that comes into the business. It can be represented as \(x=\) quantity and \(p=\) price. The revenue equation is shown in orange in the graph below.
The cost equation is the equation used to calculate the costs of doing business. It includes fixed costs, such as rent and salaries, and variable costs, such as utilities. The cost equation is shown in blue in the graph below. The \(x\) -axis represents quantity in hundreds of units. The y-axis represents both cost and revenue in hundreds of dollars. We won’t learn how to write a cost equation in this example, they will be given to you. If you take any business or economics courses, you will learn more about how to write a cost equation.
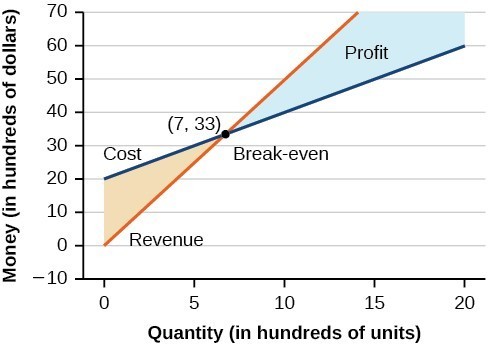
The point at which the two lines intersect is called the break-even point, we learned that this is the solution to the system of linear equations that in this case comprise the cost and revenue equations.
Read the axes of the graph carefully, note that quantity is in hundreds, and money is in thousands. The solution to the graphed system is (7, 33). This means that if 700 units are produced, the cost to make them is $3,300 and the revenue is also $3,300. In other words, the company breaks even if they produce and sell 700 units. They neither make money nor lose money.
The shaded region to the right of the break-even point represents quantities for which the company makes a profit. The shaded region to the left represents quantities for which the company suffers a loss.
Example
A business wants to manufacture bike frames. Before they start production, they need to make sure they can make a profit with the materials and labor force they have. Their accountant has given them a cost equation of \(y=1.55x\):
- Interpret x and y for the cost equation
- Interpret x and y for the revenue equation
[reveal-answer q=”86281″]Show Solution[/reveal-answer]
[hidden-answer a=”86281″]
Cost: \(y=0.85x+35,000\)
Revenue:\(y=1.55x\)
The cost equation represents money leaving the company, namely how much it costs to produce a given number of bike frames. If we use the skateboard example as a model, x would represent the number of frames produced (instead of skateboards) and y would represent the amount of money it would cost to produce them (the same as the skateboard problem).
The revenue equation represents money coming into the company, so in this context x still represents the number of bike frames manufactured, and y now represents the amount of money made from selling them. Let’s organize this information in a table:
| Equation Type | x represents | y represents |
| Revenue Eqn. | number of frames | amount of money made selling frames |
| Cost Eqn. | number of frames | cost for making frames |
[/hidden-answer]
Example
Given the same cost and revenue equations from the previous example, find the break-even point for the bike manufacturer. Interpret the solution with words.
Cost: \(y=0.85x+35,000\)
Revenue: \(y=1.55x\)
[reveal-answer q=”145700″]Show Solution[/reveal-answer]
[hidden-answer a=”145700″]
Read and Understand: We want the break even point for this system that represents cost and revenue. This means we want to find where the two lines cross, and we have learned a few different methods for doing this because this is the solution to the system of equations! Substitution looks like the easiest method since the revenue equation is already solved for y, \(y=1.55x\).
Define and Translate: Write the system of equations.
\(\begin{array}{l}\\ y=0.85x+35,000\hfill \\ y=1.55x\hfill \end{array}\\\)
Write and Solve: The equations are already written for us, so we just need to solve the system using substitution.
Substitute the expression \(x\).
\(x=50,000\) into either the cost equation or the revenue equation.
\(\left(50,000,77,500\right)\).
Check and Interpret:
The solution to this system is\(\left(x,y)\), where in this case x is the quantity of bikes manufactured and y is an amount of money. For our system y represents two different things and x represents one thing. Refer to tehe table we made in the first example, shown below:
| Equation Type | x represents | y represents |
| Revenue Eqn. | number of frames | amount of money made selling frames |
| Cost Eqn. | number of frames | cost for making frames |
Let’s interpret the solution with respect to the Cost equation first. x = 50,000 and y = 77,500. Using our table, we can translate this as “the cost for producing 50,000 bike frames is $75,500”.
In the same way, the Revenue equation can be interpreted as “the amount of money the company makes from selling 50,000 bike frames is $77,500”.
[/hidden-answer]
In the next example, you will see how the information you learned about systems of linear inequalities can be applied to answering questions about cost and revenue. Below is a graph of the Cost/ Revenue system in the previous system:
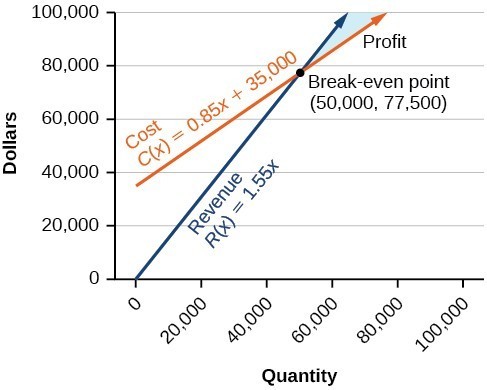
Note how the blue shaded region between the Cost and Revenue equations is labeled Profit. This is the “sweet spot” that the company wants to achieve where they produce enough bike frames at a minimal enough cost to make money. They don’t want more money going out than coming in!
The following example shows how to write the system of linear equations as a system of linear inequalities whose solution set is the profit region for the system.
Example
Define the profit region for the bike manufacturing business using inequalities, given the system of linear equations:
Cost: \(y=0.85x+35,000\)
Revenue: \(y=1.55x\)
[reveal-answer q=”563864″]Show Solution[/reveal-answer]
[hidden-answer a=”563864″]
Read and Understand: We know that graphically, solutions to linear inequalities are entire regions, and we learned how to graph systems of linear inequalities earlier in this module. Based on the graph below and the equations that define cost and revenue, we can use inequalities to define the region for which the bike manufacturer will make a profit.
Let’s start with the revenue equation. We know that the break even point is at (50,000, 77,500) and the profit region is the blue area. If we choose a point in the region and test it like we did for finding solution regions to inequalities, we will know which kind of inequality sign to use.
Let’s test the point \(\left(65,00,100,000\right)\) in both equations to determine which inequality sign to use.
Cost:
\(\begin{array}{l}y=0.85x+{35,000}\\{100,000}\text{ ? }0.85\left(65,000\right)+35,000\\100,000\text{ ? }90,250\end{array}\)
We need to use > because 100,000 is greater than 90,250
The cost inequality that will ensure the company makes profit – not just break even – is \(y>0.85x+35,000\)
Now test the point in the revenue equation:
Revenue:
\(\begin{array}{l}y=1.55x\\100,000\text{ ? }1.55\left(65,000\right)\\100,000\text{ ? }100,750\end{array}\)
We need to use < because 100,000 is less than 100,750
The revenue inequality that will ensure the company makes profit – not just break even – is \(y<1.55x\)
The systems of inequalities that defines the profit region for the bike manufacturer:
\(\begin{array}{l}y>0.85x+35,000\\y<1.55x\end{array}\)
Answer
The cost to produce 50,000 units is $77,500, and the revenue from the sales of 50,000 units is also $77,500. To make a profit, the business must produce and sell more than 50,000 units. The system of linear inequalities that represents the number of units that the company must produce in order to earn a profit is:
\(\begin{array}{l}y>0.85x+35,000\\y<1.55x\end{array}\)
[/hidden-answer]
In the following video you will see an example of how to find the break even point for a small sno-cone business.

A YouTube element has been excluded from this version of the text. You can view it online here: pb.libretexts.org/ba/?p=82
Summary
In this section, we saw two examples of writing a system of two linear equations to find two unknowns that were related to each other. In the first, the equations were related by the sum of the number of tickets bought and the sum of the total revenue brought in by the tickets sold. In the second problem, the relationships were similar. The two variables were related by the sum of the number of coins, and the total value of the coins.
We have seen that systems of linear equations and inequalities can help to define market behaviors that are very helpful to businesses. The intersection of cost and revenue equations gives the break even point, and also helps define the region for which a company will make a profit.
- Revision and Adaptation. Provided by: Lumen Learning. License: CC BY: Attribution
- System of Equations App: Break-Even Point. Authored by: James Sousa (Mathispower4u.com) for Lumen Learning. Located at: https://youtu.be/qey3FmE8saQ. License: CC BY: Attribution
- Ex: System of Equations Application - Mixture Problem. Authored by: James Sousa (Mathispower4u.com) for Lumen Learning. Located at: https://youtu.be/4s5MCqphpKo. License: CC BY: Attribution
- Unit 14: Systems of Equations and Inequalities, from Developmental Math: An Open Program. Provided by: Monterey Institute of Technology and Education. Located at: nrocnetwork.org/resources/downloads/nroc-math-open-textbook-units-1-12-pdf-and-word-formats/. License: CC BY: Attribution
- College Algebra. Authored by: Jay Abrams, et al.. Provided by: OpenStax. Located at: https://openstaxcollege.org/textbooks/college-algebra.. License: CC BY: Attribution
- Beginning and Intermediate Algebra Textbook. Authored by: Tyler Wallace. Located at: http://www.wallace.ccfaculty.org/book/book.html. License: CC BY: Attribution
- College Algebra. Authored by: Abramson, Jay. Provided by: OpenStax. Located at: https://openstaxcollege.org/textbooks/college-algebra. License: CC BY: Attribution