
21.12: I1.12- Exercises
- Page ID
- 51712
\( \newcommand{\vecs}[1]{\overset { \scriptstyle \rightharpoonup} {\mathbf{#1}} } \) \( \newcommand{\vecd}[1]{\overset{-\!-\!\rightharpoonup}{\vphantom{a}\smash {#1}}} \)\(\newcommand{\id}{\mathrm{id}}\) \( \newcommand{\Span}{\mathrm{span}}\) \( \newcommand{\kernel}{\mathrm{null}\,}\) \( \newcommand{\range}{\mathrm{range}\,}\) \( \newcommand{\RealPart}{\mathrm{Re}}\) \( \newcommand{\ImaginaryPart}{\mathrm{Im}}\) \( \newcommand{\Argument}{\mathrm{Arg}}\) \( \newcommand{\norm}[1]{\| #1 \|}\) \( \newcommand{\inner}[2]{\langle #1, #2 \rangle}\) \( \newcommand{\Span}{\mathrm{span}}\) \(\newcommand{\id}{\mathrm{id}}\) \( \newcommand{\Span}{\mathrm{span}}\) \( \newcommand{\kernel}{\mathrm{null}\,}\) \( \newcommand{\range}{\mathrm{range}\,}\) \( \newcommand{\RealPart}{\mathrm{Re}}\) \( \newcommand{\ImaginaryPart}{\mathrm{Im}}\) \( \newcommand{\Argument}{\mathrm{Arg}}\) \( \newcommand{\norm}[1]{\| #1 \|}\) \( \newcommand{\inner}[2]{\langle #1, #2 \rangle}\) \( \newcommand{\Span}{\mathrm{span}}\)\(\newcommand{\AA}{\unicode[.8,0]{x212B}}\)
Part I.
Reproduce the results in the Examples 1–10.
Part II.
For each dataset in these problems, please do not type it in yourself, but find the text below on the course web page and “copy and paste” it into the spreadsheet. This will save you quite a lot of work.
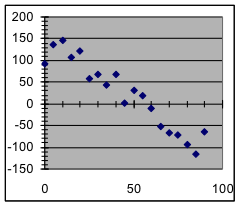
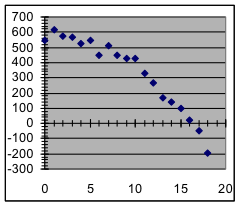
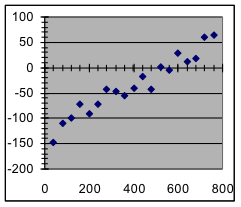
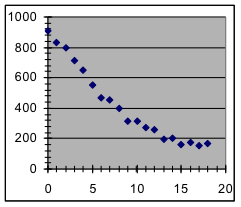
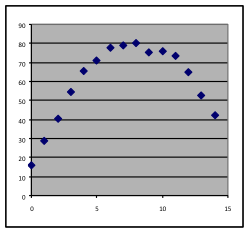
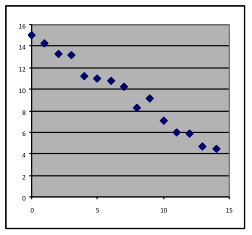
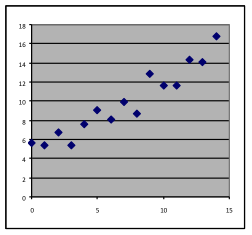
- Which of these graphs indicate data in which the variables have an approximately linear relationship?
[a]
| [b]
| [c]
| [d]
|
- For which of the datasets graphed in the previous exercise will a linear model probably be a better predictor of future measurements than the corresponding measurements in the dataset?
- A truck delivers loads of kerosene. The relationship between the gallons of kerosene it is carrying and the total weight in pounds of the truck follows a
linear model, where x is the number of gallons and y is the weight. What is the expected weight of the truck when it is loaded with 5290 gallons of kerosene?
- What linear model would be appropriate if you want to use the weight of the truck in the previous problem to predict how much kerosene it is loaded with?
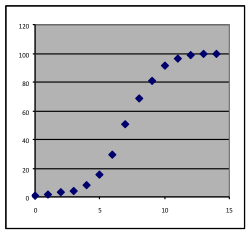
- Which of these datasets has a relationship between the variables whose trend is linear?
[a]
| [b]
| [c]
| [d]
| [e]
|
- For each of the datasets in the previous problem that was identified as having a linear relationship, find and report a good linear model.
- Use the model for dataset [a] above to predict the output y variable for input values of x at intervals of 100 from 0 to 600.
- Use the model for dataset [e] above to predict the output y variable for input values of x at intervals of 50 from 0 to 350.
- For each of the graphs below, identify where a linear or quadratic model would be appropriate, or whether neither of these. In each case, write a sentence stating what reason you have for the choice you make.
[19a]
| [19b]
| [19c]
| [19d]
|
| year | Cable systems |
| 1990 | 10,215 |
| 1991 | 10,704 |
| 1992 | 11,073 |
| 1993 | 11,108 |
| 1994 | 11,214 |
| 1995 | 11,215 |
| 1996 | 11,220 |
| 1997 | 10,943 |
| 1998 | 10,845 |
| 1999 | 10,700 |
| 2000 | 10,500 |
For each dataset in the following problems, please do not type it in yourself, but find the data text on the course web page and “copy and paste” it into the spreadsheet. This will save you quite a lot of work.
- For the dataset to the right about cable systems:
- Identify the input and output variables for predicting cable system count.
- Restate the input variable in terms of years since the first year given.
- Use a spreadsheet to make a graph of the data and label the axes. (hand-labeling is okay)
- Use the quadratic-model spreadsheet to find a good quadratic model and state its formula.
- Using the model, predict the number of cable systems in 2003.
- What year does the model imply that the most cable systems existed?
| MPG | MPH |
| 17 | 10 |
| 25 | 20 |
| 30 | 30 |
| 32 | 40 |
| 31 | 50 |
| 28 | 60 |
| 22 | 70 |
- For the dataset at the right about gas mileage (MPG) at different speeds (MPH):
- Identify the input and output variables appropriate for predicting mileage.
- Use a spreadsheet to make an appropriate graph and label the axes. (hand-labeling is okay)
- Use the quadratic-model spreadsheet to find a good quadratic model and state its formula.
- Using the model, predict the gas mileage for a speed of 25 mph.
- At what speed does the model imply that gas mileage is best?
CC licensed content, Shared previously
- Mathematics for Modeling. Authored by: Mary Parker and Hunter Ellinger. License: CC BY: Attribution