
3.8: Polynomial and Rational Inequalities
- Page ID
- 44357
Skills to Develop
- Solve polynomial inequalities.
- Solve rational inequalities.
Solving Polynomial Inequalities
A polynomial inequality is a mathematical statement that relates a polynomial expression as either less than or greater than another. We can use sign charts to solve polynomial inequalities with one variable.
Graphs are helpful in providing a visualization to the solutions of polynomial inequalities. Examine the graph below to see the relationship between a graph of a polynomial and its corresponding sign chart.
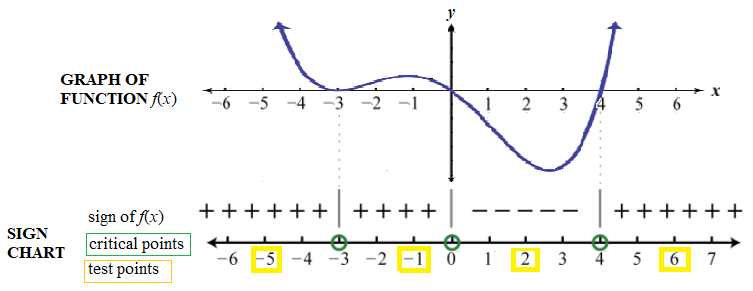
In this graph, the \(x\)-intercepts, -3, 0 and 4, are critical points, which are the only places where the graph may possibly change from being above the \(x\)-axis (where we say that \(f(x) > 0) \) ), to below the \(x\)-axis (where we say that \(f(x) < 0) \). Within each interval between two adjacent critical points, the graph is either always above the \(x\)-axis, or always below the \(x\)-axis. Thus, finding the critical points of a polynomial inequality plays a fundamental role in solving a polynomial inequality.
![]() How to: Solve a Polynomial Inequality.
How to: Solve a Polynomial Inequality.
- Step 1: Rewrite the inequality so there is a zero on the right side of the inequality. The expression on the left side designate as \(f(x)\).
- Step 2: Find the critical numbers. Critical numbers for polynomial functions are the real number solutions to \( f(x) = 0 \). Draw a number line with the critical numbers labelled. Draw an open circle at each critical number if the inequality uses "<" or ">"; draw a filled in circle at each critical number if the inequality uses " \( \le \)" or "\( \ge \)".
- Step 3: Create a sign chart. The critical numbers partition the number line into regions. Choose a test value for each region, including one to the left of all the critical values and one to the right of all the critical values. For each test value, \(v\), determine if \(f(v)\) is positive or negative and record the result on the sign chart for each region.
- Step 4: Use the sign chart to find the set of all values of \(x\) for which the inequality is true. Write the answer in interval notation.
Example \(\PageIndex{1}\)
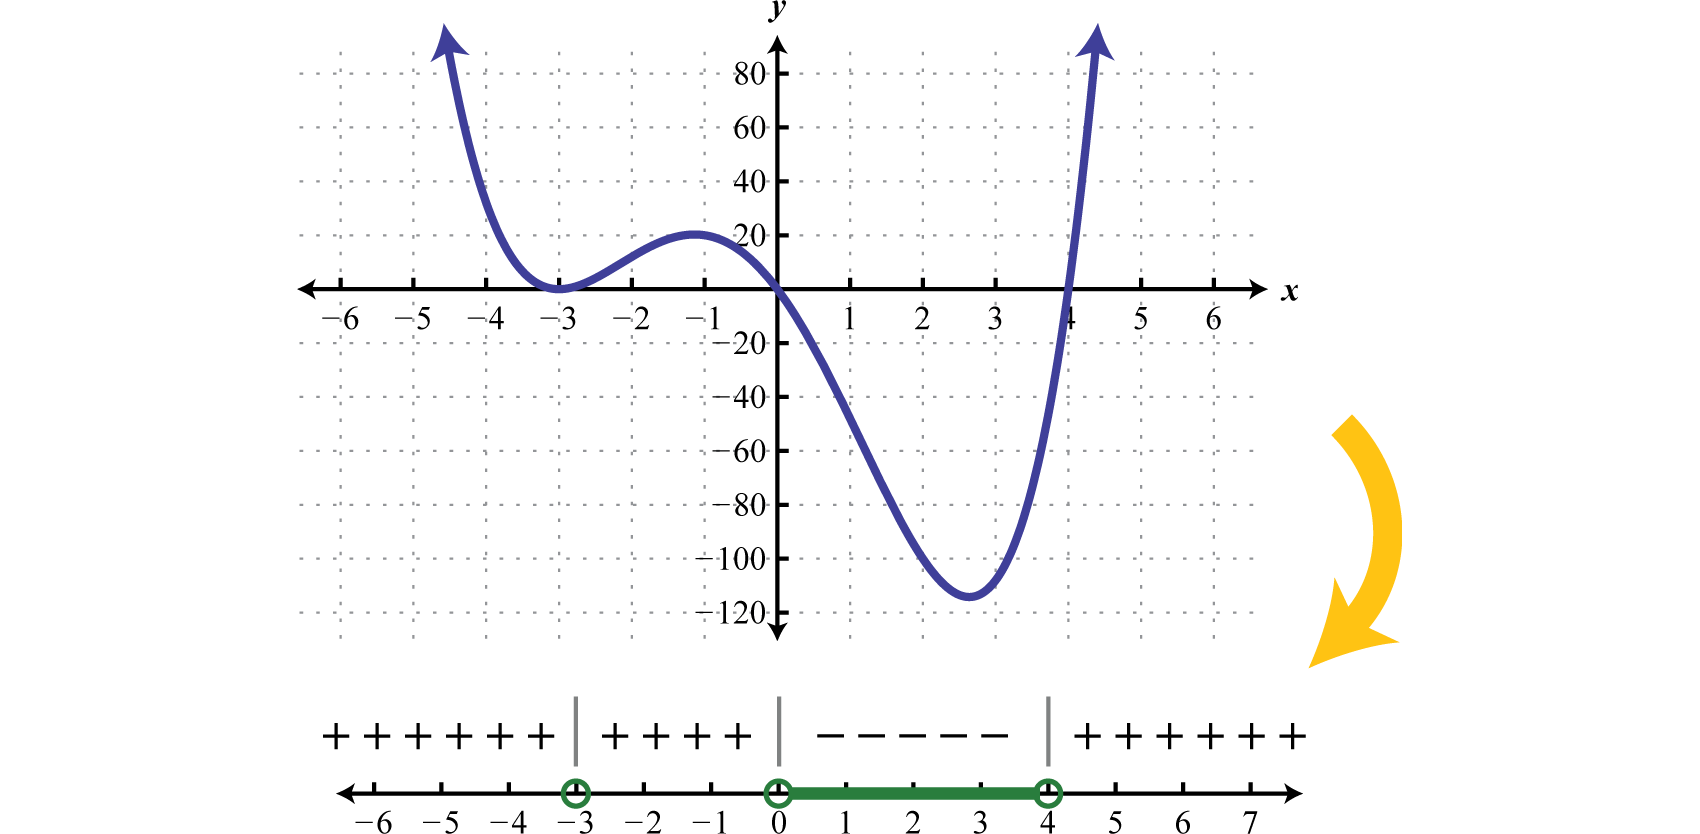
Solve \(x(x+3)^{2}(x-4)<0\).
Solution
Step 2. Begin by finding the critical numbers. For a polynomial inequality in standard form, with zero on one side, the critical numbers are the roots. Because \(f (x) = x(x + 3)^{2} (x − 4)\) is given in its factored form the roots are apparent. Here the roots are: \(0, −3\), and \(4\). Because of the strict inequality, plot them using open dots on a number line.

Step 3. In this case, the critical numbers partition the number line into four regions. Test values in each region to determine if \(f\) is positive or negative. Here we choose test values \(−5, −1, 2\), and \(6\). Remember that we are only concerned with the sign \((+\) or \(−)\) of the result.
\(\begin{aligned} f(\color{OliveGreen}{-5}\color{black}{)}&=(\color{OliveGreen}{-5}\color{black}{)}(\color{OliveGreen}{-5}\color{black}{+}3)^{2}(\color{OliveGreen}{-5}\color{black}{-}4) =(-)(-)^{2}(-)&=+\color{Cerulean} { Positive} \\ f(\color{OliveGreen}{-1}\color{black}{)}&=(\color{OliveGreen}{-1}\color{black}{)}(\color{OliveGreen}{-1}\color{black}{+}3)^{2}(\color{OliveGreen}{-1}\color{black}{-}4) =(-)(+)^{2}(-)&=+\color{Cerulean} { Positive } \\ f(\color{OliveGreen}{2}\color{black}{)}&=(\color{OliveGreen}{2}\color{black}{)}(\color{OliveGreen}{2}\color{black}{+}3)^{2}(\color{OliveGreen}{2}\color{black}{-}4) =(+)(+)^{2}(-)&=-\color{Cerulean} { Negative } \\ f(\color{OliveGreen}{6}\color{black}{)}&=(\color{OliveGreen}{6}\color{black}{)}(\color{OliveGreen}{6}\color{black}{+}3)^{2}(\color{OliveGreen}{6}\color{black}{-}4) =(+)(+)^{2}(+)&=+\color{Cerulean} { Positive } \end{aligned}\)
After testing values we can complete a sign chart.

Step 4. The question asks us to find the values where \(f (x) < 0\), or where the function is negative. From the sign chart we can see that the function is negative for \(x\)-values in between \(0\) and \(4\).

We can express this solution set in two ways:
\(\begin{aligned}\{x | 0<&x<4\} &\color{Cerulean} { Set\: notation } \\ (0,&4) &\color{Cerulean} { Interval\: notation }\end{aligned}\)
In this sectionwe will continue to present solution sets using interval notation. Answer: \((0,4)\)
Graphs can help us to visualize solutions of polynomial inequalities. Below is the graph of the function in the above example. Compare the graph to its corresponding sign chart. Notice that the sign chart is positive when the graph is above the \(x\)-axis and negative when the graph is below the \(x\)-axis. The graph crosses or touches the \(x\)-axis at the critical points.
Certainly it may not be the case that the polynomial is factored nor that it has zero on one side of the inequality. To model a function using a sign chart, all of the terms should be on one side and zero on the other. The general steps for solving a polynomial inequality are listed in the following example.
Example \(\PageIndex{2}\)
Solve: \(2 x^{4}>3 x^{3}+9 x^{2} \).
Solution
Step 1: Obtain zero on one side of the inequality. In this case, subtract to obtain a polynomial on the left side in standard form.
\(\begin{aligned}2 x^{4}&>3 x^{3}+9 x^{2} \\ 2 x^{4}-3 x^{3}-9 x^{2}&>0\end{aligned}\)
Step 2: Find the critical numbers. Here we can find the zeros by factoring.
\(2 x^{4}-3 x^{3}-9 x^{2}=0 \)
\(x^{2}\left(2 x^{2}-3 x-9\right)=0 \)
\(x^{2}(2 x+3)(x-3)=0 \)
There are three solutions, hence, three critical numbers \(−\frac{3}{2}, 0\), and \(3\). The strict inequality indicates that we should use open dots.

Step 3: Create a sign chart. In this case use \(f (x) = x^{2} (2x + 3) (x − 3) \) and test values \(−2, −1, 1\), and \(4\) to determine the sign of the function in each interval.
\(\begin{aligned} f(\color{OliveGreen}{-2}\color{black}{)} &=(\color{OliveGreen}{-2}\color{black}{)}^{2}[2(\color{OliveGreen}{-2}\color{black}{)}+3](\color{OliveGreen}{-2}\color{black}{-}3)&=(-)^{2}(-)(-)=+\\ f(\color{OliveGreen}{-1}\color{black}{)} &=(\color{OliveGreen}{-1}\color{black}{)}^{2}[2(\color{OliveGreen}{-1}\color{black}{)}+3](\color{OliveGreen}{-1}\color{black}{-}3)&=(-)^{2}(+)(-)=-\\ f(\color{OliveGreen}{1}\color{black}{)} &=(\color{OliveGreen}{1}\color{black}{)}^{2}[2(\color{OliveGreen}{1}\color{black}{)}+3](\color{OliveGreen}{1}\color{black}{-}3) &=(+)^{2}(+)(-)=-\\ f(\color{OliveGreen}{4}\color{black}{)} &=(\color{OliveGreen}{4}\color{black}{)}^{2}[2(\color{OliveGreen}{4}\color{black}{)}+3](\color{OliveGreen}{4}\color{black}{-}3) &=(+)^{2}(+)(+)=+\end{aligned}\)
With this information we can complete the sign chart.

Step 4: Use the sign chart to answer the question. Here the solution consists of all values for which \(f (x) > 0\). Shade in the values that produce positive results and then express this set in interval notation.

Answer: \(\left(-\infty,-\frac{3}{2}\right) \cup(3, \infty)\)
Example \(\PageIndex{3}\)
Solve: \(x^{3}+x^{2} \leq 4(x+1)\).
Solution
Step 1. Begin by rewriting the inequality in standard form, with zero on one side.
\(\begin{aligned}x^{3}+x^{2} &\leq 4(x+1) \\ x^{3}+x^{2} &\leq 4 x+4 \\ x^{3}+x^{2}-4 x-4 &\leq 0\end{aligned}\)
Step 2. Next find the critical numbers of \(f(x)=x^{3}+x^{2}-4 x-4\):
\(\begin{aligned} x^{3}+x^{2}-4 x-4 &=0 \quad\color{Cerulean} { Factor\: by\: grouping.} \\ x^{2}(x+1)-4(x+1) &=0 \\(x+1)\left(x^{2}-4\right) &=0 \\(x+1)(x+2)(x-2) &=0 \end{aligned}\)
The critical numbers are \(−2, −1\), and \(2\). Because of the inclusive inequality \((≤)\) we will plot them using closed dots.

Step 3. Use test values, \(-3\), \(-\frac{3}{2}\), \(0\), and \(3\) to create a sign chart.
\(\begin{aligned} f(\color{OliveGreen}{-3}\color{black}{)}&=(\color{OliveGreen}{-3}\color{black}{+}1)(\color{OliveGreen}{-3}\color{black}{+}2)(\color{OliveGreen}{-3}\color{black}{-}2) &=(-)(-)(-)=- \\ f(\color{OliveGreen}{-\frac{3}{2}}\color{black}{)}&=(\color{OliveGreen}{-\frac{3}{2}}\color{black}{+}1)(\color{OliveGreen}{-\frac{3}{2}}\color{black}{+}2)(\color{OliveGreen}{-\frac{3}{2}}\color{black}{-}2) &=(-)(+)(-)=+\\ f(\color{OliveGreen}{0}\color{black}{)}&=(\color{OliveGreen}{0}\color{black}{+}1)(\color{OliveGreen}{0}\color{black}{+}2)(\color{OliveGreen}{0}\color{black}{-}2)&=(+)(+)(-)=- \\ f(\color{OliveGreen}{3}\color{black}{)}&=(\color{OliveGreen}{3}\color{black}{+}1)(\color{OliveGreen}{3}\color{black}{+}2)(\color{OliveGreen}{3}\color{black}{-}2)&=(+)(+)(+)=+\end{aligned}\)
And we have

Step 4. Use the sign chart to shade in the values that have negative results \((f (x) ≤ 0)\).

Answer: \((-\infty,-2] \cup[-1,2]\)
![]() \(\PageIndex{3}\)
\(\PageIndex{3}\)
Solve \(-3 x^{4}+12 x^{3}-9 x^{2}>0\).
- Answer
-
\((1,3)\)
Solving Rational Inequalities
A rational inequality is a mathematical statement that relates a rational expression as either less than or greater than another. Because rational functions have restrictions to the domain we must take care when solving rational inequalities. In addition to the zeros, we will include the restrictions to the domain of the function in the set of critical numbers.
Graphs are helpful in providing a visualization to the solutions of rational inequalities. Examine the graph below to see the relationship between a graph of a rational function and its corresponding sign chart. It is very similar to the sign chart for polynomials except additionally, vertical asymptotes are included in the list of critical points.
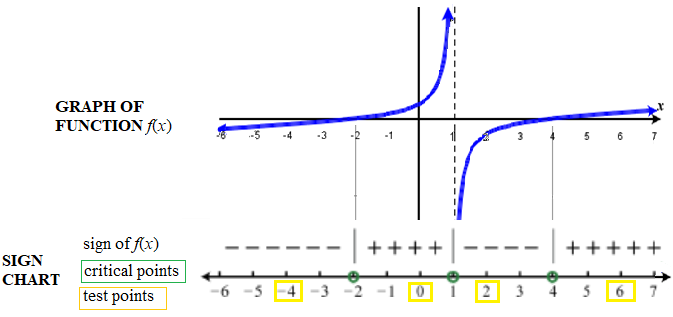
Both the x- intercepts, -2 and 4, and the vertical asymptote \(x=1\) are critical points. The vertical asymptote occurs at \(x=1\) because that is the value that makes the denominator zero, and thus makes the rational expression undefined. Again, these critical points are the only places where the graph may possibly change from being above the \(x\)-axis (where \(f(x) > 0) \) ), to below the \(x\)-axis (where \(f(x) < 0) \). Within each interval between two adjacent critical points, the graph is either always above the \(x\)-axis, or always below the \(x\)-axis. Thus, finding the critical points of a rational inequality plays a fundamental role in solving it.
![]() Howto: Solve a Rational Inequality.
Howto: Solve a Rational Inequality.
- Step 1: Rewrite the inequality so there is a zero on the right side of the inequality. Write the expression on the left as a single algebraic fraction. Designate this fraction as \(f(x)\).
- Step 2: Find the critical numbers. For rational inequalities these critical numbers come from two sources.
- Solve \(f((x)=0\). Find values that make the numerator of \(f(x)\) zero. These critical points are the \(x\)-intercepts. If the inequality uses "<" or ">", draw an open circle at each of these critical numbers; if the inequality uses " \( \le \)" or "\( \ge \)", draw a filled in circle at each of these critical numbers .
- Solve \(f((x)=undefined\). Find values that make the denominator of \(f(x)\) zero. These critical points are where the vertical asymptotes are. These values are not part of the domain of \(f(x)\). Therefore these critical values are never part of the solution set. Always draw an open circle at each of these critical numbers.
- Step 3: Create a sign chart. The critical numbers partition the number line into regions. Choose a test value for each region, including one to the left of all the critical values and one to the right of all the critical values. For each test value, \(v\), determine if \(f(v)\) is positive or negative and record the result on the sign chart for each region.
- Step 4: Use the sign chart to find the set of all values of \(x\) for which the inequality is true. Write the answer in interval notation.
Example \(\PageIndex{4}\)
Solve: \(\dfrac{(x-4)(x+2)}{(x-1)} \geq 0\)
Solution
Step 2. The zeros of a rational function occur when the numerator is zero and the values that produce zero in the denominator are the restrictions. In this case,
\(\begin{array}{c | c}{\text { Roots (Numerator) }} & {\text{Restriction(Denominator)}} \\ {x-4=0 \text { or } x+2=0} & {x-1=0} \\ { x=4 \quad\quad\quad x=-2}& {x=1}\end{array}\)
Therefore the critical numbers are \(−2, 1\), and \(4\). Because of the inclusive inequality \((≥)\) use a closed dot for the roots \({−2, 4}\) and always use an open dot for restrictions \({1}\). Restrictions are never included in the solution set.

Step 3. Use test values \(x = −4, 0, 2, 6\).
\(\begin{aligned} f(\color{OliveGreen}{-4}\color{black}{)} &=\frac{(\color{OliveGreen}{-4}\color{black}{-}4)(\color{OliveGreen}{-4}\color{black}{+}2)}{(\color{OliveGreen}{-4}\color{black}{-}1)}&=\frac{(-)(-)}{(-)}=-\\ f(\color{OliveGreen}{0}\color{black}{)} &=\frac{(\color{OliveGreen}{0}\color{black}{-}4)(\color{OliveGreen}{0}\color{black}{+}2)}{(\color{OliveGreen}{0}\color{black}{-}1)}&=\frac{(-)(+)}{(-)}=+\\ f(\color{OliveGreen}{2}\color{black}{)} &=\frac{(\color{OliveGreen}{2}\color{black}{-}4)(\color{OliveGreen}{2}\color{black}{+}2)}{(\color{OliveGreen}{2}\color{black}{-}1)}&=\frac{(-)(+)}{(+)}=-\\ f(\color{OliveGreen}{6}\color{black}{)} &=\frac{(\color{OliveGreen}{6}\color{black}{-}4)(\color{OliveGreen}{6}\color{black}{+}2)}{(\color{OliveGreen}{6}\color{black}{-}1)}&=\frac{(+)(+)}{(+)}=+\end{aligned}\)
And then complete the sign chart.

Step 4. The question asks us to find the values for which \(f (x) ≥ 0\), in other words, positive or zero. Shade in the appropriate regions and present the solution set in interval notation.

Answer: \([-2,1) \cup[4, \infty)\)
Once again the graph of this function below provides a visualization of what the sign chart means. As in the case with the polynomial inequality, the sign chart is positive when the graph is above the \(x\)-axis and negative when the graph is below the \(x\)-axis. The graph (potentially) changes from being above the \(x\)-axis to below the \(x\)-axis at the critical values. Unlike the polynomial, where critical values are only where the graph crosses or touches the \(x\)-axis, for rational functions, critical values also exist at the vertical asymptotes of the graph.
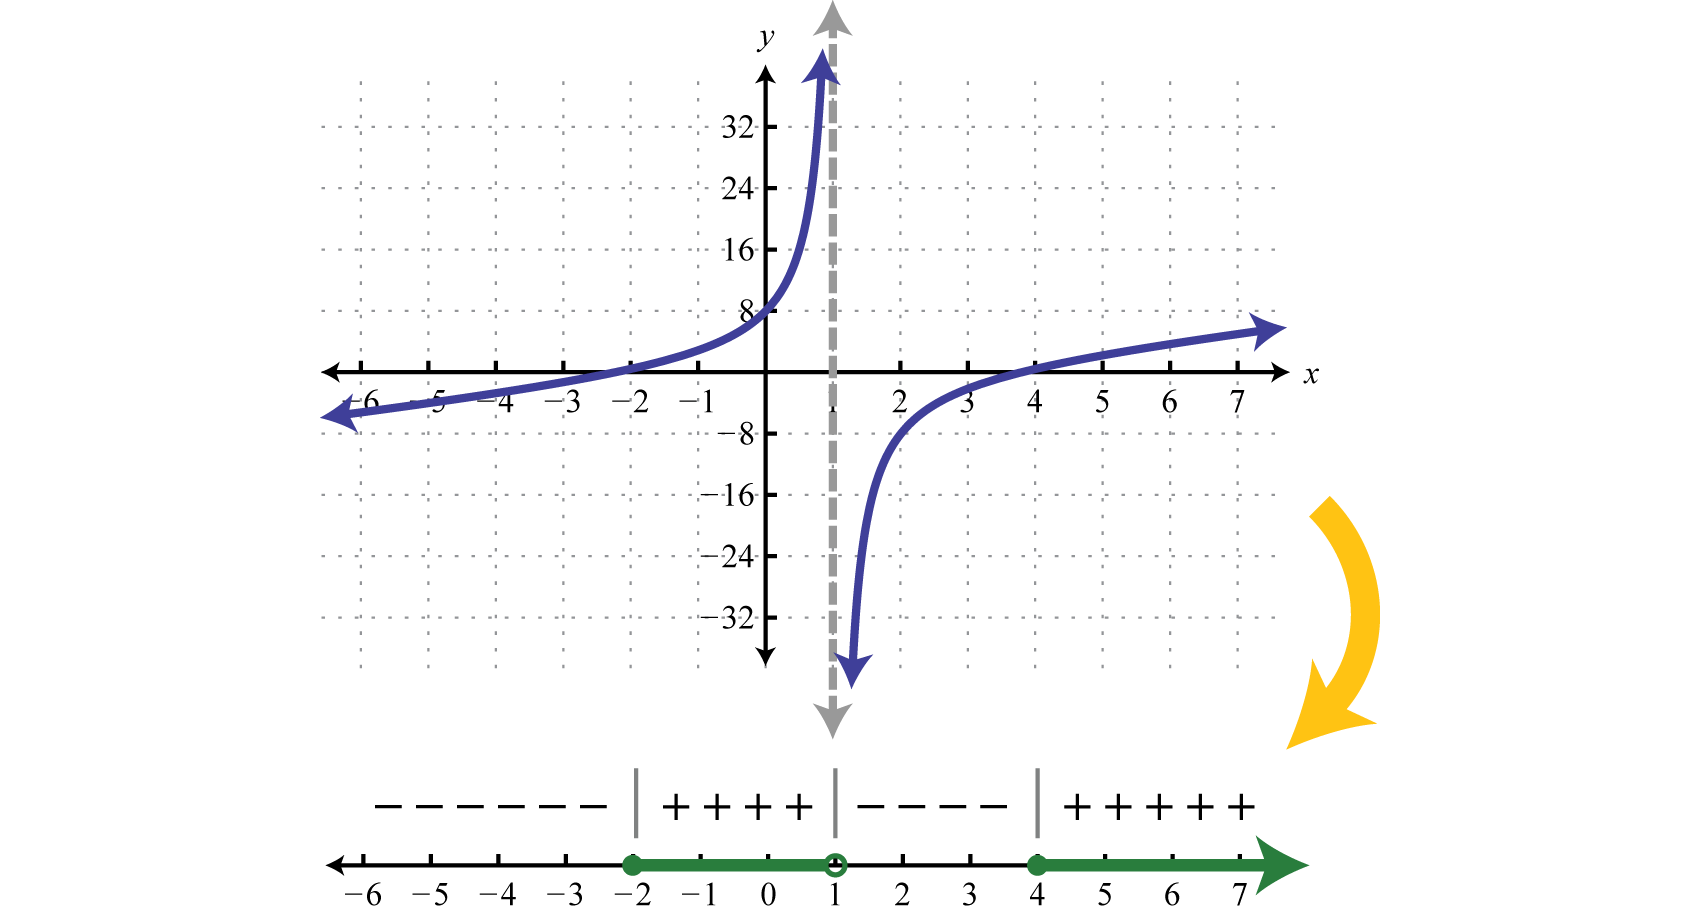
Figure 3.7.14 Rational Function with Sign Chart and Solution Set
Notice that the restriction \(x = 1\) corresponds to a vertical asymptote which bounds regions where the function changes from positive to negative. While not included in the solution set, the restriction is a critical number. Before creating a sign chart we must ensure the inequality has a zero on one side. The general steps for solving a rational inequality are outlined in the following example.
Example \(\PageIndex{5}\)
Solve \(\dfrac{7}{x+3}<2\).
Solution
Step 1: Begin by obtaining zero on the right side.
\(\begin{aligned}\frac{7}{x+3}&<2 \\ \frac{7}{x+3}-2&<0\end{aligned}\)
Step 2: Determine the critical numbers. The critical numbers are the zeros and restrictions. Begin by simplifying to a single algebraic fraction.
\(\begin{aligned}\frac{7}{x+3}-\frac{2}{1}&<0 \\ \frac{7-2(x+3)}{x+3}&<0 \\ \frac{7-2 x-6}{x+3}&<0 \\ \frac{-2 x+1}{x+3}&<0\end{aligned}\)
Next find the critical numbers. Set the numerator and denominator equal to zero and solve.
\(\begin{array}{c|c} {\text{Root}}&{\text{Restriction}}\\ {-2x+1=0}\\{-2x=-1}&{x+3=0}\\{x=\frac{1}{2}}&\quad\quad\:\:{x=-3} \end{array}\)
In this case, the strict inequality indicates that we should use an open dot for the root. Any restriction always uses an open dot.

Step 3: Create a sign chart. Choose test values \(−4, 0\), and \(1\).
\(\begin{aligned} f(\color{OliveGreen}{-4}\color{black}{)} &=\frac{-2(\color{OliveGreen}{-4}\color{black}{)}+1}{\color{OliveGreen}{-4}\color{black}{+}3}&=\frac{+}{-}=-\\ f(\color{OliveGreen}{0}\color{black}{)} &=\frac{-2(\color{OliveGreen}{0}\color{black}{)}+1}{\color{OliveGreen}{0}\color{black}{+}3}&=\frac{+}{+}=+\\ f(\color{OliveGreen}{1}\color{black}{)} &=\frac{-2(\color{OliveGreen}{1}\color{black}{)}+1}{\color{OliveGreen}{1}\color{black}{+}3}&=\frac{-}{+}=-\end{aligned}\)
And we have

Step 4: Use the sign chart to answer the question. In this example we are looking for the values for which the function is negative, \(f (x) < 0\). Shade the appropriate values and then present your answer using interval notation.

Answer:
\((-\infty,-3) \cup\left(\frac{1}{2}, \infty\right)\)
Example \(\PageIndex{6}\)
Solve: \(\dfrac{1}{x^{2}-4} \leq \dfrac{1}{2-x}\).
Solution
Step 1. Begin by obtaining zero on the right side.
\(\begin{aligned}\frac{1}{x^{2}-4} &\leq \frac{1}{2-x} \\ \frac{1}{x^{2}-4}-\frac{1}{2-x} &\leq 0\end{aligned}\)
Step 2. Next simplify the left side to a single algebraic fraction.
\(\begin{array}{r}{\dfrac{1}{x^{2}-4}-\dfrac{1}{2-x} \leq 0} \\ {\dfrac{1}{(x+2)(x-2)}-\dfrac{1}{-(x-2)} \leq 0} \\ {\frac{1}{(x+2)(x-2)}+\frac{1\color{Cerulean}{(x+2)}}{\color{black}{(x-2)}\color{Cerulean}{(x+2)}}\color{black}{ \leq} 0} \\ {\dfrac{1+x+2}{(x+2)(x-2)} \leq 0} \\ \boxed{{f(x) = \dfrac{x+3}{(x+2)(x-2)}} \leq 0}\end{array}\)
The critical numbers are \(−3, −2\), and \(2\). Note that \(±2\) are restrictions and thus we will use open dots when plotting them on a number line. Because of the inclusive inequality we will use a closed dot at the root \(−3\).

Step 3. Choose test values \(-4, -2\frac{1}{2} = -\frac{5}{2}, 0\), and \(3\).
\(\begin{aligned}f(\color{OliveGreen}{-4}\color{black}{)}&= \frac{\color{OliveGreen}{-4}\color{black}{+}3}{(\color{OliveGreen}{-4}\color{black}{+}2)(\color{OliveGreen}{-4}\color{black}{-}2)}&=\frac{(-)}{(-)(-)}=- \\ f(\color{OliveGreen}{-\frac{5}{2}}\color{black}{)} &= \frac{\color{OliveGreen}{-\frac{5}{2}}\color{black}{+}3}{(\color{OliveGreen}{-\frac{5}{2}}\color{black}{+}2)(\color{OliveGreen}{-\frac{5}{2}}\color{black}{-}2)}&=\frac{(+)}{(-)(-)}=+\\ f(\color{OliveGreen}{0}\color{black}{)}&=\frac{\color{OliveGreen}{0}\color{black}{+}3}{(\color{OliveGreen}{0}\color{black}{+}2)(\color{OliveGreen}{0}\color{black}{-}2)}&=\frac{(+)}{(+)(-)}=- \\ f(\color{OliveGreen}{3}\color{black}{)}&=\frac{\color{OliveGreen}{3}\color{black}{+}3}{(\color{OliveGreen}{3}\color{black}{+}2)(\color{OliveGreen}{3}\color{black}{-}2)} &=\frac{(+)}{(+)(+)}=+\end{aligned}\)
Construct a sign chart.

Step 4. Answer the question; in this case, find \(x\) where \(f(x) \leq 0\).

Answer: \((-\infty,-3] \cup(-2,2)\)
![]() \(\PageIndex{3}\)
\(\PageIndex{3}\)
Solve \(\dfrac{2 x^{2}}{2 x^{2}+7 x-4} \geq \dfrac{x}{x+4}\).
- Answer
-
\((-4,0] \cup\left(\frac{1}{2}, \infty\right)\)
Key Takeaways
- When a polynomial inequality is in standard form, with zero on one side, the roots of the polynomial are the critical numbers. Create a sign chart that models the function and then use it to answer the question.
- When a rational inequality is written as a single algebraic fraction, with zero on one side, the roots as well as the restrictions are the critical numbers. The values that produce zero in the numerator are the roots, and the values that produce zero in the denominator are the restrictions. Always use open dots for restrictions, regardless of the given inequality, because restrictions are not part of the domain. Create a sign chart that models the function and then use it to answer the question.