
4.4: Graphs of Logarithmic Functions
- Page ID
- 34905
Learning Objectives
- Graph basic logarithmic functions and transformations of those functions
- Algebraically find the domain and vertical asymptote of a logarithmic function
- Find an equation of a logarithmic function given its graph
In a previous section, it was shown how creating a graphical representation of an exponential model provides some insight in predicting future events. Logarithmic graphs provide similar insight but in reverse because every logarithmic function is the inverse of an exponential function. This section illustrates how logarithm functions can be graphed, and for what values a logarithmic function is defined.
Graphs of Basic Logarithmic Functions
To graph a logarithmic function \(y=log_{b}(x)\), it is easiest to convert the equation to its exponential form, \(x=b^{y}\). Generally, when graphing a function, various \(x\)-values are chosen and each is used to calculate the corresponding \(y\)-value. In contrast, for this method, it is the \(y\)-values that are chosen and the corresponding \(x\)-values that are then calculated.
Example \(\PageIndex{1}\)
|
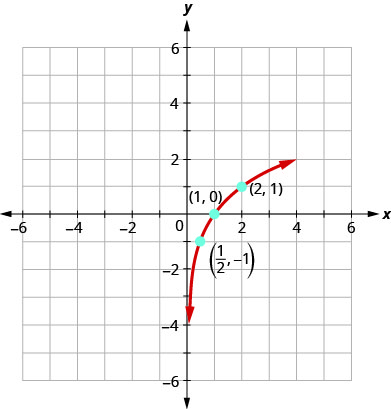
Graph \(y=\log _{2} (x)\). Solution: To graph the function, we will first rewrite the logarithmic equation, \(y=\log _{2} (x)\), in exponential form, \(2^{y}=x\). We will use point plotting to graph the function. It will be easier to start with values of \(y\) and then get \(x\).
|
|
![]() Try It \(\PageIndex{1}\)
Try It \(\PageIndex{1}\)
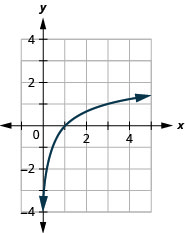
| (a) Graph: \(y=\log _{3} (x)\). |
|
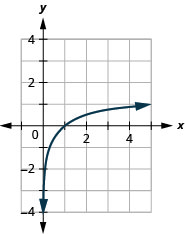
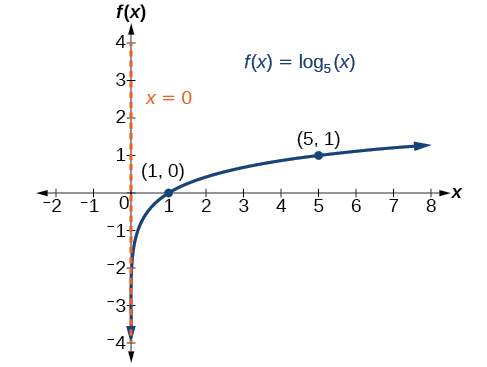
(b) Graph: \(y=\log _{5} (x)\). |
|
The graphs of \(y=\log _{2} (x), y=\log _{3} (x)\), and \(y=\log _{5} (x)\) (all log functions with \(b>1\)), are similar in shape and also:
- All graphs contains the key point \(( {\color{Cerulean}{1}} ,0)\) because \(0=log_{b}( {\color{Cerulean}{1}} ) \) means \(b^{0}=( {\color{Cerulean}{1}})\) which is true for any \(b\).
- All graphs contains the key point \(( {\color{Cerulean}{b}} ,1)\) because \(1=\log _{b} ( {\color{Cerulean}{b}} )\) means \(b^{1}=( {\color{Cerulean}{b}} )\) which is true for any \(b\).
- All graphs contain the key point \(\left( {\color{Cerulean}{\frac{1}{b}}} ,-1\right)\) because \(-1=\log _{b}( {\color{Cerulean}{\frac{1}{b}}} )\) means \(b^{-1}=( {\color{Cerulean}{\frac{1}{b}}} )\), which is true for any \(b\).
- All graphs approach the \(y\)-axis very closely but never touch it. This line \(x=0\), the \(y\)-axis, is a vertical asymptote.
- The graphs never touch the \(y\)-axis so the domain is all positive numbers, written \((0,∞)\) in interval notation.
- All the graphs have the same range - the set of all real numbers, written in interval notation as \((−∞,∞)\).
Our next example looks at the graph of \(y=\log_{b}(x)\) when \(0<b<1\).
Example \(\PageIndex{2}\)
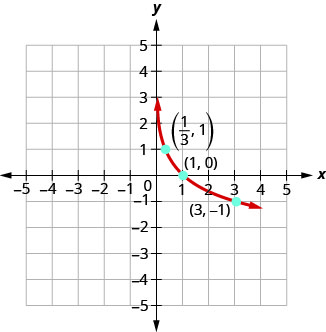
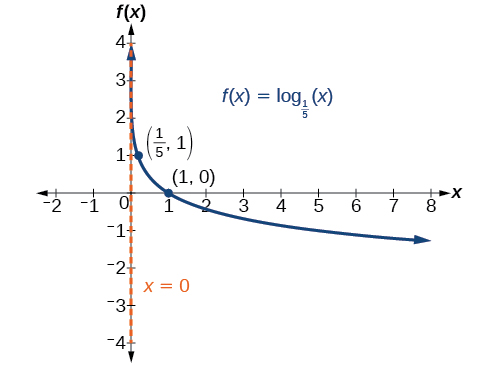
Graph \(y=\log _{\frac{1}{3}} (x)\).Solution:
To graph the function, we will first rewrite the logarithmic equation, \(y=\log _{\frac{1}{3}} (x)\), in exponential form, \(\left(\frac{1}{3}\right)^{y}=x\).We will use point plotting to graph the function. It will be easier to start with values of \(y\) and then get \(x\).
|
 |
![]() Try It \(\PageIndex{2}\)
Try It \(\PageIndex{2}\)
| (a) Graph: \(y=\log _{\frac{1}{2}} (x)\). |
|
(b) Graph: \(y=\log _{\frac{1}{4}} (x)\). |
|
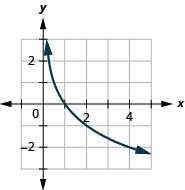
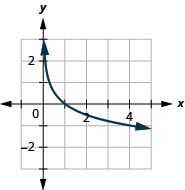
The graphs of \(y=\log _{\frac{1}{2}} (x), y=\log _{\frac{1}{3}} (x)\) and \(y=\log _{\frac{1}{4}} (x)\) are similar.
- The graphs of all have the same basic shape. This is because all the log functions have a fractional base \(0<b<1\).
- All graphs contain the vertical asymptote \(x=0\) and key points \((1,0),\: (b, 1),\: \left(\frac{1}{b},-1\right)\), just like when \(b>1\).
- The domain and range are also the same as when \(b>1\). The domain is \((0,∞)\), the range is \((−∞,∞)\) and the \(y\)-axis is the vertical asymptote.
We summarize these properties in the chart below.
CHARACTERISTICS OF THE GRAPH OF THE PARENT FUNCTION, \(f(x) = log_b(x)\)
For any real number \(x\) and constant \(b>0\), \(b≠1\), we can see the following characteristics in the graph of \(f(x)={\log}_b(x)\):
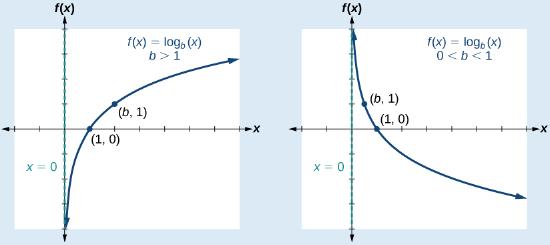 one-to-one function
- vertical asymptote: \(x=0\)
- key points: \(x\)-intercept: \((1,0)\), \((b,1)\) and \( \left(\tfrac{1}{b},-1\right) \)
- \(y\)-intercept: none
- domain: \((0,\infty)\)
- range: \((−\infty,\infty)\)
- increasing if \(b>1\)
- decreasing if \(0<b<1\)
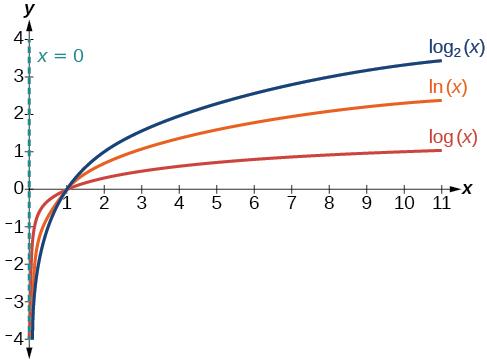 The diagram on the right illustrates the graphs of three logarithmic functions with different bases, all greater than 1. It shows how changing the base \(b\) in \(f(x)={\log}_b(x)\) can affect the graphs. Observe that the graphs compress vertically as the value of the base increases. (Note: recall that the function \(\ln(x)\) has base \(e≈2.718\).)
The family of logarithmic functions includes the parent function \(y={\log}_b(x)\) along with all its transformations: shifts, stretches, compressions, and reflections. When graphing transformations, we always begin with graphing the parent function \(y={\log}_b(x)\). Below is a summary of how to graph parent log functions.
How to: Graph the parent logarithmic function \(f(x)={\log}_b(x)\).
- Graph the landmarks of the logarithmic function
- Draw and label the vertical asymptote, \(x=0\).
- Plot the keypoints: the \(x\)-intercept, \((1,0)\), \((b,1)\), and \( \left( \tfrac{1}{b},-1 \right) \)
- Obtain additional points if they are needed by rewriting \(f(x)=\log_b{x}\) in exponential form as \(b^y=x\). Choose small \(y\) values (like 2, 3 and -1), calculate the corresponding value for \(x\), and plot the point on the graph.
- Draw a smooth curve through the points.
- State the domain, \((0,\infty)\), the range, \((−\infty,\infty)\), and the vertical asymptote, \(x=0\).
![]() Try It \(\PageIndex{3}\)
Try It \(\PageIndex{3}\)
- Answer
-
Landmarks are the vertical asymptote \(x=0\) and
key points \((1,0)\), \((5,1)\), and \( \left(\tfrac{1}{5},-1\right) \).The domain is \((0,\infty)\), the range is \((−\infty,\infty)\),
and the vertical asymptote is \(x=0\).Landmarks are the vertical asymptote \(x=0\) and
key points \((1,0)\), \( \left(\tfrac{1}{5},-1\right) \) and \( (5,1) \).The domain is \((0,\infty)\), the range is \((−\infty,\infty)\),
and the vertical asymptote is \(x=0\).
Graph Transformations of Logarithmic Functions
Transformations of logarithmic graphs behave similarly to those of other parent functions. We can shift, stretch, compress, and reflect the parent function \(y={\log}_b(x)\) without loss of basic shape. The general outline of the process appears below. Then illustrations of each type of transformation are described in detail. Finally, a summary of the steps involved in graphing a function with multiple transformations appears at the end of this section.
![]() How to: Graph a logarithmic function \(f(x)\) using transformations.
How to: Graph a logarithmic function \(f(x)\) using transformations.
- Determine the parent function of \(f(x)\) and graph the parent function \(y={\log}_b(x) \) and its asymptote.
- Identify the transformations on the graph of \(y\) needed to obtain the graph of \(f(x)\).
- Use transformations to graph \(f(x)\) and its asymptote.
Vertical Shifts
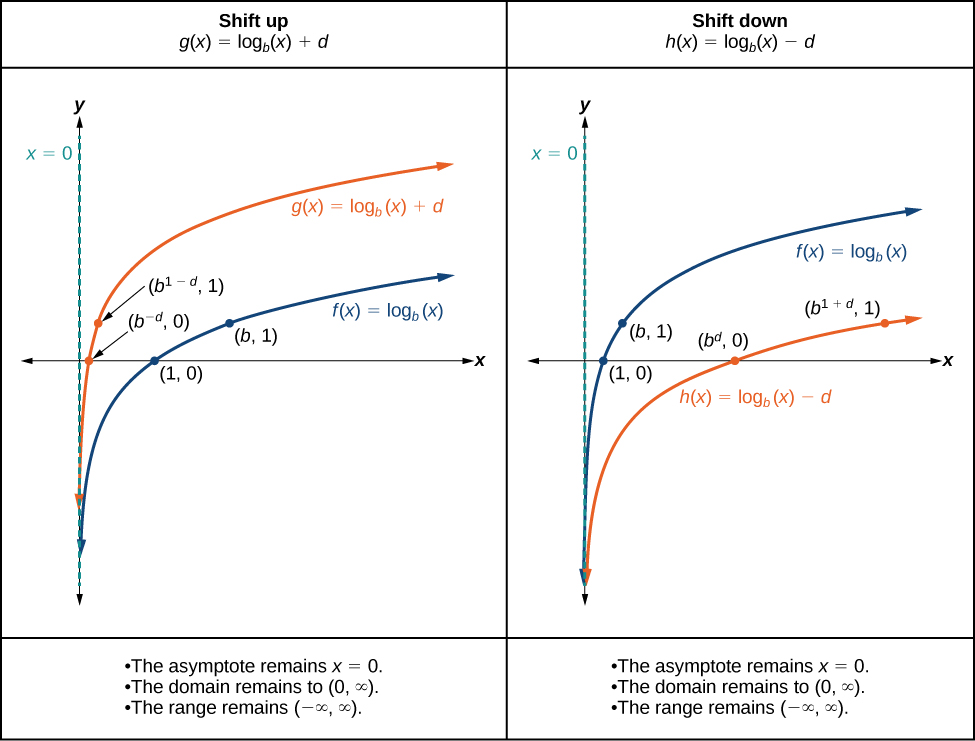
When a constant \(d\) is added to the parent function \(f(x)={\log}_b(x)\), the result is a vertical shift \(d\) units in the direction of the sign on \(d\). To visualize vertical shifts, we can observe the general graph of the parent function \(f(x)={\log}_b(x)\) alongside the shift up, \(g(x)={\log}_b(x)+d\) and the shift down, \(h(x)={\log}_b(x)−d\).
VERTICAL SHIFTS OF THE PARENT FUNCTION \(y = \log_b(x)\)
For any constant \(d\), the function \(f(x)={\log}_b(x)+d\)
- shifts the parent function \(y={\log}_b(x)\) up \(d\) units if \(d>0\).
- shifts the parent function \(y={\log}_b(x)\) down \(d\) units if \(d<0\).
The new \(y\) coordinates are equal to \(y + d\).
Example \(\PageIndex{4}\): Graph a Vertical Shift of the Parent Function \(y = \log_b(x)\)
Sketch a graph of \(f(x)={\log}_3(x)−2\) alongside its parent function. Include the key points and asymptote on the graph. State the domain, range, and asymptote.
Solution
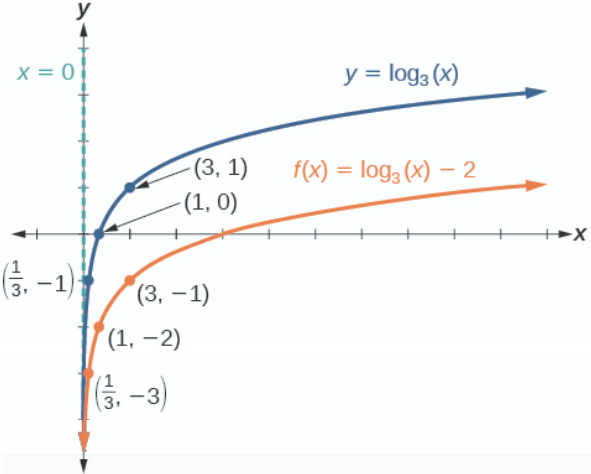 Step 1. Graph the parent function \(y ={\log}_3(x)\). Landmarks are: vertical asymptote \(x=0\), and key points: \(x\)-intercept \((1,0)\), \((3,1)\) and \((\tfrac{1}{3}, -1)\). Additional points using \(3^y=x\) are \((9,2)\) and \( (27,3) \).
Step 2. Transformation on the graph of \(y\) needed to obtain the graph of \(f(x)\) is: shift down 2 units.
Step 3. Shifting down 2 units means the new \(y\) coordinates are found by subtracting \(2\) from the old \(y\) coordinates. Therefore,
- The vertical asymptote for the translated function \(f\) is still \(x=0\).
- The key points for the translated function \(f\) are \((1,−2)\), \((3,−1)\), and \(\left(\frac{1}{3},−3\right)\). Additional points are \( 9, 0)\) and \( 27,1) \).
The domain is \((0,\infty)\), the range is \((−\infty,\infty)\),and the vertical asymptote is \(x=0\).
![]() Try It \(\PageIndex{4}\)
Try It \(\PageIndex{4}\)
Sketch a graph of \(f(x)={\log}_2(x)+2\) alongside its parent function. Include the key points and asymptote on the graph. State the domain, range, and asymptote.
- Answer
-
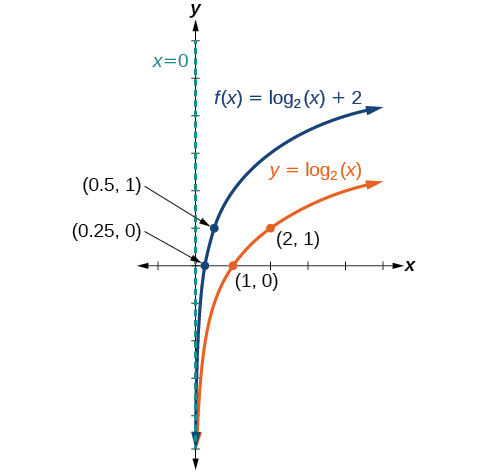
Figure \(\PageIndex{4b}\) A graph of \(f(x)={\log}_2(x)+2\) The domain is \((0,\infty)\), the range is \((−\infty,\infty)\), and the vertical asymptote is \(x=0\).
Horizontal Shifts
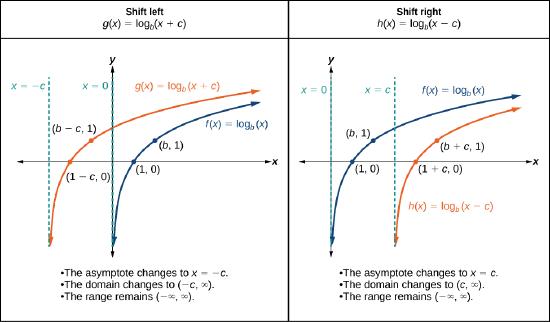
When a constant \(c\) is added to the input of the parent function \(f(x)={\log}_b(x)\), the result is a horizontal shift \(c\) units in the opposite direction of the sign on \(c\). To visualize horizontal shifts, we can observe the general graph of the parent function \(f(x)={\log}_b(x)\) and for \(c>0\) alongside the shift left, \(g(x)={\log}_b(x+c)\), and the shift right, \(h(x)={\log}_b(x−c)\). See Figure \(\PageIndex{5}\).
HORIZONTAL SHIFTS OF THE PARENT FUNCTION \(y = \log_b(x)\)
For any constant \(c\), the function \(f(x)={\log}_b(x+c)\)
- shifts the parent function \(y={\log}_b(x)\) left \(c\) units if \(c>0\).
- shifts the parent function \(y={\log}_b(x)\) right \(c\) units if \(c<0\).
The new \(x\) coordinates are equal to \(x - c\).
Example \(\PageIndex{5}\): Graph a Horizontal Shift of the Parent Function \(y = \log_b(x)\)
Sketch the horizontal shift \(f(x)={\log}_3(x−2)\) alongside its parent function. Include the key points and asymptotes on the graph. State the domain, range, and asymptote.
Solution
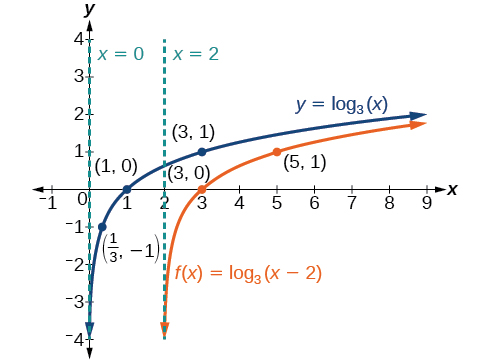 Step 1. Graph the parent function \(y ={\log}_3(x)\). Landmarks are: vertical asymptote \(x=0\), and key points: x-intercept, \((1,0)\), \((3,1)\) and \((\tfrac{1}{3}, -1)\)
Step 2. Transformation on the graph of \(y\) needed to obtain the graph of \(f(x)\) is: shift right 2 units.
Step 3. Shifting right 2 units means the new \(x\) coordinates are found by adding \(2\) to the old \(x\) coordinates. Therefore,
- The vertical asymptote for the translated function \(f\) is \(x=0+2)\) or \(x=2\).
- The key points for the translated function \(f\) are \((3,0)\), \((5,1)\), and \(\left(\frac{7}{3},−1\right)\).
The domain is \((2,\infty)\), the range is \((−\infty,\infty)\),and the vertical asymptote is \(x=2\).
![]() Try It \(\PageIndex{5}\)
Try It \(\PageIndex{5}\)
Sketch a graph of \(f(x)={\log}_3(x+4)\) alongside its parent function. Include the key points and asymptotes on the graph. State the domain, range, and asymptote.
- Answer
-
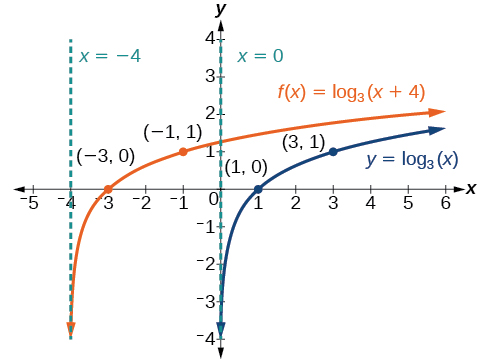
Figure \(\PageIndex{5b}\) A graph of \(f(x)={\log}_3(x+4)\) The domain is \((−4,\infty)\), the range \((−\infty,\infty)\), and the asymptote \(x=–4\).
Reflections
When the parent function \(f(x)={\log}_b(x)\) is multiplied by \(−1\),the result is a reflection about the \(x\)-axis. When the input is multiplied by \(−1\), the result is a reflection about the \(y\)-axis. To visualize reflections, we restrict \(b>1\), and observe the general graph of the parent function \(f(x)={\log}_b(x)\) alongside the reflection about the \(x\)-axis, \(g(x)=−{\log}_b(x)\) and the reflection about the \(y\)-axis, \(h(x)={\log}_b(−x)\).
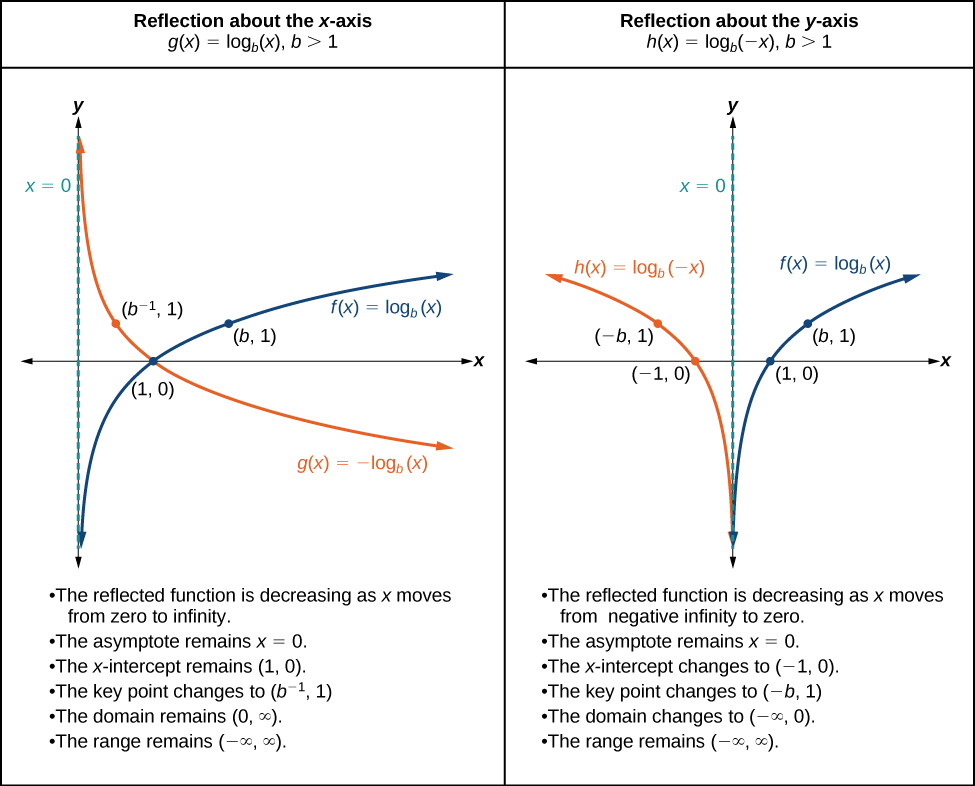
REFLECTIONS OF THE PARENT FUNCTION \(y = log_b(x)\)
\(f(x)=−{\log}_b(x) \;\;\; \)reflects the parent function about the \(x\)-axis. Domain, range and vertical asymptote are unchanged.
\(f(x)={\log}_b(−x) \;\;\; \)reflects the parent function about the \(y\)-axis. Domain is changed.
Example \(\PageIndex{6}\): Graphing a Reflection of a Logarithmic Function
Sketch a graph of \(f(x)=\log(−x)\) alongside its parent function. Include the key points and asymptote on the graph. State the domain, range, and asymptote.
Solution
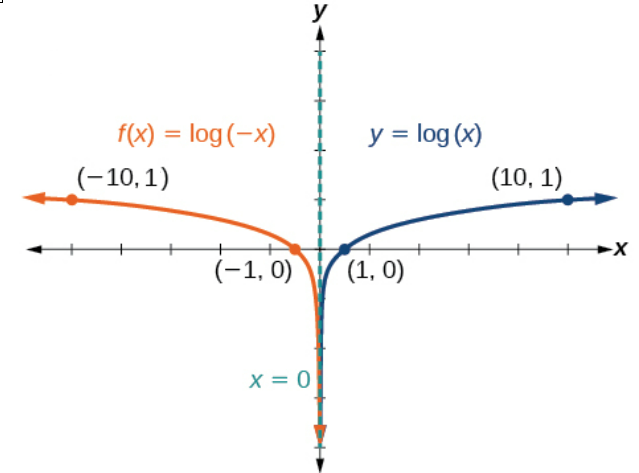 Step 1. Graph the parent function \(y ={\log}(x)\). Landmarks are: vertical asymptote \(x=0\), and key points: \(\left(\frac{1}{10},−1\right)\), \((1,0)\), and \((10,1)\).
Step 2. Transformation on the graph of \(y\) needed to obtain the graph of \(f(x)\) is: reflection of the parent graph about the \(y\)-axis.
Step 3. The reflection about the \(y\)-axis is accomplished by multiplying all the \(x\)-coordinates by −1. Therefore,
- The vertical asymptote for the translated function \(f\) remains \(x=0\).
- The key points for the translated function \(f\) are \(\left(-\frac{1}{10},−1\right)\), \((-1,0)\), and \((-10,1)\).
The domain is \((−\infty,0)\), the range is \((−\infty,\infty)\), and the vertical asymptote is \(x=0\).
![]() Try It \(\PageIndex{6}\)
Try It \(\PageIndex{6}\)
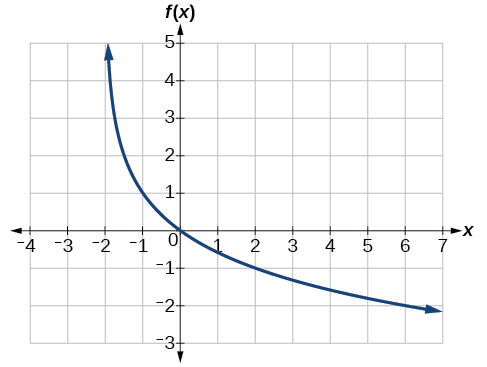
Graph \(f(x)=−\log(−x)\). State the domain, range, and asymptote.
- Answer
-
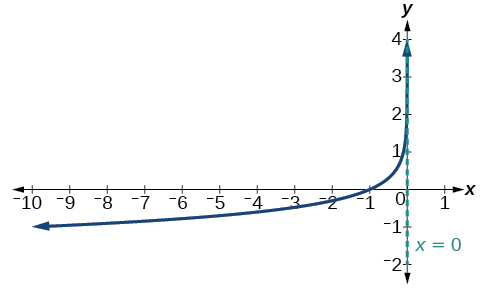
Figure \(\PageIndex{6b}\) Graph of \(f(x)=−\log(−x)\). The domain is \((−\infty,0)\), the range is \((−\infty,\infty)\), and the vertical asymptote is \(x=0\).
Vertical Stretches and Compressions
When the parent function \(f(x)={\log}_b(x)\) is multiplied by a constant \(a>0\), the result is a vertical stretch or compression of the original graph. To visualize stretches and compressions, we set \(a>1\) and observe the general graph of the parent function \(f(x)={\log}_b(x)\) alongside the vertical stretch, \(g(x)=a{\log}_b(x)\) and the vertical compression, \(h(x)=\dfrac{1}{a}{\log}_b(x)\).
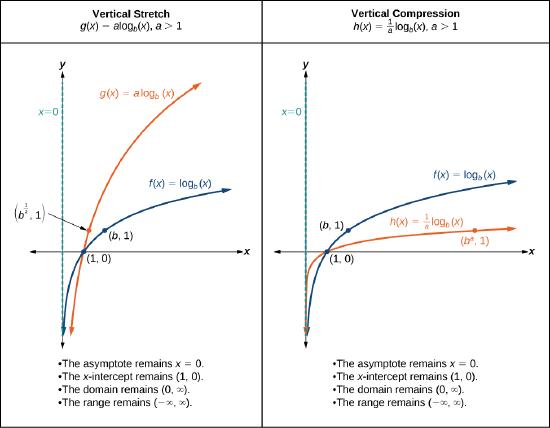
VERTICAL STRETCHES AND COMPRESSIONS OF THE PARENT FUNCTION \(y = log_b(x)\)
For any constant \(a \ne 0\), the function \(f(x)=a{\log}_b(x)\)
- stretches the parent function \(y={\log}_b(x)\) vertically by a factor of \(a\) if \(|a|>1\).
- compresses the parent function \(y={\log}_b(x)\) vertically by a factor of \(a\) if \(0<|a|<1\).
The new \(y\) coordinates are equal to \( ay \). (This would also include vertical reflection if present).
Example \(\PageIndex{7}\): Graph a Stretch or Compression of the Parent Function \(y = log_b(x)\)
Sketch a graph of \(f(x)=2{\log}_4(x)\) alongside its parent function. Include the key points and asymptote on the graph. State the domain, range, and asymptote.
Solution
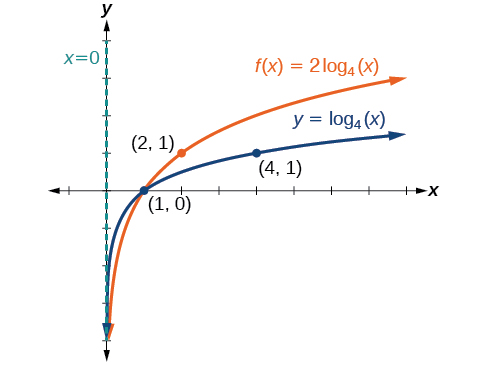 Step 1. Graph the parent function \(y ={\log}_4(x)\). Landmarks are: vertical asymptote \(x=0\), and key points: \(\left(\frac{1}{4},−1\right)\), \((1,0)\), and \((4,1)\).
Step 2. Transformation on the graph of \(y\) needed to obtain the graph of \(f(x)\) is: stretch the function \(f(x)={\log}_4(x)\) by a factor of \(2\).
Step 3. A vertical stretch by a factor of \(2\) means the new \(y\) coordinates are found by multiplying the \(y\) coordinates by \(2\). Therefore,
- The vertical asymptote for the translated function \(f\) is still \(x=0\).
- The key points for the translated function \(f\) are \(\left(\frac{1}{4},−2\right)\), \((1,0)\), and \((4,2)\).
The domain is \((0, \infty)\), the range is \((−\infty, \infty)\), and the vertical asymptote is \(x=0\).
![]() Try It \(\PageIndex{7}\)
Try It \(\PageIndex{7}\)
Sketch a graph of \(f(x)=\dfrac{1}{2}{\log}_4(x)\) alongside its parent function. Include the key points and asymptote on the graph. State the domain, range, and asymptote.
- Answer
-
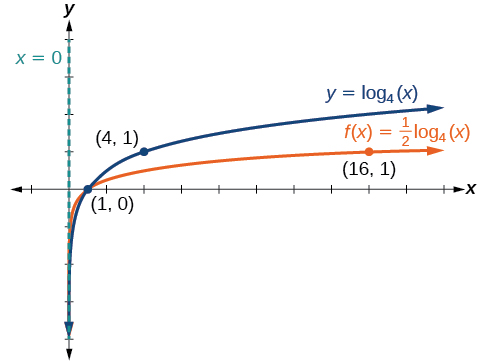
Figure \(\PageIndex{7b}\) A graph of \(f(x)=\dfrac{1}{2}{\log}_4(x)\) The domain is \((0,\infty)\), the range is \((−\infty,\infty),\) and the vertical asymptote is \(x=0\).
Horizontal Stretches and Compressions
When the input of the parent function \(f(x)={\log}_b(x)\) is multiplied by \(m\), the result is a stretch or compression of the original graph. To visualize horizontal stretches and compressions, compare the graph of the parent function \(f(x)={\log}_b(x)\) with the graph of \(g(x)={\log}_b(mx)\). If \( f(p) = {\log}_b(p) = q\), then in order to obtain the same \(y\) value for \(g\), the argument in \(g\) must be equal to that of \(f\). Therefore, the argument on \(g\) must be \(\frac{p}{m} \) because then \(g(\frac{p}{m} ={\log}_b(m \frac{p}{m} ) = {\log}_b(p) = q\). Thus in order for \(g\) to have the same output value as \(f\), the input to \(g\) must be the original input value to \(f\), multiplied by the factor \( \frac{1}{m}\) .
VERTICAL STRETCHES AND COMPRESSIONS OF THE PARENT FUNCTION \(y = log_b(x)\)
For any constant \(m \ne 0\), the function \(f(x)={\log}_b(mx)\)
- compresses the parent function \(y={\log}_b(x)\) vertically by a factor of \( \frac{1}{m}\) if \(|m|>1\).
- stretches the parent function \(y={\log}_b(x)\) vertically by a factor of \( \frac{1}{m}\) if \(0<|m|<1\).
The new \(x\) coordinates are equal to \( \frac{1}{m} x \). (This would also include horizontal reflection if present).
Example \(\PageIndex{8}\): Graph a Stretch or Compression of the Parent Function \(y = log_b(x)\)
Sketch a graph of \(f(x)={\log}_2(4x)\) alongside its parent function. Include the key points and asymptote on the graph. State the domain, range, and asymptote.
Solution
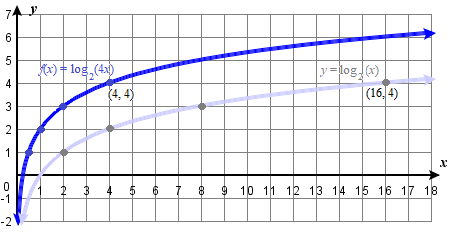 Step 1. Graph the parent function \(y ={\log}_2(x)\). Landmarks are: vertical asymptote \(x=0\), and key points: \((1,0)\), \((4,2)\), and \((16,4)\).
Step 2. Transformation on the graph of \(y\) needed to obtain the graph of \(f(x)\) is: horizontally shrink the function \(f(x)={\log}_2(x)\) by a factor of \(\frac{1}{4}\).
Step 3. A vertical stretch by a factor of \(\frac{1}{4}\) means the new \(x\) coordinates are found by multiplying the \(x\) coordinates by \(\frac{1}{4}\). Therefore,
- The vertical asymptote for the translated function \(f\) is still \(x=0\).
- The key points for the translated function \(f\) are \(\left(\frac{1}{4},0 \right)\), \((1,2)\), and \((4,4)\).
The domain is \((0, \infty)\), the range is \((−\infty, \infty)\), and the vertical asymptote is \(x=0\).
![]() Try It \(\PageIndex{8}\)
Try It \(\PageIndex{8}\)
Sketch a graph of \(f(x)={\log}_2(\dfrac{1}{4}x)\) alongside its parent function. Include the key points and asymptote on the graph. State the domain, range, and asymptote.
- Answer
-
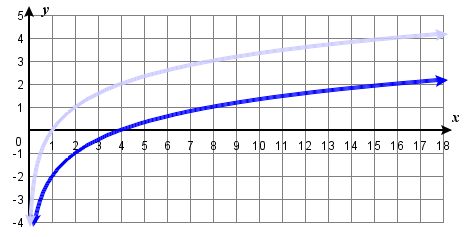
Figure \(\PageIndex{8b}\) A graph of \(f(x)={\log}_2(\dfrac{1}{4}x)\) Transformation: \( x \rightarrow 4x. \) Some key points of graph of \(f\) include \( (4, 0 )\), \((8, 1)\), and \((16, 2)\).
The domain is \((0,\infty)\), the range is \((−\infty,\infty),\) and the vertical asymptote is \(x=0\).
Combine a Horizontal Shift and a Vertical Stretch
Example \(\PageIndex{9}\): Combine a Shift and a Stretch
Sketch a graph of \(f(x)=5{\log}(x+2)\). State the domain, range, and asymptote.
Solution
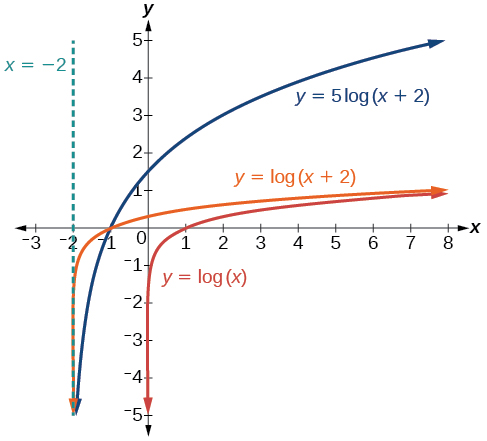 Step 1. Graph the parent function is \(y ={\log}(x)\). Landmarks are: vertical asymptote \(x=0\), and key points: \(\left(\frac{1}{10},−1\right)\), \((1,0)\), and \((10,1)\).
Step 2. Transformations on the graph of \(y\) needed to obtain the graph of \(f(x)\) are: move left \(2\) units (subtract 2 from all the \(x\)-coordinates), then vertically stretch by a factor of \(5\) (multiply all \(y\)-coordinates by 5). (Since these two transformations operate perpendicularly to each other, the order they are done does not matter, but it is a good idea to do all transformations in a prescribed order in order to establish a routine that will always work).
Step 3. 1. \(x \rightarrow x-2\), 2. \(y \rightarrow 5y\). Therefore,
- The vertical asymptote for the translated function \(f\) will be shifted to \(x=−2\).
- The key points for the translated function \(f\) are \(\left( -1\frac{9}{10},−5\right)\), \((-1,0)\), and \((8,5)\).
The domain is \((−2,\infty)\), the range is \((−\infty,\infty)\), and the vertical asymptote is \(x=−2\).
![]() Try It \(\PageIndex{9}\)
Try It \(\PageIndex{9}\)
Sketch a graph of the function \(f(x)=3{\log}(x−2)+1\). State the domain, range, and asymptote.
- Answer
-
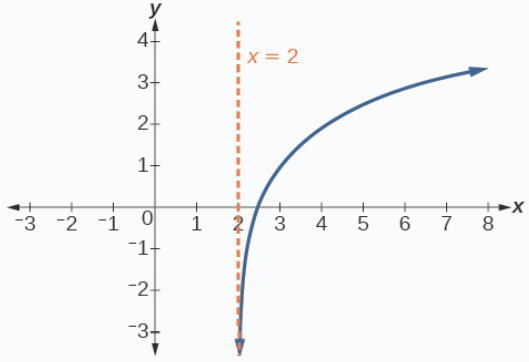 Graph of the function \(f(x)=3{\log}(x−2)+1\) is on the right.
 The domain is \((2,\infty)\), the range is \((−\infty,\infty),\) and the vertical asymptote is \(x=2\).
Summary of Transformations of the Logarithmic Function
Now that we have worked with each type of translation for the logarithmic function, we can summarize how to graph logarithmic functions that have undergone multiple transformations of their parent function.
![]() Graph a logarithmic function using translations
Graph a logarithmic function using translations
Transformations of the parent logarithmic function, \(y={\log}_b(x)\), have the form \(f(x)=a{\log}_b(mx+c)+d\)
- Horizontal transformations must be done in a particular order
- FIRST, shift horizontally to the left \(c\) units if \(c>0\) or to the right if \(c<0\).
- Then, if the coefficient of \(x\) is negative, the graph of the parent function is reflected about the y-axis.
- If \(m \ne 1 \) then the graph if stretched or shrunk horizontally by a factor of \( \frac{1}{m} \).
- If \(p\) is the \(x\)-coordinate of a point on the parent graph, then its new value is \(\frac{(p−c)}{m}\)
- If the function has the form \(f(x)=a{\log}_b(m(x+c))+d\) then do the stretching or reflecting FIRST, and then the horizontal shift.
- Vertical transformations must be done in a particular order
- First, stretching or compression and reflection about the \(x\)-axis is done
- stretched vertically by a factor of \(|a|\) if \(|a|>0\).
- compressed vertically by a factor of \(|a|\) if \(0<|a|<1\).
- reflected about the \(x\)-axis when \(a<0\).
- LAST, shift vertically up \(d\) units if \(d>0\) or down if \(d<0\).
- If \(p\) is the \(y\)-coordinate of a point on the parent graph, then its new value is \(ap+d\)
- First, stretching or compression and reflection about the \(x\)-axis is done
- The range is always \((−\infty,\infty)\)
- If the coefficient of \(x\) was positive, the domain is \((−c, \infty)\), and the vertical asymptote is \(x=−c\).
- If the coefficient of \(x\) was negative, the domain is \((−\infty, c)\), and the vertical asymptote is \(x=c\).
Find the Domain and Asymptote of a Logarithmic Function
Previously, the domain and vertical asymptote were determined by graphing a logarithmic function. It is also possible to determine the domain and vertical asymptote of any logarithmic function algebraically. Here we will take a look at the domain (the set of input values) for which the logarithmic function is defined, and its vertical asymptote.
Recall that the exponential function is defined as \(y=b^x\) for any real number \(x\) and constant \(b>0\), \(b≠1\), where
- The domain of \(y\) is \((−\infty,\infty)\).
- The range of \(y\) is \((0,\infty)\).
In the last section we learned that the logarithmic function \(y={\log}_b(x)\) is the inverse of the exponential function \(y=b^x\). So, as inverse functions:
- The domain of \(y={\log}_b(x)\) is the range of \(y=b^x\): \((0,\infty)\).
- The range of \(y={\log}_b(x)\) is the domain of \(y=b^x\): \((−\infty,\infty)\).
When exponential functions are graphed, certain transformations can change the range of \(y=b^x\). Similarly, applying transformations to the parent function \(y={\log}_b(x)\) can change the domain. When finding the domain of a logarithmic function, therefore, it is important to remember that the domain consists only of positive real numbers. That is, the argument of the logarithmic function must be greater than zero.
For example, consider \(f(x)={\log}_4(2x−3)\). This function is defined for any values of \(x\) such that the argument, in this case \(2x−3\),is greater than zero. To find the domain, we set up an inequality and solve for \(x\):
\[\begin{align*} 2x-3&> 0 &&\qquad \text {Show the argument greater than zero}\\ 2x&> 3 &&\qquad \text{Add 3} \\ x&> 1.5 &&\qquad \text{Divide by 2} \\ \end{align*}\]
In interval notation, the domain of \(f(x)={\log}_4(2x−3)\) is \((1.5,\infty)\).
![]() How to: Given a logarithmic function, identify the domain
How to: Given a logarithmic function, identify the domain
- Set up an inequality showing the argument greater than zero.
- Solve for \(x\).
- Write the domain in interval notation.
The location of the asymptote of a logarithmic equation is always at the boundary of its domain. Therefore the vertical asymptote of a logarithmic function can be obtained by setting its argument to zero and solving for \(x\).
![]() How to: Given a logarithmic function, find the vertical asymptote algebraically
How to: Given a logarithmic function, find the vertical asymptote algebraically
- Set up an inequality showing the argument of the logarithmic function equal to zero.
- Solve for \(x\).
- The result is the equation for the logarithmic function's vertical asymptote.
Example \(\PageIndex{10}\): Identifying the Domain of a Logarithmic Shift
What is the domain of \(f(x)={\log}_2(x+3)\)?
Solution
The logarithmic function is defined only when the input is positive, so this function is defined when \(x+3>0\). Solving this inequality,
\[\begin{align*} x+3&> 0 &&\qquad \text{The input must be positive}\\ x&> -3 &&\qquad \text{Subtract 3} \end{align*}\]
The domain of \(f(x)={\log}_2(x+3)\) is \((−3,\infty)\). The vertical asymptote is \(x = −3 \)
![]() Try It \(\PageIndex{10}\)
Try It \(\PageIndex{10}\)
What is the domain of \(f(x)={\log}_5(x−2)+1\)?
- Answer
-
Domain is \((2,\infty)\). The vertical asymptote is \(x = 2\).
Example \(\PageIndex{11}\): Identifying the Domain of a Logarithmic Shift and Reflection
What is the domain of \(f(x)=\log(5−2x)\)? What is the equation for its vertical asymptote?
Solution
The logarithmic function is defined only when the input is positive, so this function is defined when \(5–2x>0\). Solving this inequality,
\[\begin{align*} 5-2x&> 0 &&\qquad \text{The input must be positive}\\ -2x&> -5 &&\qquad \text{Subtract 5}\\ x&< \dfrac{5}{2} &&\qquad \text{Divide by -2 and switch the inequality} \end{align*}\]
The domain of \(f(x)=\log(5−2x)\) is \(\left(–\infty,\dfrac{5}{2}\right)\). The vertical asymptote is \(x = \dfrac{5}{2} \).
![]() Try It \(\PageIndex{11}\)
Try It \(\PageIndex{11}\)
What is the domain of \(f(x)=\log(x−5)+2\)? What is the equation for its vertical asymptote?
- Answer
-
\((5,\infty)\) The vertical asymptote is \(x = 5\).
Example \(\PageIndex{12}\): Finding the Vertical Asymptote of a Logarithm Graph
What is the vertical asymptote of \(f(x)=−2{\log}_3(x+4)+5\)?
Solution
The vertical asymptote is at \(x=−4\).
Analysis
The coefficient, the base, and the upward translation do not affect the asymptote. The shift of the curve \(4\) units to the left shifts the vertical asymptote to\(x=−4\).
![]() Try It \(\PageIndex{12}\)
Try It \(\PageIndex{12}\)
What is the vertical asymptote of \(f(x)=3+\ln(x−1)\)?
- Answer
-
\(x=1\)
Find the Equation of a Logarithmic Function given its Graph
In the discussion of transformations, a factor that contributes to horizontal stretching or shrinking was included. However, it is always possible to construct an equivalent equation for a transformation of a logarithmic equation that does not have a horizontal stretching of shrinking component to it. Therefore, when constructing an equation that corresponds to a graph, it is safe to assume the general logarithmic equation to be found is of the form \(f(x)=a{\log}_b(x+c)+d\) or \(f(x)=a{\log}_b(-x+c)+d\).
Example \(\PageIndex{13}\): Finding the Equation from a Graph
Find a possible equation for the common logarithmic function graphed below.
Solution
Two slightly different approaches will be givene here. The general form of the common logarithmic function is \( f(x)=a{\log} ( \pm x+c)+d\), or if a base \(B\) logarithm is used instead, the general form would be \( f(x)=a{\log_B} ( \pm x+c)+d\).
This graph has a vertical asymptote at \(x=–2\) and has not been horizontally reflected. Therefore the argument of the logarithmic function must be \( (x+2) \). The graph has been vertically reflected so we know the parameter \(a\) is negative. We do not know yet the vertical shift or the vertical stretch. Thus, so far we know that the equation will have form:
\(f(x)=−a\log(x+2)+d\) or \(f(x)=−a\log_B(x+2)+d\)
Method 1. In this approach, the general form of the function used will be \(f(x)=−a\log_B(x+2)+d\).
Recall that \(\log_B(1) = 0 \). Therefore, when \(x+2=1\) (or when \(x=-1\)), then \(y=d\). From the graph we see that when \(x=-1\), \(y = 1\). Therefore \(d=1\). Now the equation looks like
\(f(x)=−a\log_B(x+2)+1\).
Recall that \(\log_B(B) = 1 \). Therefore, when \(x+2 = B\), \(y = -a+1\). Another point observed to be on the graph is \((2,–1)\). Substituting these values for \(x\) and \(y\) in this pair of equations, we can get values for \(B\) and \(a\): \(2+2 = B\) and \(-1 = -a+1\). Thus \(B=4\) and \(a=2\), and the final form of the equation is obtained:
\(f(x)=-2{\log}_4(x+2)+1\).
Method 2. In this approach, the general form of the function used will be \(f(x)=−a\log(x+2)+d\) instead.
It appears the graph passes through the points \((–1,1)\) and \((2,–1)\). Substituting \((–1,1)\),
\[\begin{align*} 1&= -a\log(-1+2)+d &&\qquad \text{Substitute} (-1,1)\\ 1&= -a\log(1)+d &&\qquad \text{Arithmetic}\\ 1&= d &&\qquad \text{Because }\log(1)= 0 \end{align*}\]
Thus the equation now looks like \(f(x)=−a\log(x+2)+1\). Next, substituting in \((2,–1)\),
\[\begin{align*} -1&= -a\log(2+2)+1 &&\qquad \text{Substitute} (2,-1)\\ -2&= -a\log(4) &&\qquad \text{Arithmetic}\\ a&= \dfrac{2}{\log(4)} &&\qquad \text{Solve for a} \end{align*}\]
Now the equation is \(f(x)=–\dfrac{2}{\log(4)}\log(x+2)+1\). Furthermore, \( \dfrac{\log(x+2)}{\log(4)} = {\log}_4(x+2) \) by The Change of Base Formula, so the equation can be written as \(f(x)=-2{\log}_4(x+2)+1\).
Analysis
We can verify this answer by calculating various values of our \(f(x)\) and comparing with corresponding points on the graph.
| \(x\) | −1 | 0 | 1 | 2 | 3 | 4 | 5 | 6 | 7 | 8 |
|---|---|---|---|---|---|---|---|---|---|---|
| \(f(x)\) | 1 | 0 | −0.58 | −1 | −1.32 | −1.59 | −1.81 | -2 | -2.17 | -2.32 |
![]() Try It \(\PageIndex{13}\)
Try It \(\PageIndex{13}\)
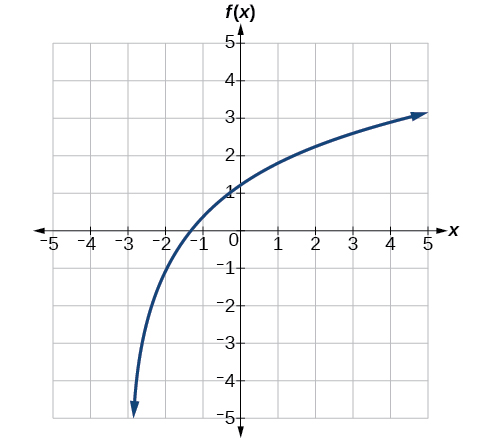
Give the equation of the natural logarithm graphed below.
- Answer
-
\(f(x)=2\ln(x+3)−1\)
Key Equations
General Form for the Transformation of the Parent Logarithmic Function \(f(x)={\log}_b(x) \) is \(f(x)=a{\log}_b( \pm x+c)+d\)
Key Concepts
- Landmarks on the graph of the parent function \(f(x)={\log}_b(x)\) are: vertical asymptote \(x=0\), and keypoints \(x\)-intercept \((1,0)\), \((b,1)\), and \( \left( \tfrac{1}{b},-1 \right) \). Domain is \((0,\infty)\) and range is \((−\infty,\infty)\). The function is increasing if \(b>1\); the function is decreasing if \(0<b<1\).
- The equation \(f(x)={\log}_b(x+c)\) shifts the parent function \(y={\log}_b(x)\) horizontally: left \(c\) units if \(c>0\), right \(c\) units if \(c<0\).
- The equation \(f(x)={\log}_b(x)+d\) shifts the parent function \(y={\log}_b(x)\) vertically: up \(d\) units if \(d>0\), down \(d\) units if \(d<0\).
- For any constant \(a>0\), the equation \(f(x)=a{\log}_b(x)\)
- stretches the parent function \(y={\log}_b(x)\) vertically by a factor of \(a\) if \(|a|>1\).
- compresses the parent function \(y={\log}_b(x)\) vertically by a factor of \(a\) if \(|a|<\)1
- The equation \(f(x)=−{\log}_b(x)\) represents a reflection of the parent function about the x-axis. The equation \(f(x)={\log}_b(−x)\) represents a reflection of the parent function about the y-axis.
- To find the domain of a logarithmic function, set up an inequality showing the argument greater than zero, and solve for \(x\). The vertical asymptote, \(x=v\) is along the border of this domain.
- The general equation \(f(x)=a{\log}_b( \pm x+c)+d\) can be used to write the equation of a logarithmic function given its graph.