
3.4: Slope-Intercept Form of a Line
- Page ID
- 19866

We start with the definition of the \(y\)-intercept of a line.
The \(y\)-intercept
The point \((0,b)\) where the graph of a line crosses the \(y\)-axis is called the \(y\)-intercept of the line.
We will now generate the slope-intercept formula for a line having \(y\)-intercept \((0,b)\) and \(\text {Slope} = m\) (see Figure \(\PageIndex{1}\)). Let \((x,y)\) be an arbitrary point on the line.
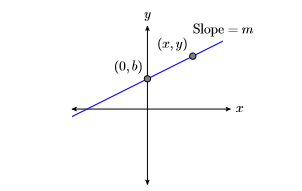
Start with the fact that the slope of the line is the rate at which the dependent variable is changing with respect to the independent variable.
\[\text {Slope} =\dfrac{\Delta y}{\Delta x} \qquad \color{Red} \text {Slope formula.} \nonumber \]
Substitute \(m\) for the slope. To determine both the change in \(y\) and the change in \(x\), subtract the coordinates of the point \((0,b)\) from the point \((x,y)\).
\[\begin{aligned} m&=\frac{y-b}{x-0} \quad \color {Red} \text { Substitute } m \text { for the Slope. } \Delta y =y-b \quad \color {Red} \text { and } \Delta x=x-0 .\\ m&=\frac{y-b}{x} \quad \color {Red}\text { Simplify. } \end{aligned} \nonumber \]
Clear fractions from the equation by multiplying both sides by the common denominator.
\[\begin{aligned} mx &= \left[\dfrac{y-b}{x}\right] x \quad \color {Red} \text { Multiply both sides by } x \\ mx &= y-b \quad \color {Red} \text { Cancel. } \end{aligned} \nonumber \]
Solve for \(y\).
\[\begin{aligned} mx+b&= y-b+b \quad \color {Red} \text { Add } b \text { to both sides. } \\ mx+b&= y \quad \color {Red} \text { Simplify. } \end{aligned} \nonumber \]
Thus, the equation of the line is \(y = mx + b\).
The Slope-Intercept form of a line
The equation of the line having \(y\) intercept \((0,b)\) and slope \(m\) is: \[y = mx + b \nonumber \]Because this form of a line depends on knowing the slope \(m\) and the intercept \((0,b)\), this form is called the slope-intercept form of a line.
Example \(\PageIndex{1}\)
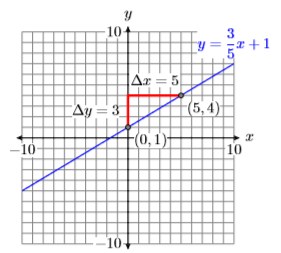
Sketch the graph of the line having equation \(y=\dfrac{3}{5} x+1\).
Solution
Compare the equation \(y=\dfrac{3}{5} x+1\) with the slope-intercept form \(y = mx + b\), and note that \(m =3 /5\) and \(b = 1\). This means that the slope is \(3/5\) and the \(y\)-intercept is \((0,1)\). Start by plotting the \(y\)-intercept \((0,1)\), then move uward \(3\) units and right \(5\) units, arriving at the point \((5,4)\). Draw the line through the points \((0,1)\) and \((5,4)\), then label it with its equation \(y=\dfrac{3}{5} x+1\).
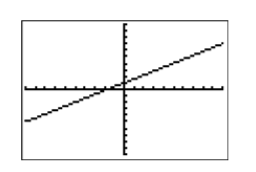
When we compare the calculator image in Figure \(\PageIndex{3}\) with the hand-drawn graph in Figure \(\PageIndex{2}\), we get a better match.
Exercise \(\PageIndex{1}\)
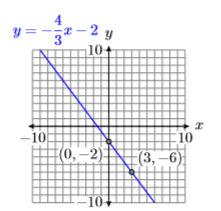
Sketch the graph of the line having equation \(y=-\dfrac{4}{3} x-2\).
- Answer
-
Example \(\PageIndex{2}\)
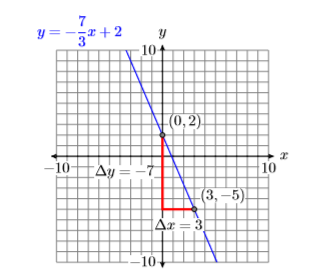
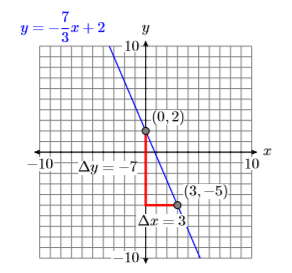
Sketch the line with \(y\)-intercept \((0,2)\) and slope \(−7/3\). Label the line with the slope-intercept form of its equation.
Solution
Plot the \(y\)-intercept \((0,2)\). Now use the slope \(−7/3\). Start at \((0,2)\), then move down seven units, followed by a three unit move to the right to the point \((3,−5)\). Draw the line through the points \((0,2)\) and \((3,−5)\). (See Figure \(\PageIndex{4}\)).
Next, the \(y\)-intercept is \((0,2)\), so \(b = 2\). Further, the slope is \(−7/3\), so \(m = −7/3\). Substitute these numbers into the slope-intercept form of the line.
\[\begin{aligned} y&= mx+b \quad \color {Red} \text { Slope-intercept form. } \\ y&= -\dfrac{7}{3} x+2 \quad \color {Red} \text { Substitute: }-7 / 3 \text { for } m, 2 \text { for } b . \end{aligned} \nonumber \]
Therefore, the slope-intercept form of the line is \(y=-\dfrac{7}{3} x+2\). Label the line with this equation.
Check: To graph \(y=-\dfrac{7}{3} x+2\), enter \(-7 / 3 * X+2\) in Y1 in the Y= menu. Select 6:ZStandard from the ZOOM menu, followed by 5:ZSquare from the ZOOM menu to produce the graph shown in Figure \(\PageIndex{6}\).
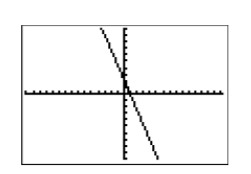
This provides a good match of the hand-drawn graph in Figure \(\PageIndex{5}\) and our graphing calculator result in Figure \(\PageIndex{6}\).
Exercise \(\PageIndex{2}\)
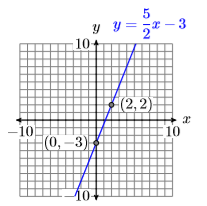
Sketch the line with \(y\)-intercept \((0,−3)\) and slope \(5/2\). Label the line with the slope-intercept form of its equation.
- Answer
-
Example \(\PageIndex{3}\)
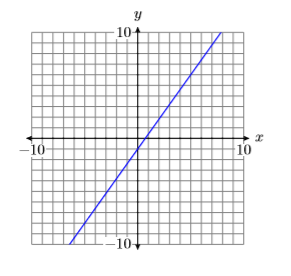
Use the graph of the line in the following figure to find the equation of the line.
Solution
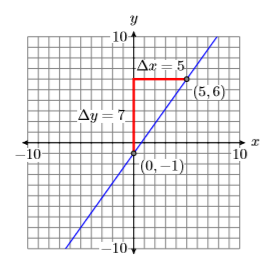
Note that the \(y\)-intercept of the line is \((0,−1)\) (See Figure \(\PageIndex{7}\)). Next, we try to locate a point on the line that passes directly through a lattice point, a point where a vertical and horizontal grid line intersect. In Figure \(\PageIndex{7}\), we chose the point \((5,6)\). Now, starting at the \(y\)-intercept \((0,1)\), we move up \(7\) units, then to the right \(5\) units. Hence, the slope is \(m=\Delta y / \Delta x\), or \(m =7 /5\).
Note
We could also subtract the coordinates of point \((0,−1)\) from the coordinates of point \((5,6)\) to determine the slope. \[\dfrac{6-(-1)}{5-0}=\dfrac{7}{5} \nonumber \]
Next, state the slope-intercept form, the substitute \(7/5\) for \(m\) and \(−1\) for \(b\).
\[\begin{aligned} y&= mx+b \quad \color {Red} \text { Slope-intercept form. } \\ y&= \dfrac{7}{5} x+(-1) \quad \color {Red} \text { Substitute: } 7 / 5 \text { for } m,-1 \text { for } b \end{aligned} \nonumber \]
Thus, the equation of the line is \(y=\dfrac{7}{5} x-1\).
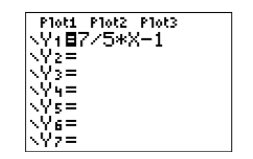
Check: This is an excellent situation to run a check on your graphing calculator.
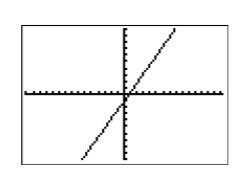
When we compare the result in Figure \(\PageIndex{9}\) with the original hand-drawn graph (see Figure \(\PageIndex{7}\)), we’re confident we have a good match.
Exercise \(\PageIndex{3}\)
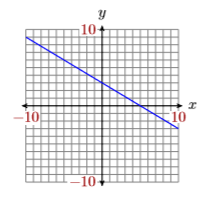
Use the graph of the line in the figure below to find the equation of the line.
- Answer
-
\(y=-\dfrac{3}{5} x+3\)
Applications
Let’s look at a linear application.
Example \(\PageIndex{4}\)
Jason spots his brother Tim talking with friends at the library, located \(300\) feet away. He begins walking towards his brother at a constant rate of \(2\) feet per second (\(2\) ft/s).
- Express the distance \(d\) between Jason and his brother Tim in terms of the time \(t\).
- At what time after Jason begins walking towards Tim are the brothers \(200\) feet apart?
Solution
Because the distance between Jason and his brother is decreasing at a constant rate, the graph of the distance versus time is a line. Let’s begin by making a rough sketch of the line. In Figure \(\PageIndex{10}\), note that we’ve labeled what are normally the \(x\)- and \(y\)-axes with the time \(t\) and distance \(d\), and we’ve included the units with our labels.
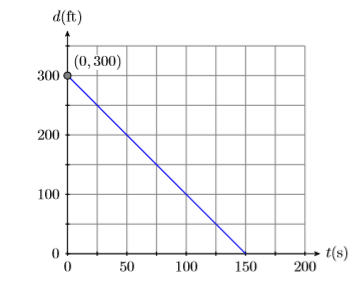
Let \(t = 0\) seconds be the time that Jason begins walking towards his brother Tim. At time \(t = 0\), the initial distance between the brothers is \(300\) feet. This puts the \(d\)-intercept (normally the \(y\)-intercept) at the point \((0,300)\) (see Figure \(\PageIndex{10}\)).
Because Jason is walking toward his brother, the distance between the brothers decreases at a constant rate of \(2\) feet per second. This means the line must slant downhill, making the slope negative, so \(m = −2\) ft/s. We can construct an accurate plot of distance versus time by starting at the point \((0,300)\), then descending \(\Delta d=-300\), then moving to the right \(\Delta t=150\). This makes the slope \(\Delta d / \Delta t=-300 / 150=-2\) (See Figure \(\PageIndex{10}\)). Note that the slope is the rate at which the distance \(d\) between the brothers is changing with respect to time \(t\).
Finally, the equation of the line is \(y = mx + b\), where \(m\) is the slope of the line and \(b\) is the \(y\)-coordinate (in this case the \(d\)-coordinate) of the point where the graph crosses the vertical axis. Thus, substitute \(−2\) for \(m\), and \(300\) for \(b\) in the slope-intercept form of the line.
\[\begin{aligned} y&= mx+b \quad \color {Red} \text { Slope-intercept form. } \\ y&= -2x+300 \quad \color {Red} \text { Substitute: }-2 \text { for } m, 300 \text { for } b \end{aligned} \nonumber \]
One problem remains. The equation \(y = −2x + 300\) gives us \(y\) in terms of \(x\).
- The question required that we express the distance \(d\) in terms of the time \(t\). So, to finish the solution, replace \(y\) with \(d\) and \(x\) with \(t\) (check the axes labels in Figure \(\PageIndex{10}\)) to obtain a solution: \[d=-2t+300 \nonumber \]
- Now that our equation expresses the distance between the brothers in terms of time, let’s answer part (b), “At what time after Jason begins walking towards Tim are the brothers \(200\) feet apart?” To find this time, substitute \(200\) for \(d\) in the equation \(d =−2t + 300\), then solve for \(t\).\[\begin{aligned} d &= -2t+300 \quad \color {Red} \text { Distance equation } \\ 200 &= -2t+300 \quad \color {Red} \text { Substitute } 200 \text { for } d \end{aligned} \nonumber \]Solve this last equation for the time \(t\).\[\begin{aligned} 200-300&= -2t+300-300 \quad \color {Red} \text { Subtract } 300 \text { from both sides. } \\ -100&= -2t \quad \color {Red} \text { Simplify both sides. } \\ \dfrac{-100}{-2}&= \dfrac{-2 t}{-2} \quad \color {Red} \text { Divide both sides by }-2 \\ 50&= t \quad \color {Red} \text { Simplify both sides. } \end{aligned} \nonumber \]Thus, it takes Jason \(50\) seconds to close the distance between the brothers to \(200\) feet.
Exercise \(\PageIndex{4}\)
A swimmer is \(50\) feet from the beach, and then begins swimming away from the beach at a constant rate of \(1.5\) feet per second (\(1.5\) ft/s). Express the distance \(d\) between the swimmer and the beach in terms of the time \(t\).
- Answer
-
\(d=1.5 t+50\)