
10.7: Parametric Equations- Graphs


- Last updated
- Apr 27, 2025
- Save as PDF

( \newcommand{\kernel}{\mathrm{null}\,}\)
- Graph plane curves described by parametric equations by plotting points.
- Graph parametric equations.
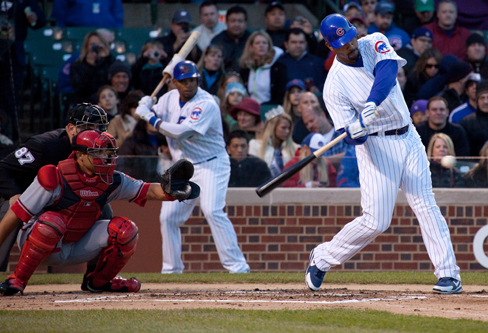
It is the bottom of the ninth inning, with two outs and two men on base. The home team is losing by two runs. The batter swings and hits the baseball at
Graphing Parametric Equations by Plotting Points
In lieu of a graphing calculator or a computer graphing program, plotting points to represent the graph of an equation is the standard method. As long as we are careful in calculating the values, point-plotting is highly dependable.
- Construct a table with three columns:
- Evaluate
- Plot the resulting pairs
Sketch the graph of the parametric equations
Solution
Construct a table of values for
The graph is a parabola with vertex at the point
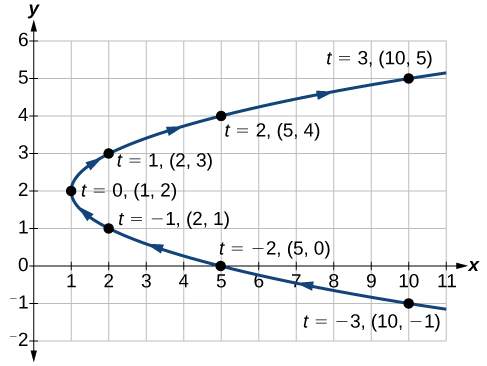
Analysis
As values for
Sketch the graph of the parametric equations
- Answer
-
Figure
Construct a table of values for the given parametric equations and sketch the graph:
Solution
Construct a table like that in Table
Figure
By the symmetry shown in the values of
Analysis
We have seen that parametric equations can be graphed by plotting points. However, a graphing calculator will save some time and reveal nuances in a graph that may be too tedious to discover using only hand calculations. Make sure to change the mode on the calculator to parametric (PAR). To confirm, the
instead of
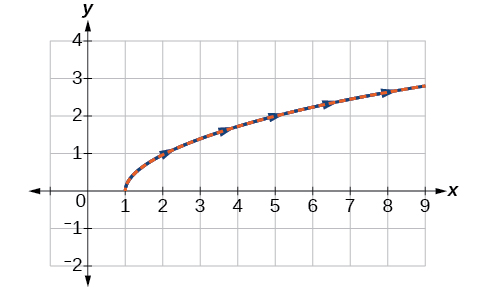
Graph the parametric equations:
- Answer
-
Figure
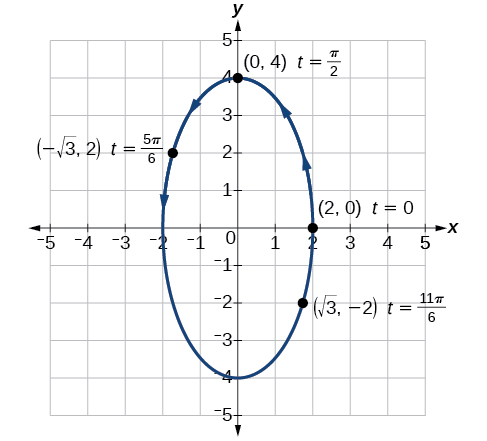
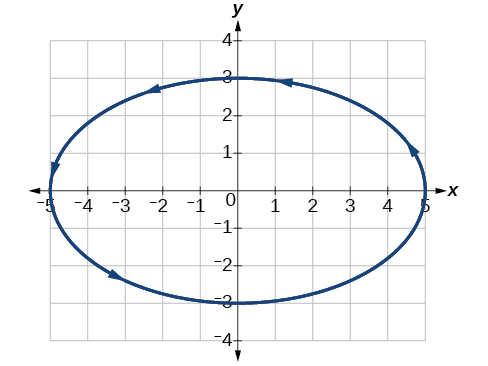
Graph the parametric equations
Solution
Construct a table of values like that in Table
Plot the
Next, translate the parametric equations to rectangular form. To do this, we solve for
Solve for
Solve for
Then, use the Pythagorean Theorem.
Analysis
In Figure
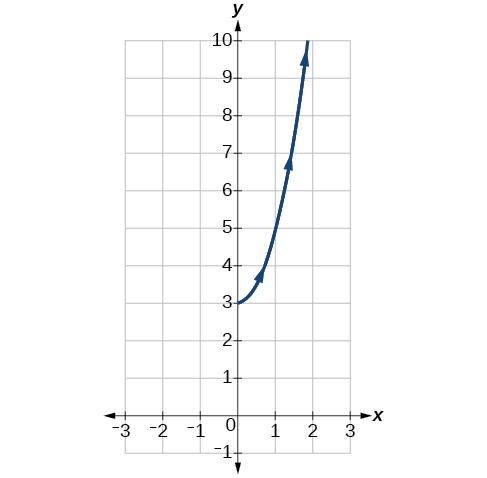
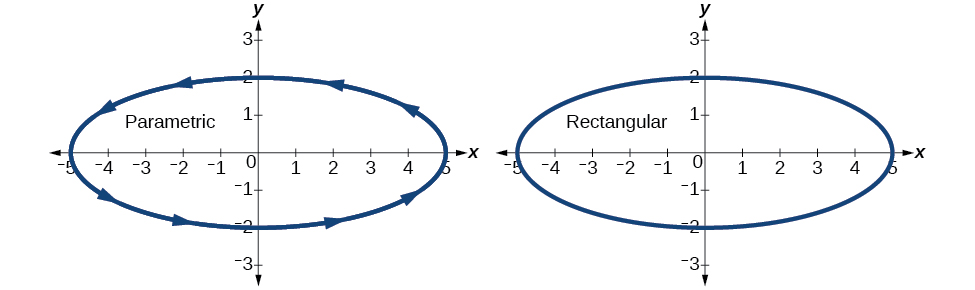
Graph the parametric equations
Solution
Construct a table of values for the parametric equations, as we did in the previous example, and graph
Analysis
With the domain on
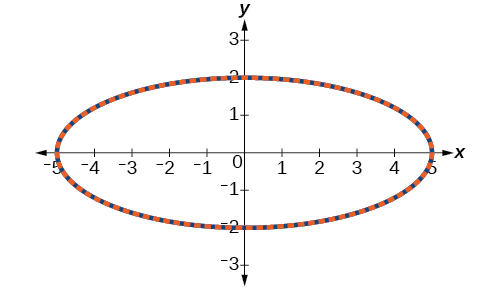
Sketch the graph of the parametric equations
- Answer
-
The graph of the parametric equations is in red and the graph of the rectangular equation is drawn in blue dots on top of the parametric equations.
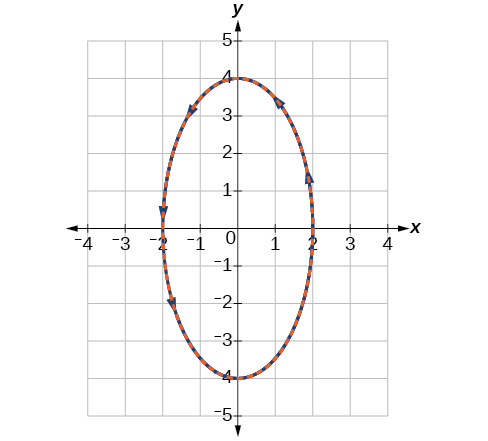
Figure
Applications of Parametric Equations
Many of the advantages of parametric equations become obvious when applied to solving real-world problems. Although rectangular equations in
A common application of parametric equations is solving problems involving projectile motion. In this type of motion, an object is propelled forward in an upward direction forming an angle of
The path of an object propelled at an inclination of
where
- The horizontal distance is given by
- The expression
- The vertical distance is given by the formula
- Proceed by calculating each term to solve for
Solve the problem presented at the beginning of this section. Does the batter hit the game-winning home run? Assume that the ball is hit with an initial velocity of
- Find the parametric equations to model the path of the baseball.
- Where is the ball after
- How long is the ball in the air?
- Is it a home run?
Solution
1. Use the formulas to set up the equations. The horizontal position is found using the parametric equation for
The vertical position is found using the parametric equation for
2. Substitute
After
3. To calculate how long the ball is in the air, we have to find out when it will hit ground, or when
When
4. We cannot confirm that the hit was a home run without considering the size of the outfield, which varies from field to field. However, for simplicity’s sake, let’s assume that the outfield wall is
The ball is

Access the following online resource for additional instruction and practice with graphs of parametric equations.
Key Concepts
- When there is a third variable, a third parameter on which
- To graph parametric equations by plotting points, make a table with three columns labeled
- When graphing a parametric curve by plotting points, note the associated t-values and show arrows on the graph indicating the orientation of the curve. See Example
- Parametric equations allow the direction or the orientation of the curve to be shown on the graph. Equations that are not functions can be graphed and used in many applications involving motion. See Example
- Projectile motion depends on two parametric equations:
Contributors and Attributions
Jay Abramson (Arizona State University) with contributing authors. Textbook content produced by OpenStax College is licensed under a Creative Commons Attribution License 4.0 license. Download for free at https://openstax.org/details/books/precalculus.