
7.3: Logarithmic Functions and Their Graphs


- Last updated
- Oct 6, 2021
- Save as PDF
( \newcommand{\kernel}{\mathrm{null}\,}\)
Learning Objectives
- Define and evaluate logarithms.
- Identify the common and natural logarithm.
- Sketch the graph of logarithmic functions.
Definition of the Logarithm
We begin with the exponential function defined by f(x)=2x and note that it passes the horizontal line test.
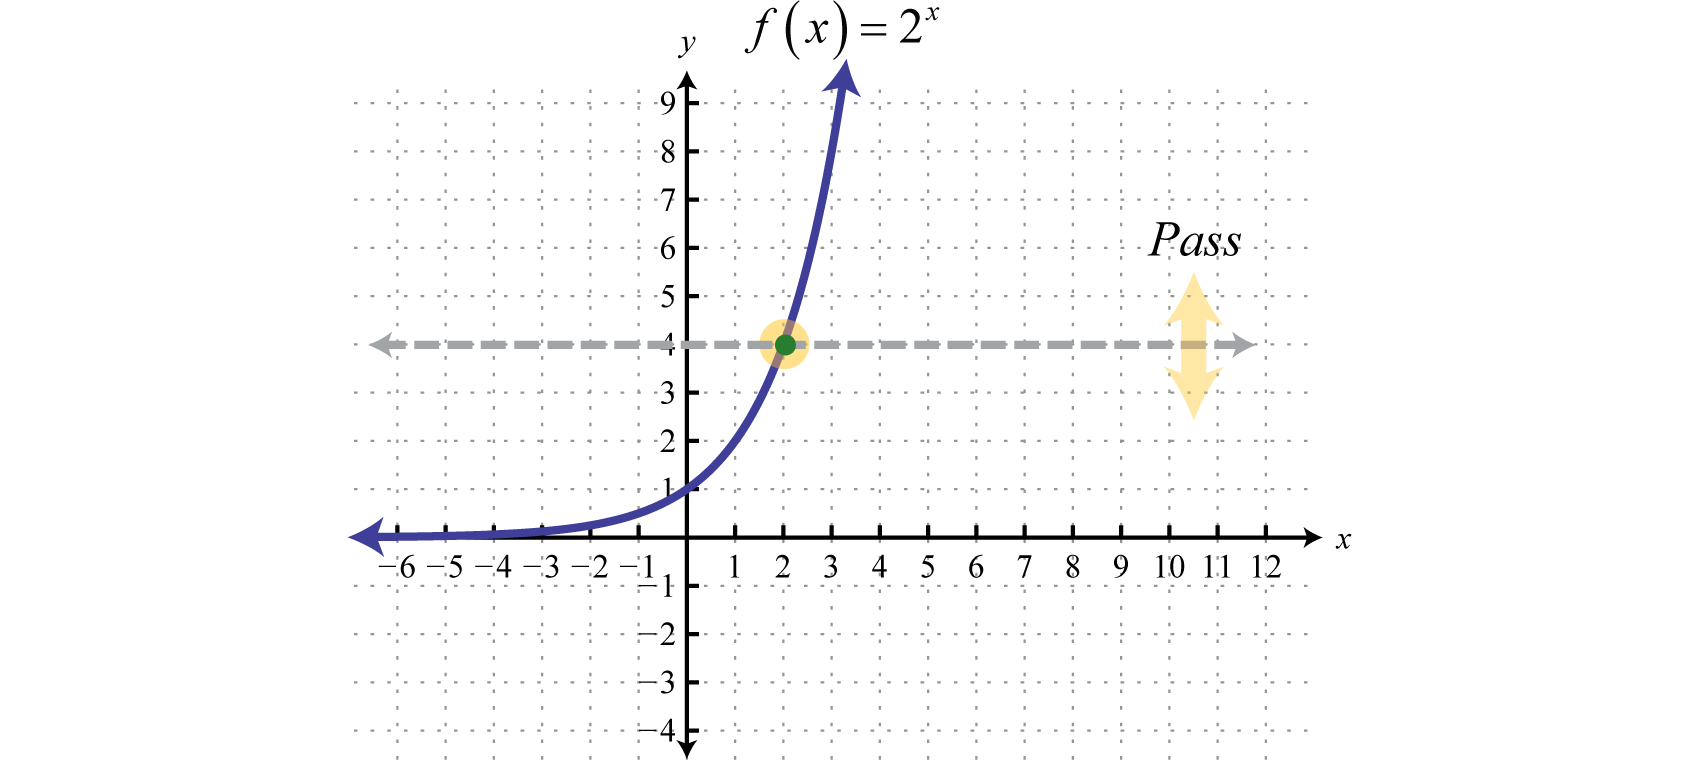
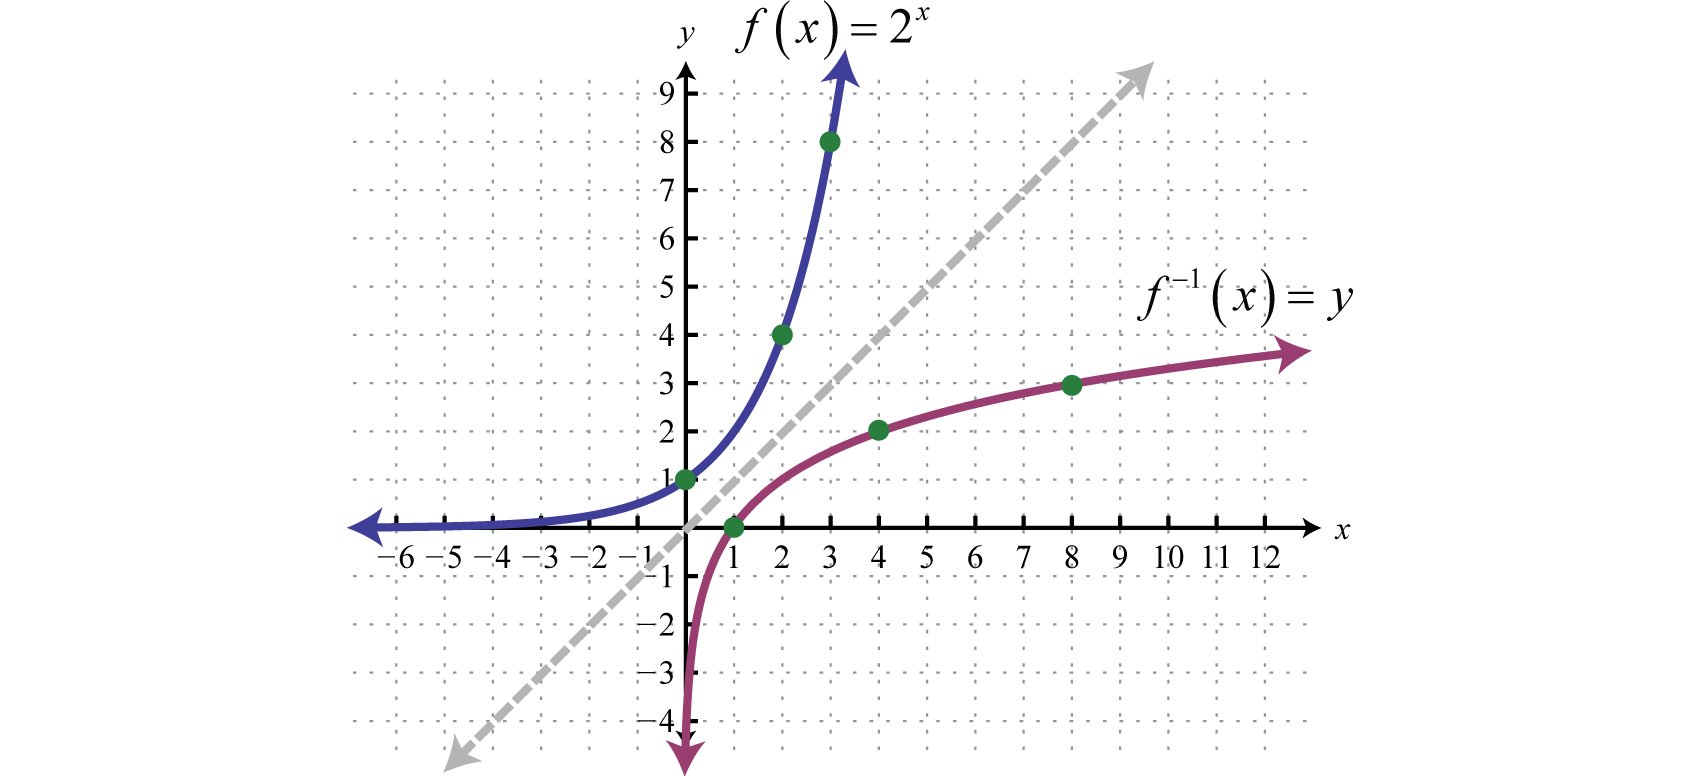
Therefore it is one-to-one and has an inverse. Reflecting y=2x about the line y=x we can sketch the graph of its inverse. Recall that if (x,y) is a point on the graph of a function, then (y,x) will be a point on the graph of its inverse.
To find the inverse algebraically, begin by interchanging x and y and then try to solve for y.
f(x)=2xy=2x⇒x=2y
We quickly realize that there is no method for solving for y. This function seems to “transcend” algebra. Therefore, we define the inverse to be the base-2 logarithm, denoted log2x. The following are equivalent:
y=log2x⇔x=2y
This gives us another transcendental function defined by f−1(x)=log2x, which is the inverse of the exponential function defined by f(x)=2x.
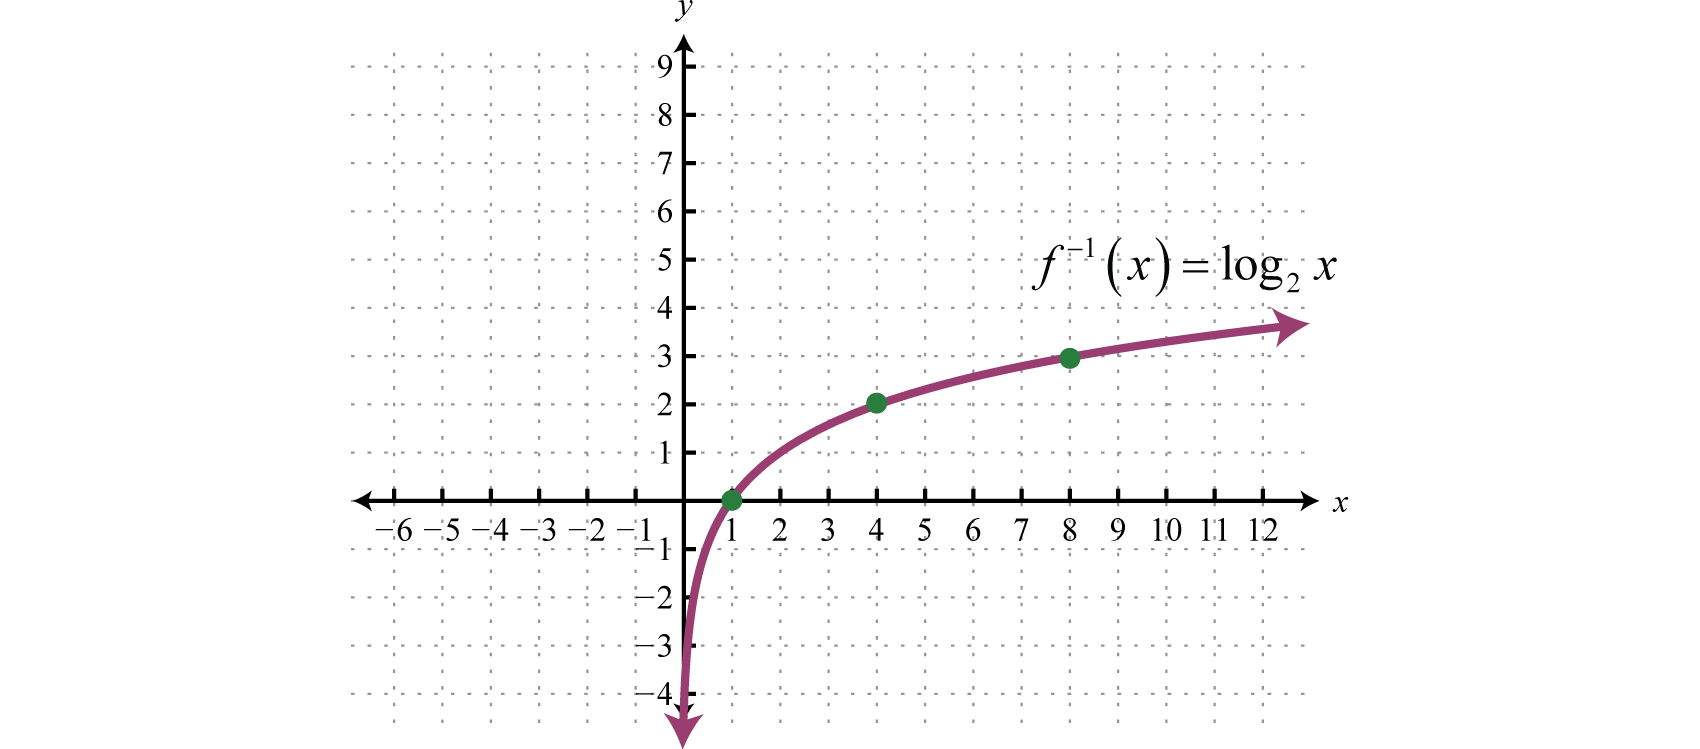
The domain consists of all positive real numbers (0,∞) and the range consists of all real numbers (−∞,∞). John Napier is widely credited for inventing the term logarithm.

In general, given base b>0 where b≠1, the logarithm base b8 is defined as follows:
y=logbxifandonlyifx=by
Use this definition to convert logarithms to exponential form and back.
| Logarithmic Form | Exponential Form |
|---|---|
| log216=4 | 24=16 |
| log525=2 | 52=25 |
| log61=0 | 60=1 |
| log3√3=12 | 31/2=√3 |
| log7(149)=−2 | 7−2=149 |
It is useful to note that the logarithm is actually the exponent y to which the base b is raised to obtain the argument x.

Example 7.3.1
Evaluate:
- log5125
- log2(18)
- log42
- log111
Solution
- log5125=3 because 53=125.
- log2(18)=−3 because 2−3=123=18.
- log42=12 because 41/2=√4=2.
- log111=0 because 110=1
Note that the result of a logarithm can be negative or even zero. However, the argument of a logarithm is not defined for negative numbers or zero:
log2(−4)=?⟹2?=−4log2(0)=?⟹2?=0
There is no power of two that results in −4 or 0. Negative numbers and zero are not in the domain of the logarithm. At this point it may be useful to go back and review all of the rules of exponents.
Example 7.3.2
Find x:
- log7x=2
- log16x=12
- log1/2x=−5
Solution
Convert each to exponential form and then simplify using the rules of exponents.
- log7x=2 is equivalent to 72=x and thus x=49.
- log16x=12 is equivalent to 161/2=x or √16=x and thus x=4.
- log1/2x=−5 is equivalent to (12)−5=x or 25=x and thus x=32,
Exercise 7.3.1
Evaluate: log5(13√5).
- Answer
-
−13
www.youtube.com/v/1Bxv8PY91bw
The Common and Natural Logarithm
A logarithm can have any positive real number, other than 1, as its base. If the base is 10, the logarithm is called the common logarithm9.
f(x)=log10x=logxCommonlogarithm
When a logarithm is written without a base it is assumed to be the common logarithm.
This convention varies with respect to the subject in which it appears. For example, computer scientists often let logx represent the logarithm base 2.
Example 7.3.3:
Evaluate:
- log105
- log√10
- log0.01
Solution
- log105=5 because 105=105.
- log√10=12 because 101/2=√10.
- log0.01=log(1100)=−2 because 10−2=1102=1100=0.01
The result of a logarithm is not always apparent. For example, consider log75.
log10=1log75=?log100=2
We can see that the result of log75 is somewhere between 1 and 2. On most scientific calculators there is a common logarithm button LOG .Use it to find the log75 as follows:
LOG75=1.87506
Therefore, rounded off to the nearest thousandth, log75≈1.875. As a check, we can use a calculator to verify that 10∧1.875≈75.
If the base of a logarithm is e, the logarithm is called the natural logarithm10.
f(x)=logex=lnxNaturallogarithm
The natural logarithm is widely used and is often abbreviated lnx.
Example 7.3.4
Evaluate:
- lne
- ln3√e2
- ln(1e4)
Solution
- lne=1 because lne=logee=1 and e1=e.
- ln(3√e2)=23 because e2/3=3√e2.
- ln(1e4)=−4 because e−4=1e4.
On a calculator you will find a button for the natural logarithm LN.
LN75=4.317488
Therefore, rounded off to the nearest thousandth, ln(75)≈4.317. As a check, we can use a calculator to verify that e∧4.317≈75.
Example 7.3.5
Find x. Round answers to the nearest thousandth.
- logx=3.2
- lnx=−4
- logx=−23
Solution
Convert each to exponential form and then use a calculator to approximate the answer.
- logx=3.2 is equivalent to 103.2=x and thus x≈1584.893.
- lnx=−4 is equivalent to e−4=x and thus x≈0.018.
- logx=−23 is equivalent to 10−2/3=x and thus x≈0.215.
Exercise 7.3.2
Evaluate: ln(1√e)
- Answer
-
−frac12
www.youtube.com/v/fLW7_Zv7QME
Graphing Logarithmic Functions
We can use the translations to graph logarithmic functions. When the base b>1, the graph of f(x)=logbx has the following general shape:
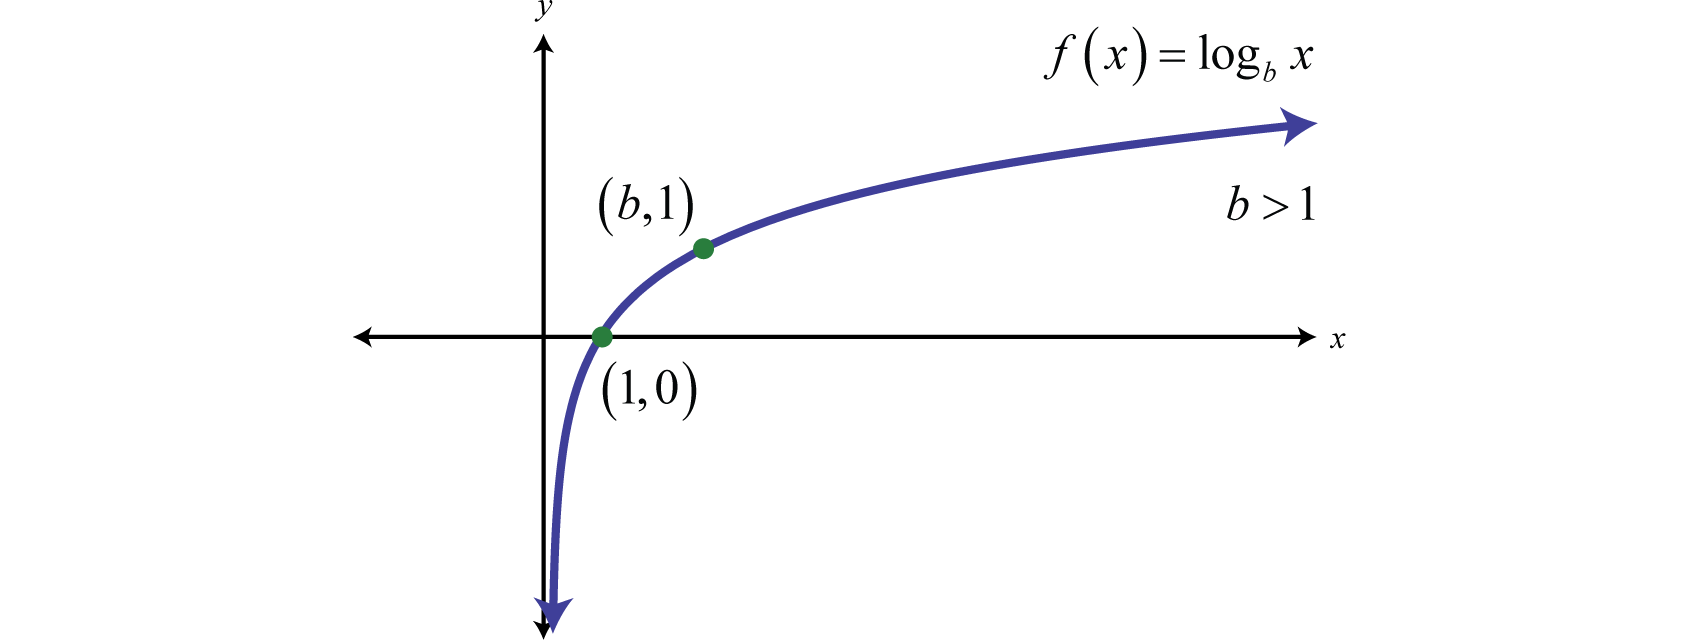
The domain consists of positive real numbers, (0,∞) and the range consists of all real numbers, (−∞,∞). The y-axis, or x=0, is a vertical asymptote and the x-intercept is (1,0). In addition, f(b)=logbb=1 and so (b,1) is a point on the graph no matter what the base is.
Example 7.3.6
Sketch the graph and determine the domain and range: f(x)=log3(x+4)−1.
Solution
Begin by identifying the basic graph and the transformations.
y=log3xBasicgraph.y=log3(x+4)Shiftleft4units.y=log3(x+4)−1Shiftdown1unit.
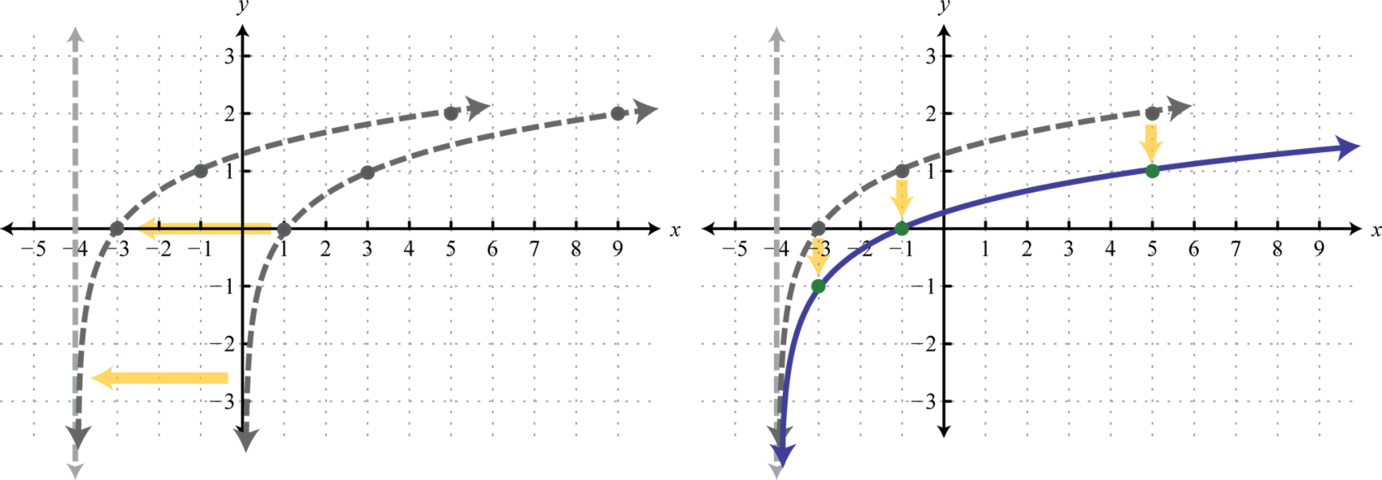
Notice that the asymptote was shifted 4 units to the left as well. This defines the lower bound of the domain. The final graph is presented without the intermediate steps.
Answer:
Domain: (−4,∞); Range: (−∞,∞)
Finding the intercepts of the graph in the previous example is left for a later section in this chapter. For now, we are more concerned with the general shape of logarithmic functions.
Example 7.3.7
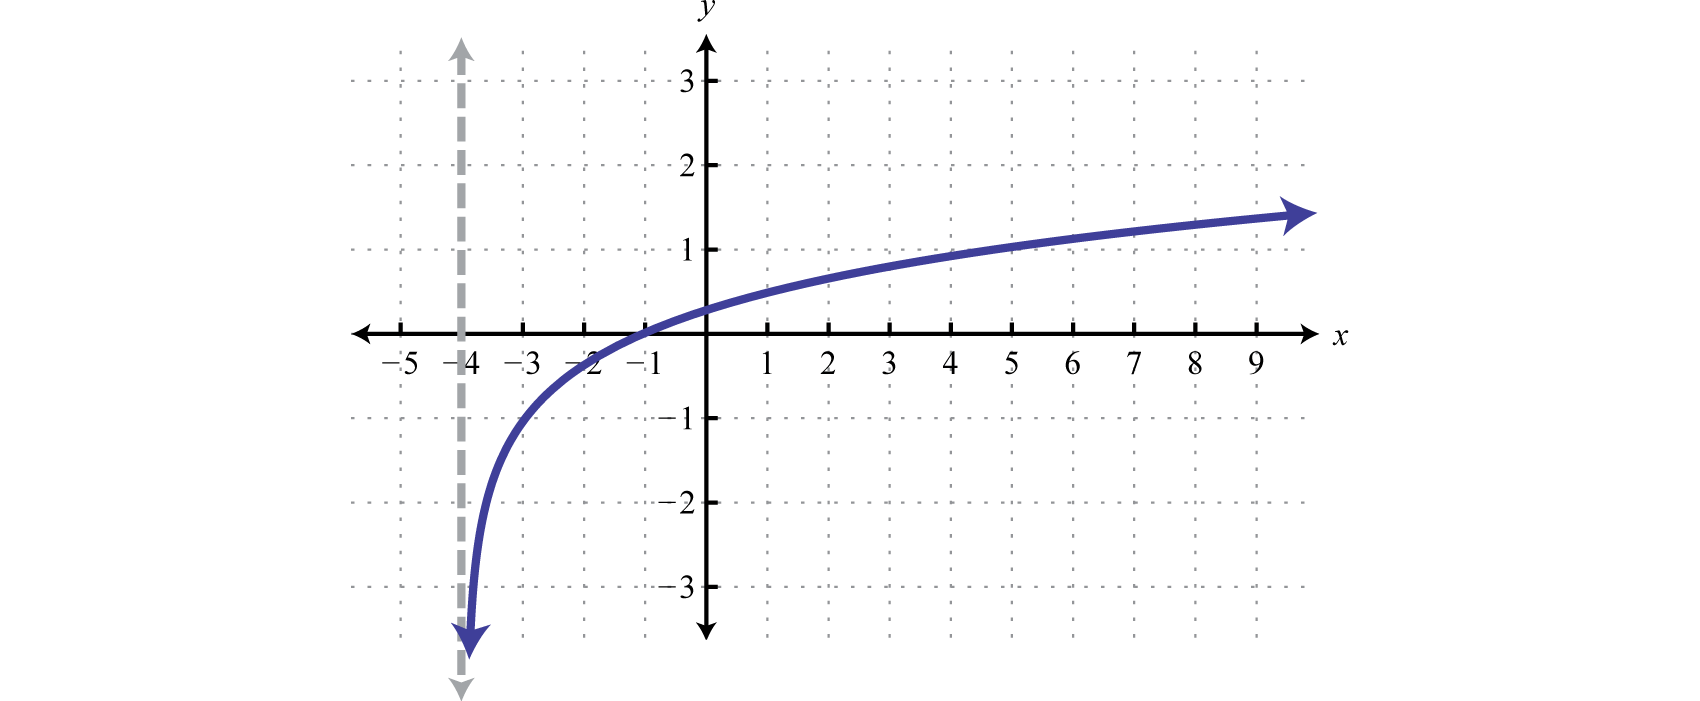
Sketch the graph and determine the domain and range: f(x)=−log(x−2).
Solution
Begin by identifying the basic graph and the transformations.
y=logxBasicgraph.y=−logxReflectionaboutthex−axis.y=−log(x−2)Shiftright2units.
Here the vertical asymptote was shifted two units to the right. This defines the lower bound of the domain.
Answer

Domain: (2,∞); Range: (−∞,∞)
Exercise 7.3.3
Sketch the graph and determine the domain and range: g(x)=ln(−x)+2.
- Answer
-
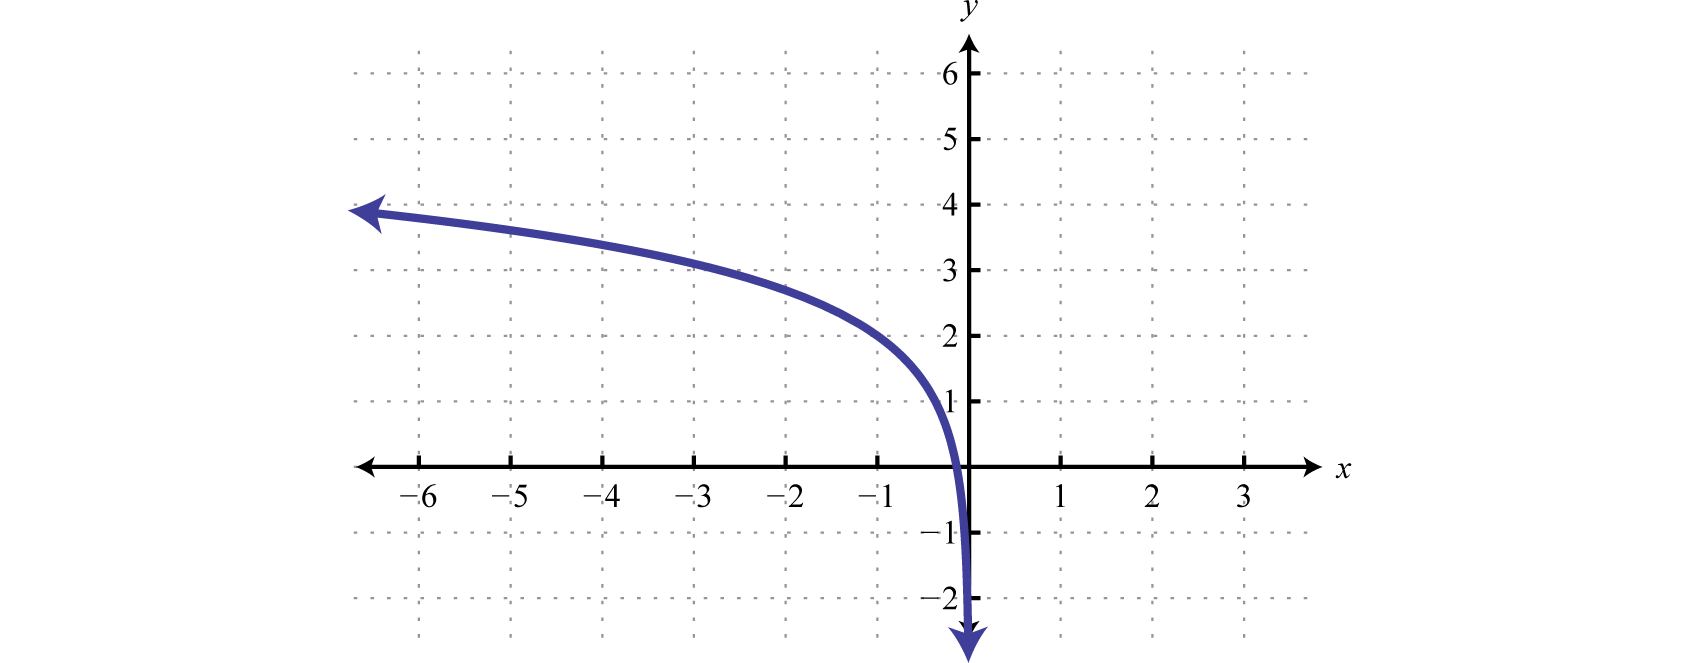
Figure 7.3.11 Domain: (−∞,0); Range: (−∞,∞)
www.youtube.com/v/6obhBJfCDe4
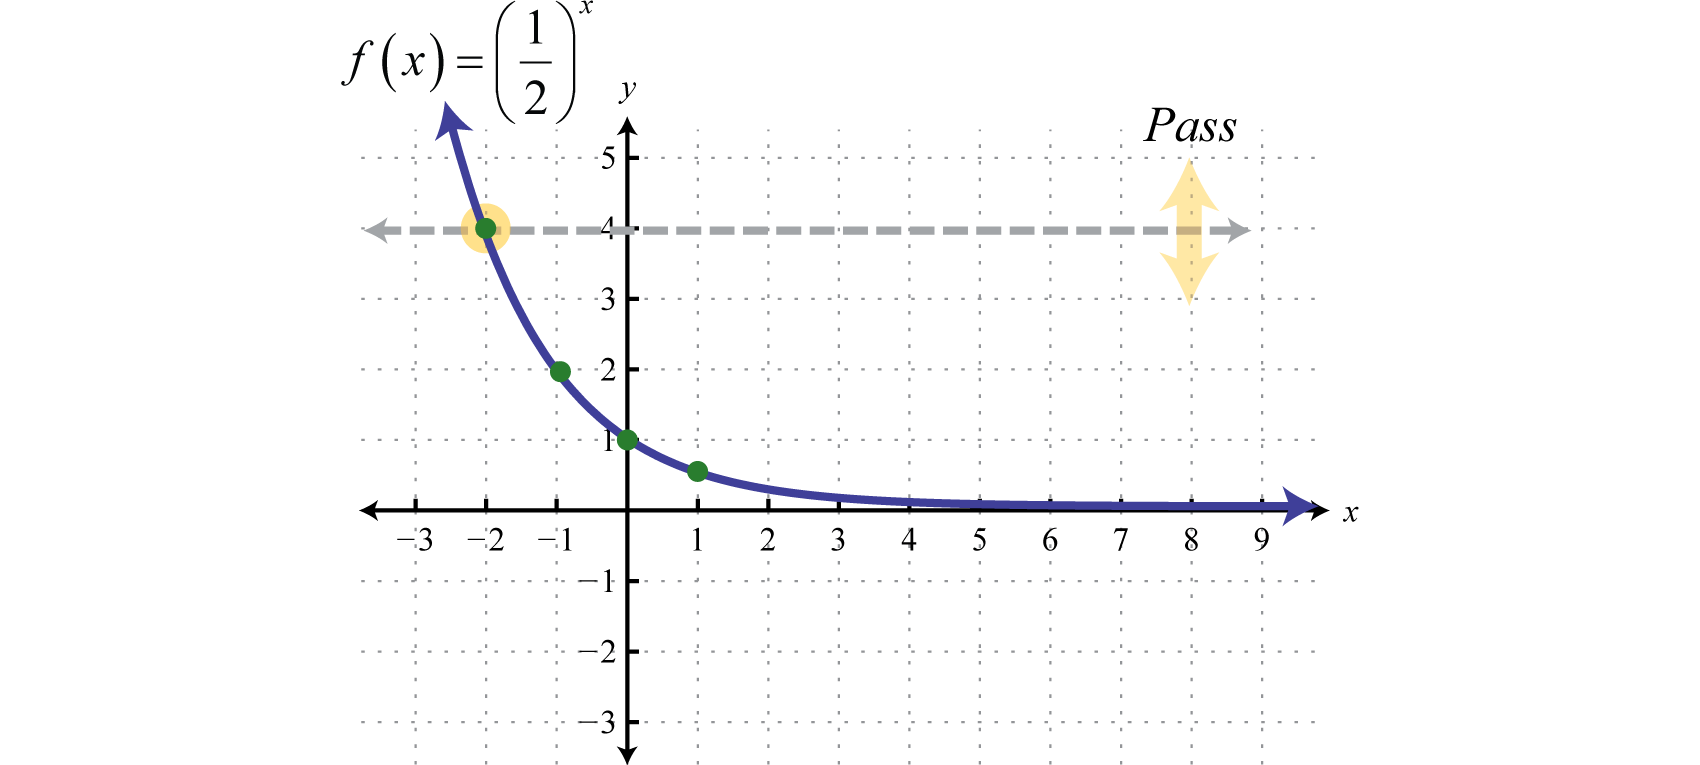
Next, consider exponential functions with fractional bases, such as the function defined by f(x)=(12)x. The domain consists of all real numbers. Choose some values for x and then find the corresponding y-values.
| x | y | Solutions | |
|---|---|---|---|
| −2 | 4 | f(−2)=(12)−2=22=4 | (−2,4) |
| −1 | 2 | f(−1)=(12)−1=21=2 | (−1,2) |
| 0 | 1 | f(0)=(12)0=1 | (0,1) |
| 1 | 12 | f(1)=(12)1=12 | (1,12) |
| 2 | 14 | f(2)=(12)2=14 | (2,14) |
Use these points to sketch the graph and note that it passes the horizontal line test.
Therefore this function is one-to-one and has an inverse. Reflecting the graph about the line y=x we have:
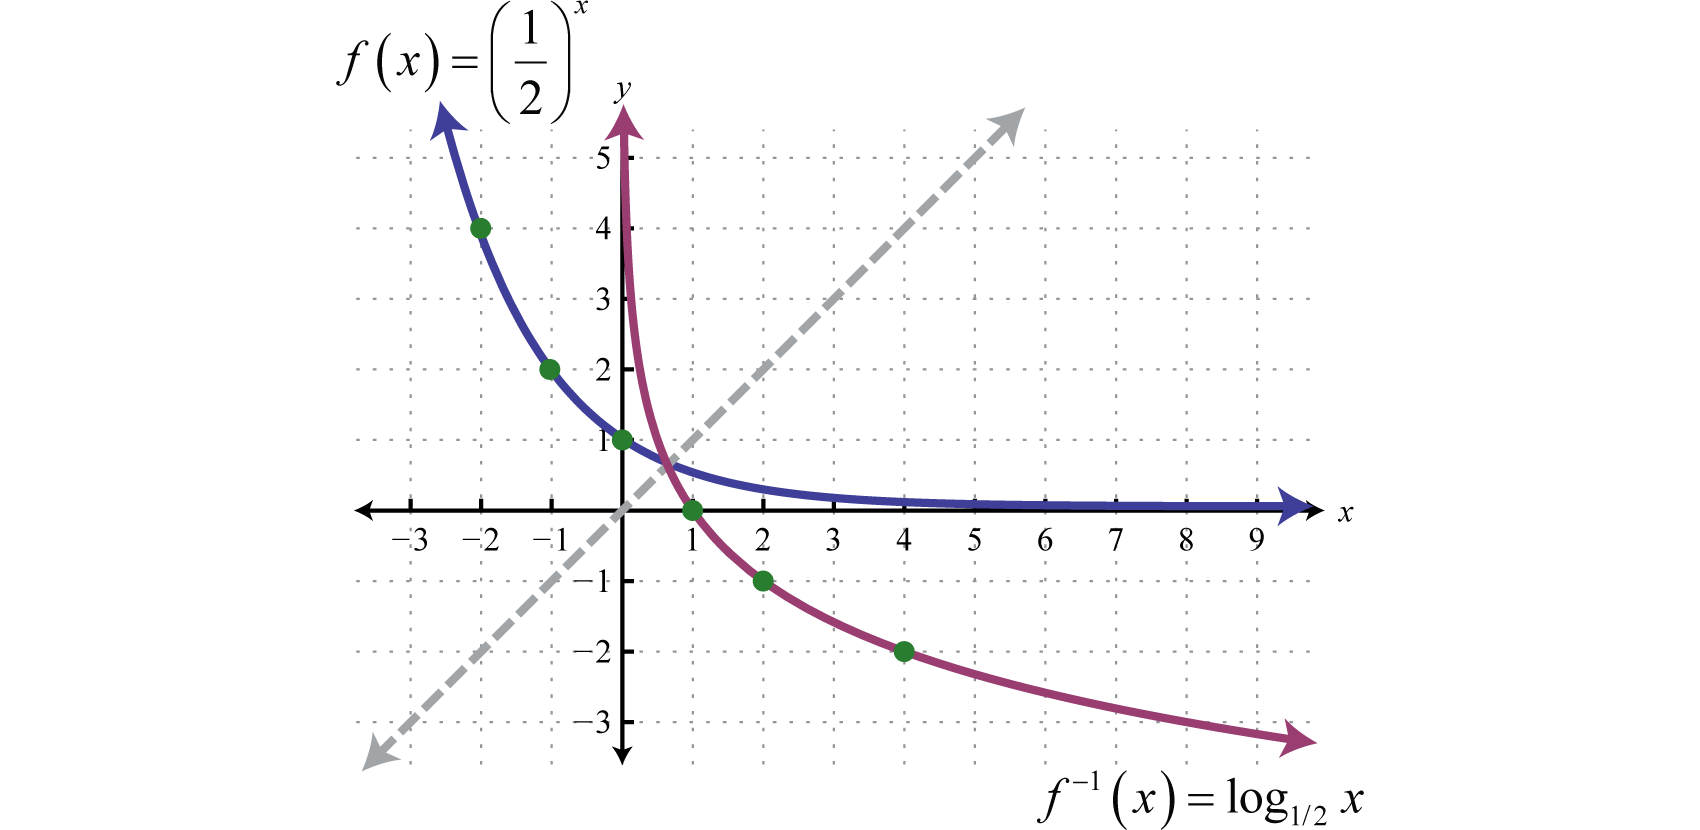
which gives us a picture of the graph of f−1(x)=log1/2x. In general, when the base b>1, the graph of the function defined by g(x)=log1/bx has the following shape.
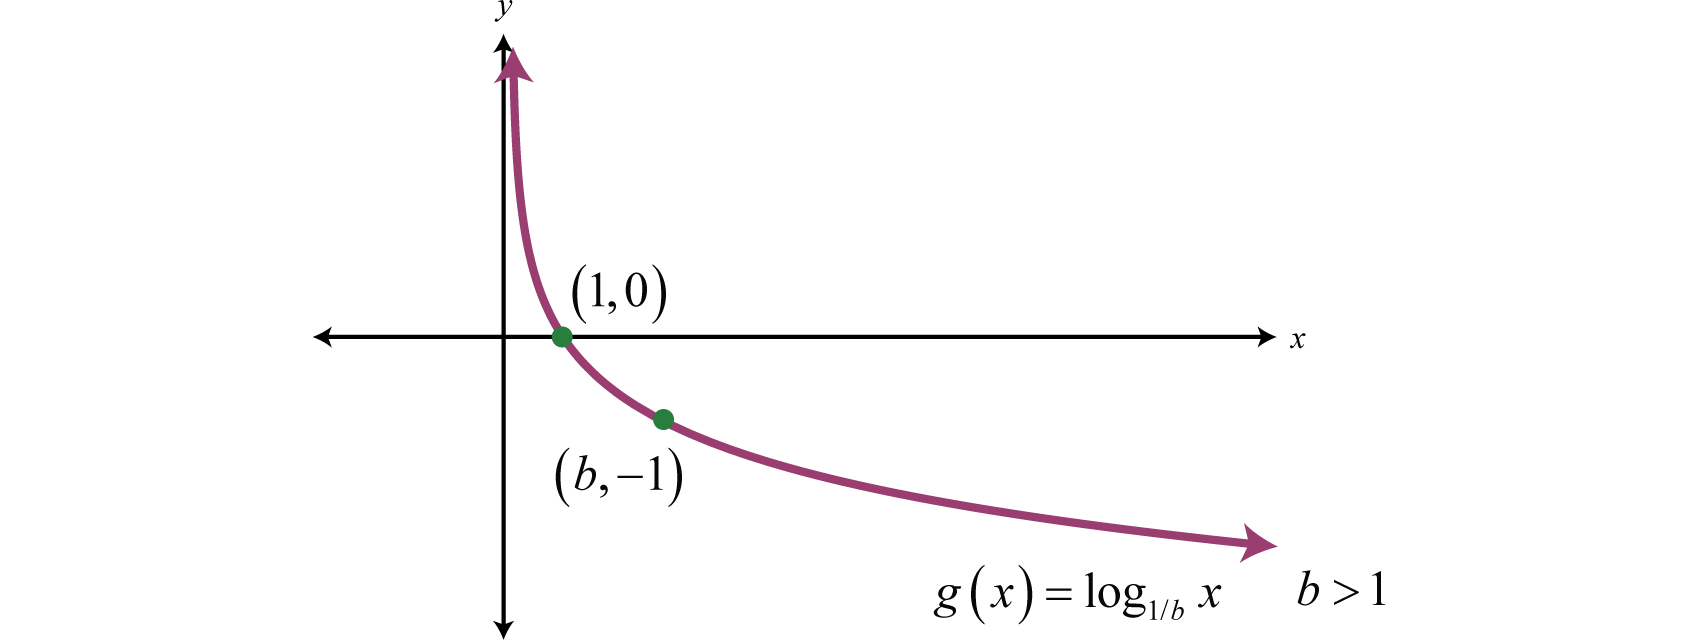
The domain consists of positive real numbers, (0,∞) and the range consists of all real numbers, (−∞,∞). The y-axis, or x=0, is a vertical asymptote and the x-intercept is (1,0). In addition, f(b)=log1/bb=−1 and so (b,−1) is a point on the graph.
Example 7.3.8:
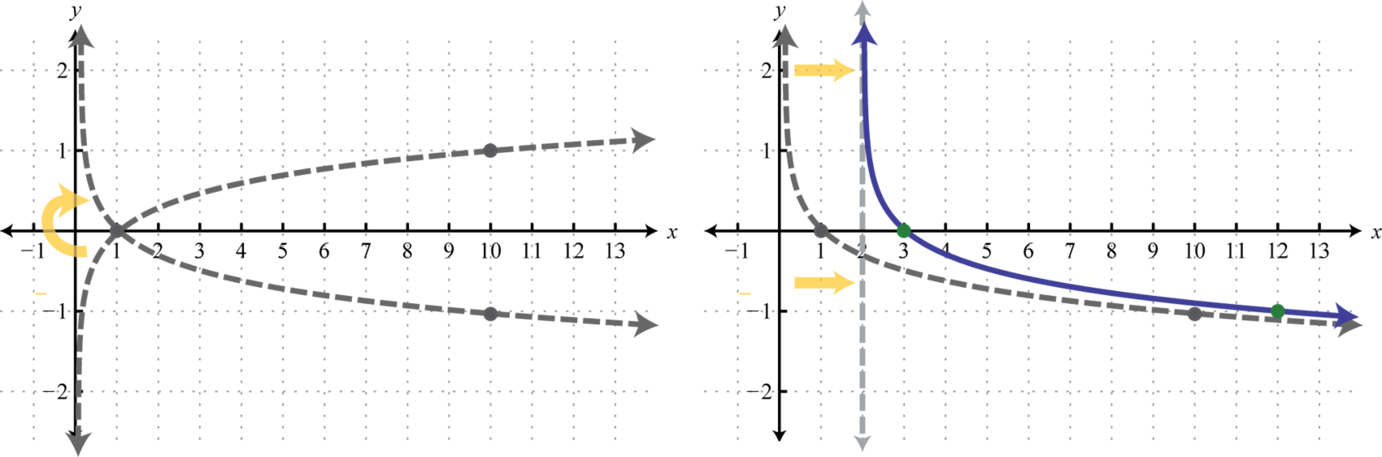
Sketch the graph and determine the domain and range: f(x)=log1/3(x+3)+2.
Solution
Begin by identifying the basic graph and the transformations.
y=log1/3xBasicgraph.y=log1/3(x+3)Shiftleft3units.y=log1/3(x+3)+2Shiftup2units.
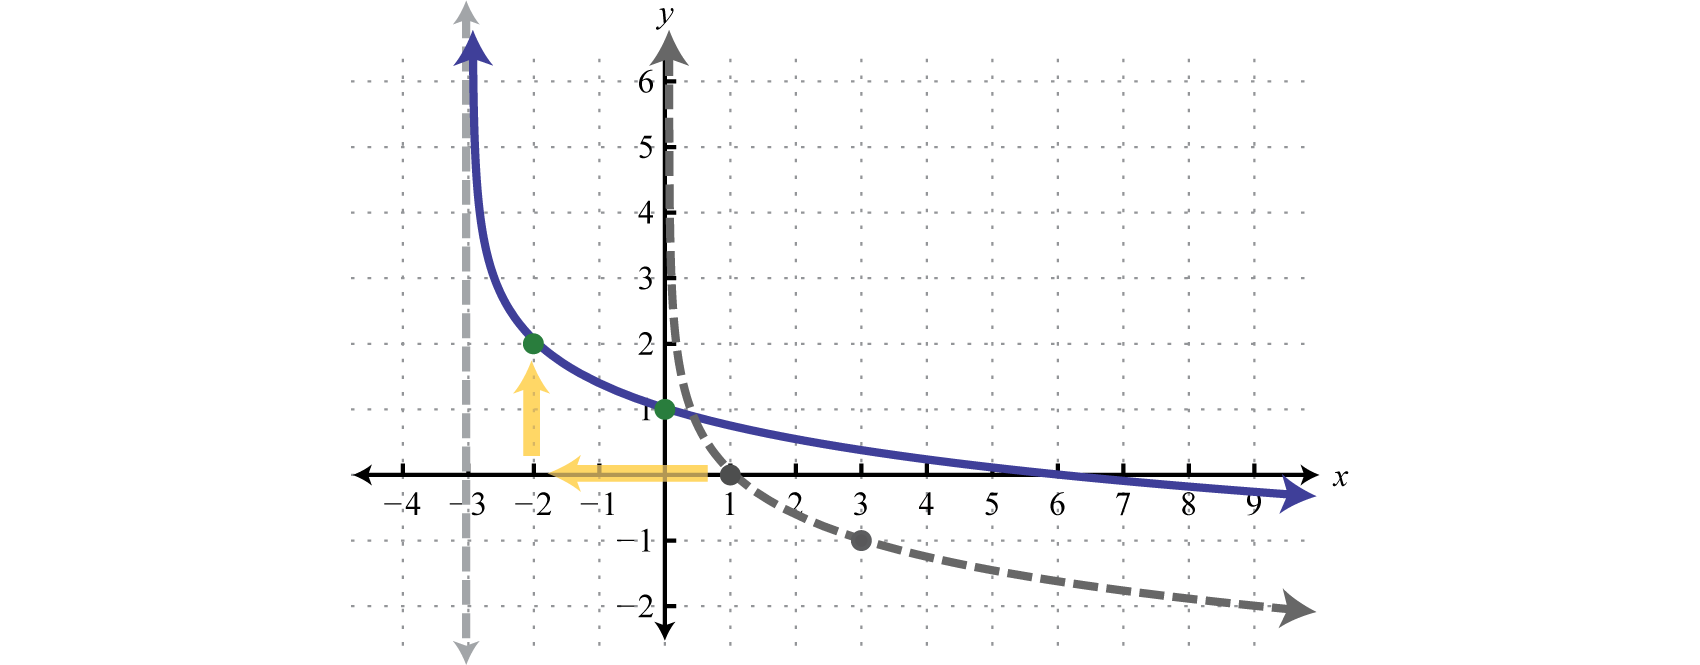
In this case the shift left 3 units moved the vertical asymptote to x=−3 which defines the lower bound of the domain.
Answer:
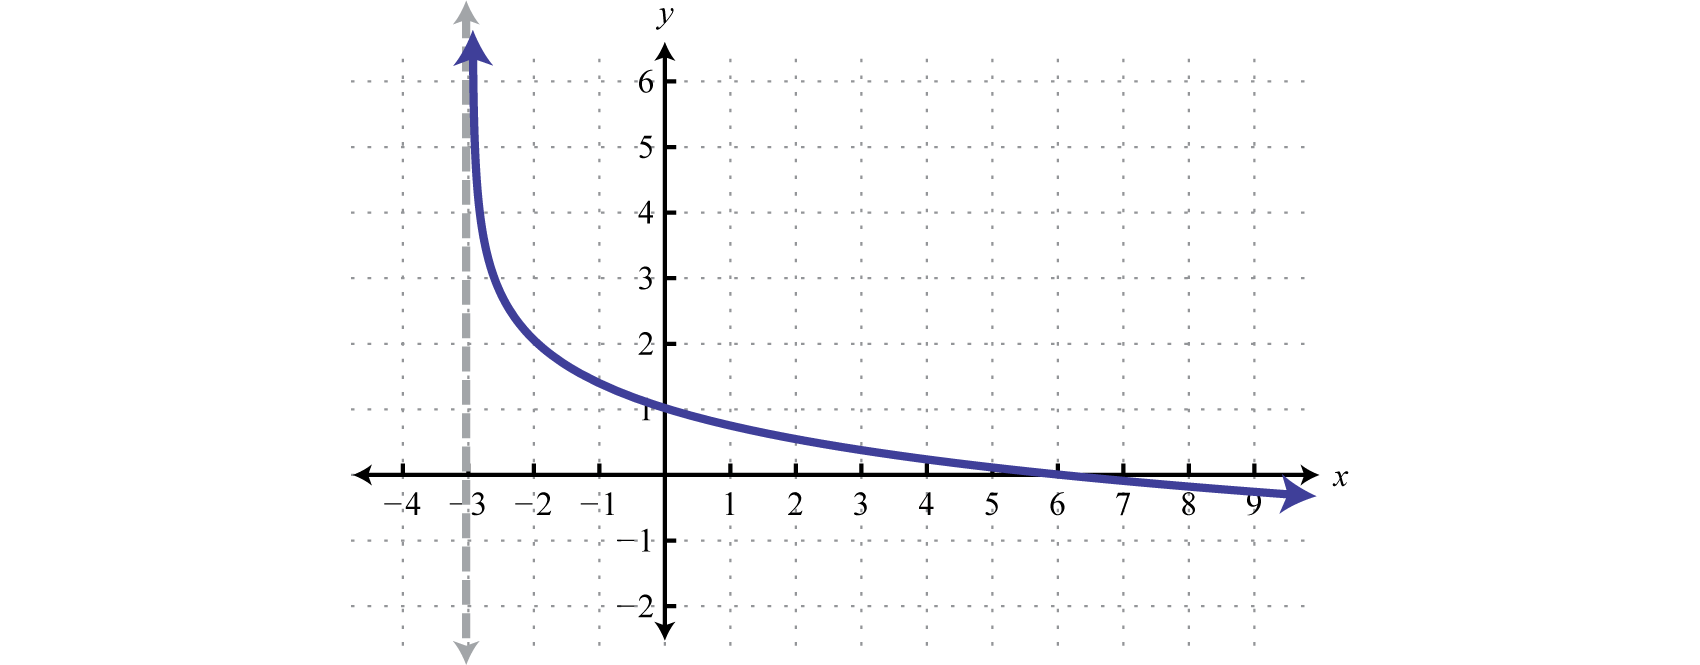
Domain: (−3,∞); Range: (−∞,∞)
In summary, if b>1

And for both cases,
Domain:(0,∞)Range:(−∞,∞)x−intercept:(1,0)Asymptote:x=0
Exercise 7.3.4
Sketch the graph and determine the domain and range: f(x)=log1/3(x−1).
- Answer
-
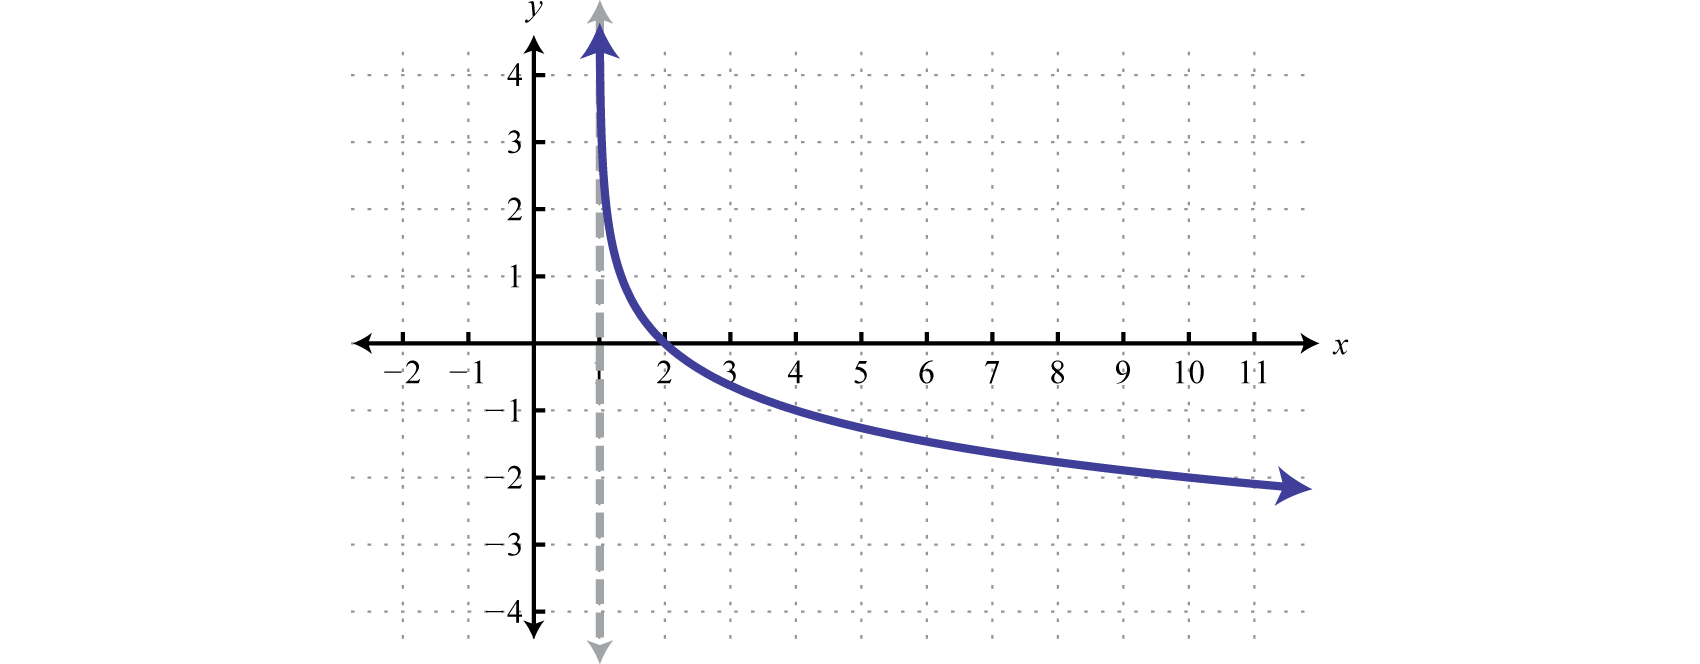
Figure 7.3.18 www.youtube.com/v/0oEVfInCAXw
Key Takeaways
- The base-b logarithmic function is defined to be the inverse of the base-b exponential function. In other words, y=logbx if and only if by=x where b>0 and b≠1.
- The logarithm is actually the exponent to which the base is raised to obtain its argument.
- The logarithm base 10 is called the common logarithm and is denoted logx.
- The logarithm base e is called the natural logarithm and is denoted lnx.
- Logarithmic functions with definitions of the form f(x)=logbx have a domain consisting of positive real numbers (0,∞) and a range consisting of all real numbers (−∞,∞).
- The y-axis, or x=0, is a vertical asymptote and the x-intercept is (1,0).
- To graph logarithmic functions we can plot points or identify the basic function and use the transformations. Be sure to indicate that there is a vertical asymptote by using a dashed line. This asymptote defines the boundary of the domain.
Exercise 7.3.5
Evaluate.
- log39
- log749
- log44
- log51
- log5625
- log3243
- log2(116)
- log3(19)
- log5(1125)
- log2(164)
- log4410
- log995
- log53√5
- log2√2
- log7(1√7)
- log9(13√9)
- log1/24
- log1/327
- log2/3(23)
- log3/4(916)
- log255
- log82
- log4(12)
- log27(13)
- log1/91
- log3/5(53)
- Answer
-
1. 2
3. 1
5. 4
7. −4
9. −3
11. 10
13. 13
15. −12
17. −2
19. 1
21. 12
23. −12
25. 0
Exercise 7.3.6
Find x.
- log3x=4
- log2x=5
- log5x=−3
- log6x=−2
- log12x=0
- log7x=−1
- log1/4x=−2
- log2/5x=2
- log1/9x=12
- log1/4x=32
- log1/3x=−1
- log1/5x=0
- Answer
-
1. 81
3. 1125
5. 1
7. 16
9. 13
11. 3
Exercise 7.3.7
Evaluate. Round off to the nearest hundredth where appropriate.
- log1000
- log100
- log0.1
- log0.0001
- log162
- log23
- log0.025
- log0.235
- lne4
- ln1
- ln(1e)
- ln(1e5)
- ln(25)
- ln(100)
- ln(0.125)
- ln(0.001)
- Answer
-
1. 3
3. −1
5. 2.21
7. −1.60
9. 4
11. −1
13. 3.22
15. −2.08
Exercise 7.3.8
Find x. Round off to the nearest hundredth.
- logx=2.5
- logx=1.8
- logx=−1.22
- logx=−0.8
- lnx=3.1
- lnx=1.01
- lnx=−0.69
- lnx=−1
- Answer
-
1. 316.23
3. 0.06
5. 22.20
7. 0.50
Exercise 7.3.9
Find a without using a calculator.
- log3(127)=a
- lne=a
- log2a=8
- log25√2=a
- log1012=a
- lna=9
- log1/8(164)=a
- log6a=−3
- lna=15
- log4/9(23)=a
- Answer
-
1. −3
3. 256
5. 12
7. 2
9. 5√e
Exercise 7.3.10
In 1935 Charles Richter developed a scale used to measure earthquakes on a seismograph. The magnitude M of an earthquake is given by the formula,
M=log(II0)
Here I represents the intensity of the earthquake as measured on the seismograph 100 km from the epicenter and I0 is the minimum intensity used for comparison. For example, if an earthquake intensity is measured to be 100 times that of the minimum, then I=100I0 and
M=log(100I0I0)=log(100)=2
The earthquake would be said to have a magnitude 2 on the Richter scale. Determine the magnitudes of the following intensities on the Richter scale. Round off to the nearest tenth.
- I is 3 million times that of the minimum intensity.
- I is 6 million times that of the minimum intensity.
- I is the same as the minimum intensity.
- I is 30 million times that of the minimum intensity.
- Answer
-
1. 6.5
3. 0
Exercise 7.3.11
In chemistry, pH is a measure of acidity and is given by the formula,
pH=−log(H+)
Here H+ represents the hydrogen ion concentration (measured in moles of hydrogen per liter of solution.) Determine the pH given the following hydrogen ion concentrations.
- Pure water: H+=0.0000001
- Blueberry: H+=0.0003162
- Lemon Juice: H+=0.01
- Battery Acid: H+=0.1
- Answer
-
1. 7
3. 2
Exercise 7.3.12
Sketch the function and determine the domain and range. Draw the vertical asymptote with a dashed line.
- f(x)=log2(x+1)
- f(x)=log3(x−2)
- f(x)=log2x−2
- f(x)=log3x+3
- f(x)=log2(x−2)+4
- f(x)=log3(x+1)−2
- f(x)=−log2x+1
- f(x)=−log3(x+3)
- f(x)=log2(−x)+1
- f(x)=2−log3(−x)
- f(x)=logx+5
- f(x)=logx−1
- f(x)=log(x+4)−8
- f(x)=log(x−5)+10
- f(x)=−log(x+2)
- f(x)=−log(x−1)+2
- f(x)=ln(x−3)
- f(x)=lnx+3
- f(x)=ln(x−2)+4
- f(x)=ln(x+5)
- f(x)=2−lnx
- f(x)=−ln(x−1)
- f(x)=log1/2x
- f(x)=log1/3x+2
- f(x)=log1/2(x−2)
- f(x)=log1/3(x+1)−1
- f(x)=2−log1/4x
- f(x)=1+log1/4(−x)
- f(x)=1−log1/3(x−2)
- f(x)=1+log1/2(−x)
- Answer
-
1. Domain: (−1,∞); Range: (−∞,∞)
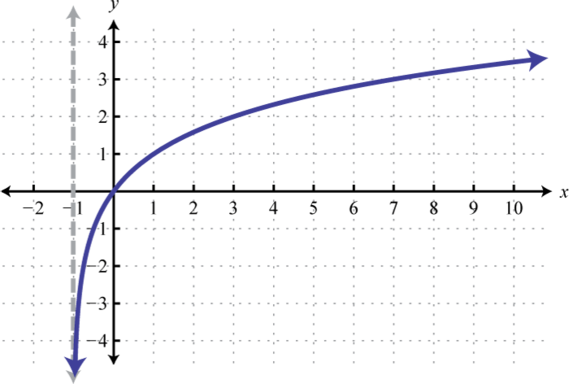
Figure 7.3.19 3. Domain: (0,∞) ; Range: (−∞,∞)
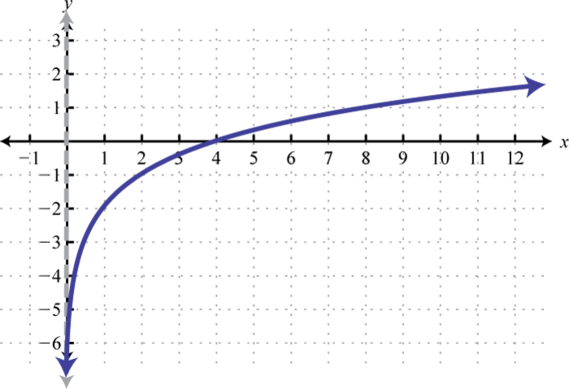
Figure 7.3.20 5. Domain: (2,∞) ; Range: (−∞,∞)
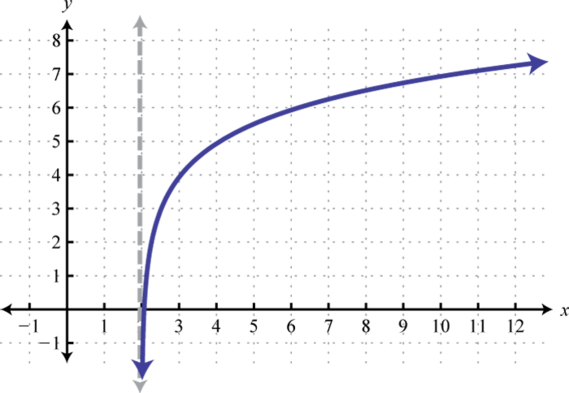
Figure 7.3.21 7. Domain: (0,∞) ; Range: (−∞,∞)
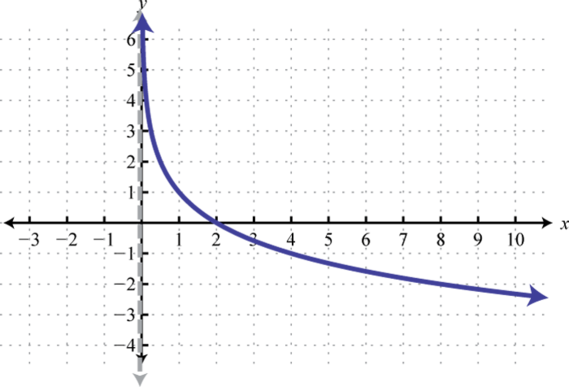
Figure 7.3.22 9. Domain: (−∞,0) ; Range: (−∞,∞)
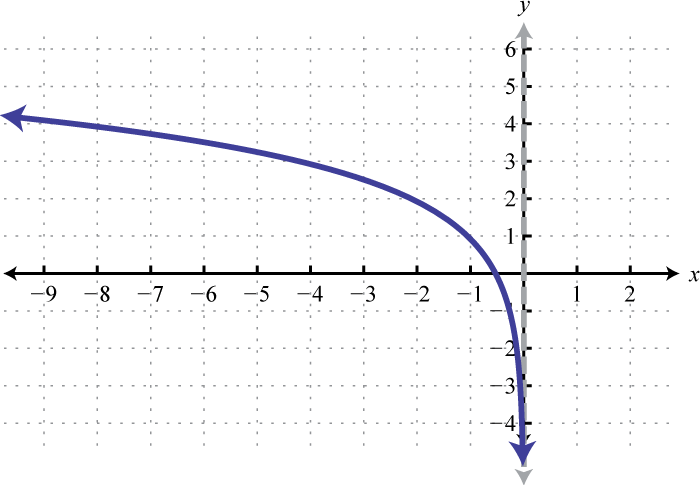
Figure 7.3.23 11. Domain: (0,∞) ; Range: (−∞,∞)
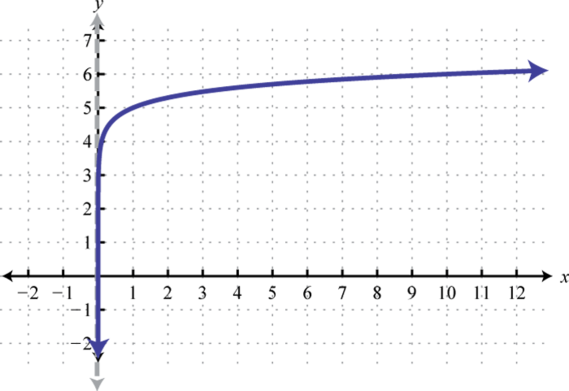
Figure 7.3.24 13. Domain: (−4,∞) ; Range: (−∞,∞)
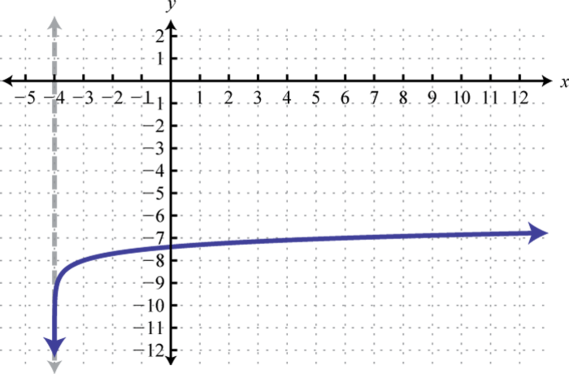
Figure 7.3.25 15. Domain: (−2,∞) ; Range: (−∞,∞)
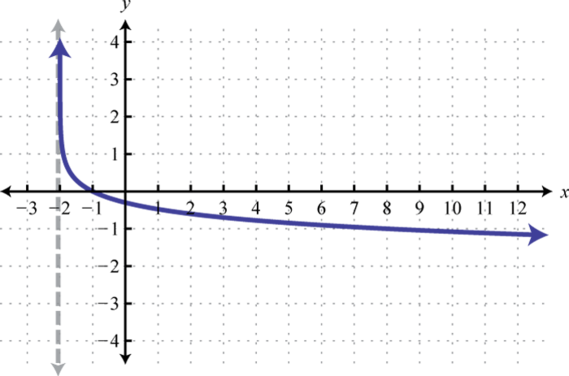
Figure 7.3.26 17. Domain: (3,∞) ; Range: (−∞,∞)
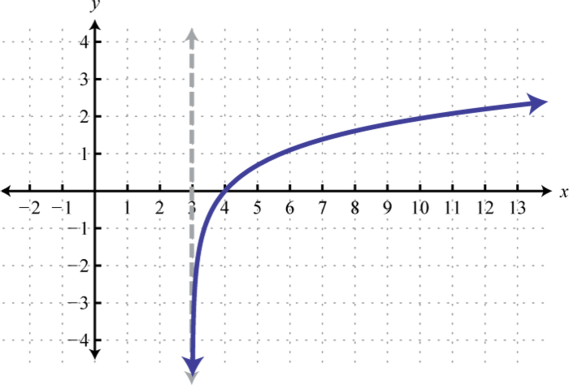
Figure 7.3.27 19. Domain: (2,∞) ; Range: (−∞,∞)
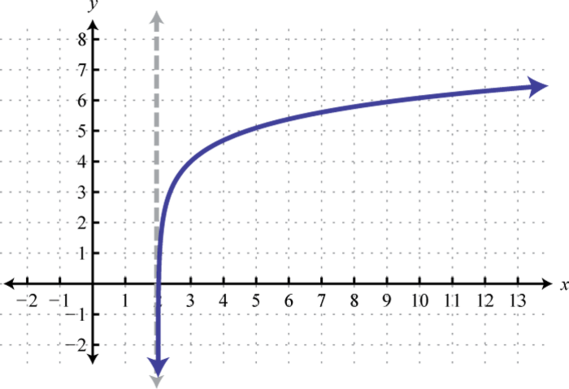
Figure 7.3.28 21. Domain: (0,∞) ; Range: (−∞,∞)
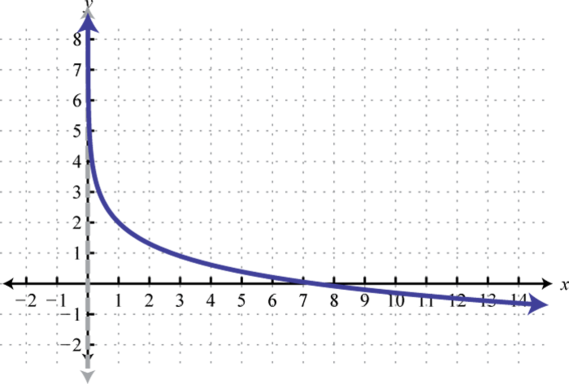
Figure 7.3.29 23. Domain: (0,∞) ; Range: (−∞,∞)
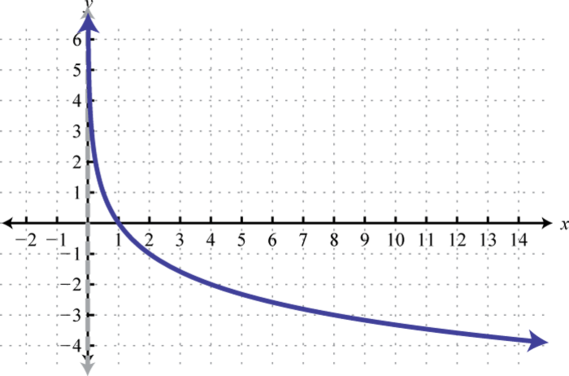
Figure 7.3.30 25. Domain: (2,∞) ; Range: (−∞,∞)
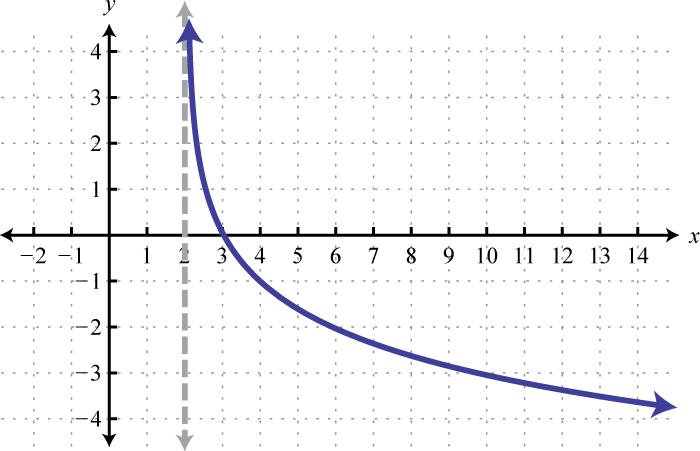
Figure 7.3.31 27. Domain: (0,∞) ; Range: (−∞,∞)
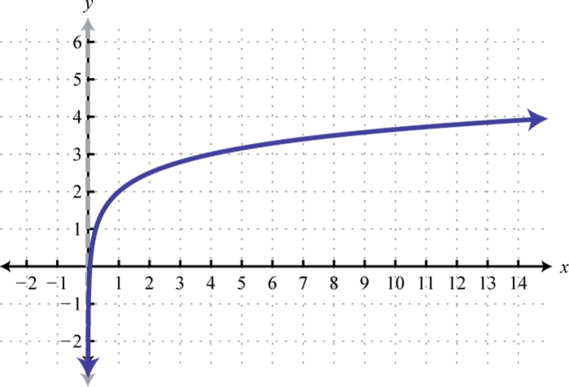
Figure 7.3.32 29. Domain: (2,∞) ; Range: (−∞,∞)
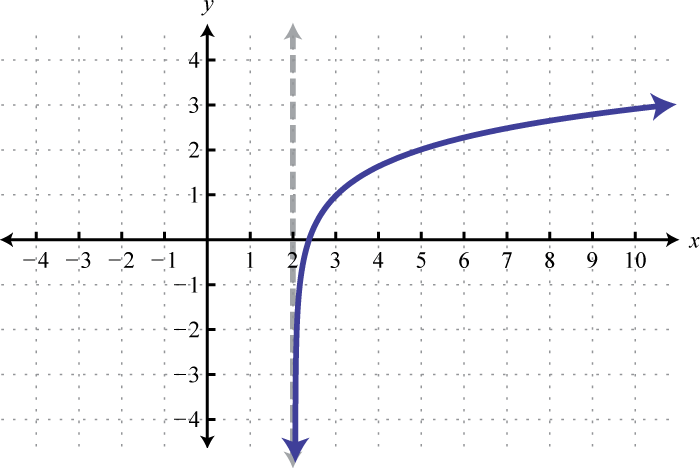
Figure 7.3.33
Exercise 7.3.13
- Research and discuss the origins and history of the logarithm. How did students work with them before the common availability of calculators?
- Research and discuss the history and use of the Richter scale. What does each unit on the Richter scale represent?
- Research and discuss the life and contributions of John Napier.
- Answer
-
1. Answer may vary
3. Answer may vary