
13.1: Functions of Several Variables
( \newcommand{\kernel}{\mathrm{null}\,}\)
- Recognize a function of two variables and identify its domain and range.
- Sketch a graph of a function of two variables.
- Sketch several traces or level curves of a function of two variables.
- Recognize a function of three or more variables and identify its level surfaces.
Our first step is to explain what a function of more than one variable is, starting with functions of two independent variables. This step includes identifying the domain and range of such functions and learning how to graph them. We also examine ways to relate the graphs of functions in three dimensions to graphs of more familiar planar functions.
Functions of Two Variables
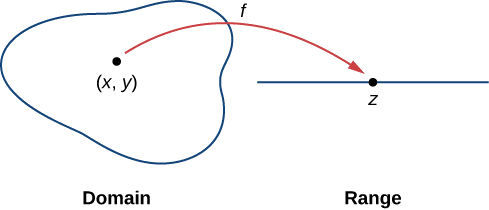
The definition of a function of two variables is very similar to the definition for a function of one variable. The main difference is that, instead of mapping values of one variable to values of another variable, we map ordered pairs of variables to another variable.
A function of two variables
Determining the domain of a function of two variables involves taking into account any domain restrictions that may exist. Let’s take a look.
Find the domain and range of each of the following functions:
Solution
a. This is an example of a linear function in two variables. There are no values or combinations of
b. For the function
This inequality can be written in the form
Therefore, the domain of

To determine the range of
If
This is the maximum value of the function. Given any value
Since
Find the domain and range of the function
- Hint
-
Determine the set of ordered pairs that do not make the radicand negative.
- Solution
-
The domain is
Graphing Functions of Two Variables
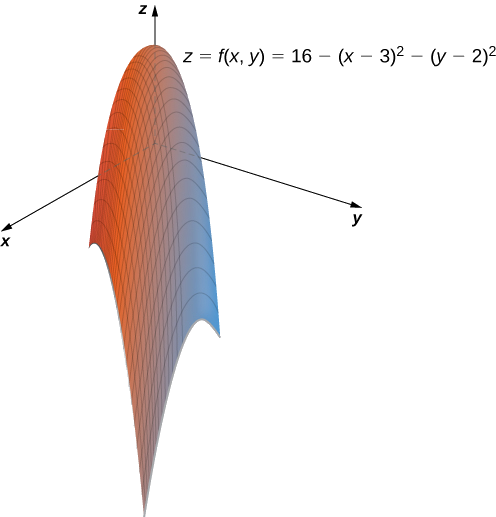
Suppose we wish to graph the function
To understand more completely the concept of plotting a set of ordered triples to obtain a surface in three-dimensional space, imagine the
Create a graph of each of the following functions:
Solution
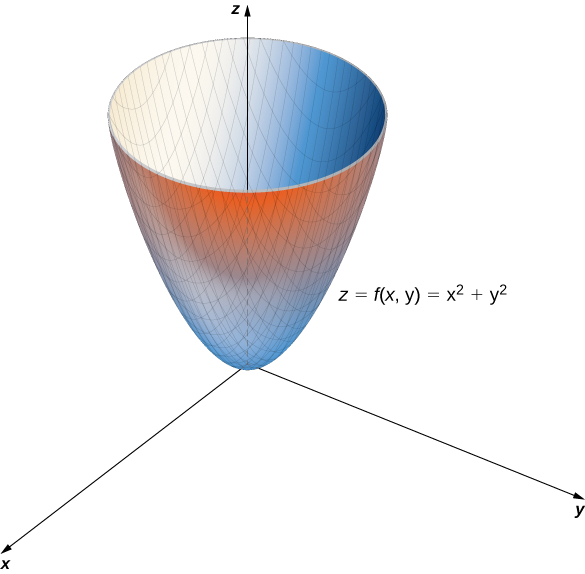
a. In Example
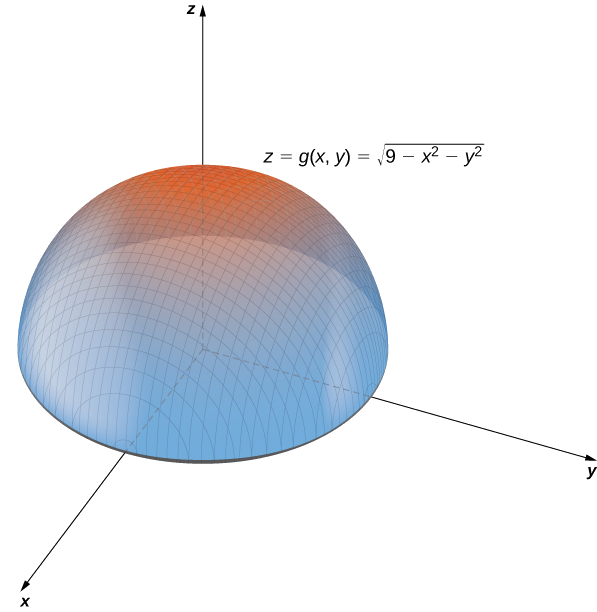
b. This function also contains the expression
A profit function for a hardware manufacturer is given by
where
Solution
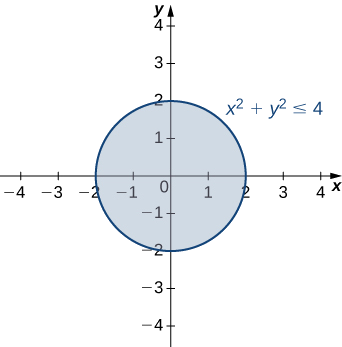
This function is a polynomial function in two variables. The domain of
This is a disk of radius
Since
Level Curves
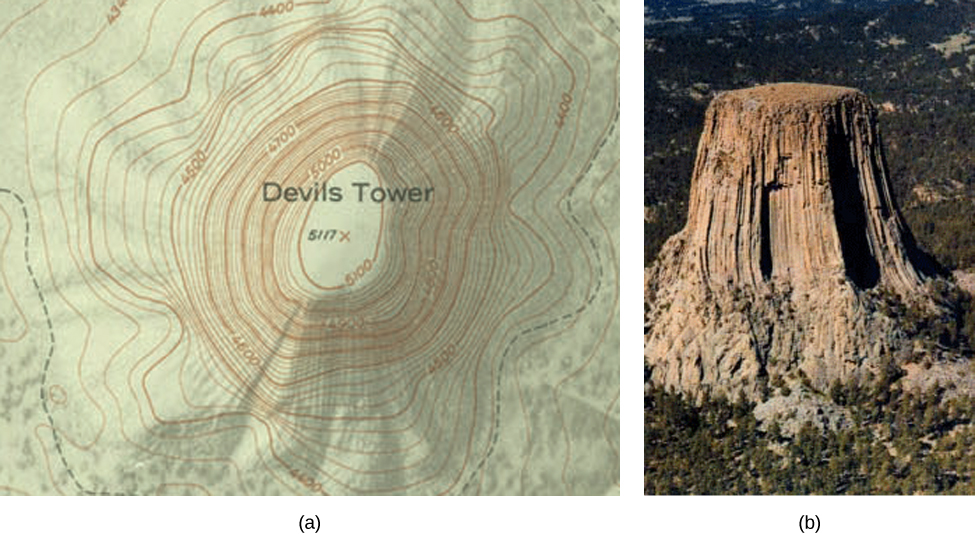
If hikers walk along rugged trails, they might use a topographical map that shows how steeply the trails change. A topographical map contains curved lines called contour lines. Each contour line corresponds to the points on the map that have equal elevation (Figure
Given a function
Returning to the function
To simplify, square both sides of this equation:
Now, multiply both sides of the equation by
This equation describes a circle centered at the origin with radius
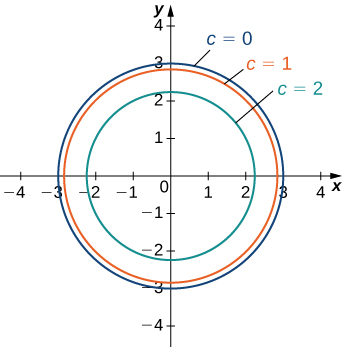
A graph of the various level curves of a function is called a contour map.
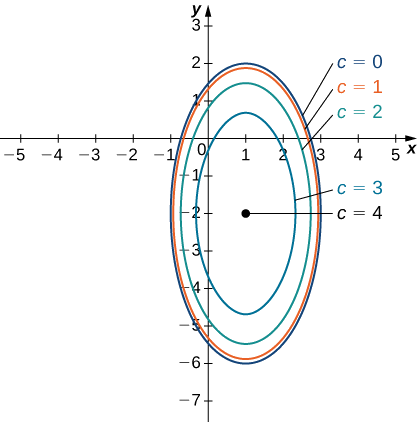
Given the function
Solution
To find the level curve for
We then square both sides and multiply both sides of the equation by
Now, we rearrange the terms, putting the
Next, we group the pairs of terms containing the same variable in parentheses, and factor
Then we complete the square in each pair of parentheses and add the correct value to the right-hand side:
Next, we factor the left-hand side and simplify the right-hand side:
Last, we divide both sides by
This equation describes an ellipse centered at
We can repeat the same derivation for values of
for an arbitrary value of
Finding the Domain & Range
Since this is a square root function, the radicand must not be negative. So we have
Recognizing that the boundary of the domain is an ellipse, we repeat the steps we showed above to obtain
So the domain of
To find the range of
To determine the upper bound for the range of the function in this problem, it's easier if we first complete the square under the radical.
Now that we have
So the range of this function is
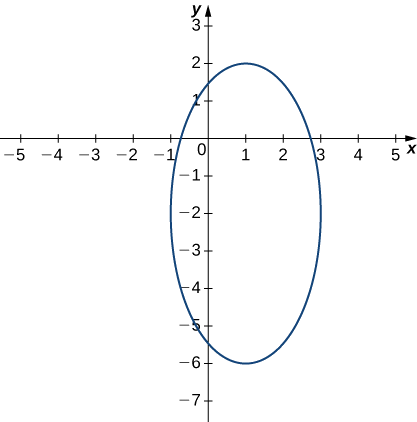
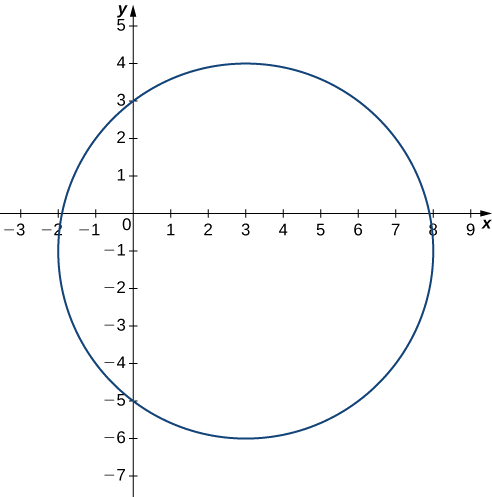
Find and graph the level curve of the function
- Hint
-
First, set
- Solution
-
The equation of the level curve can be written as
Another useful tool for understanding the graph of a function of two variables is called a vertical trace. Level curves are always graphed in the
Consider a function
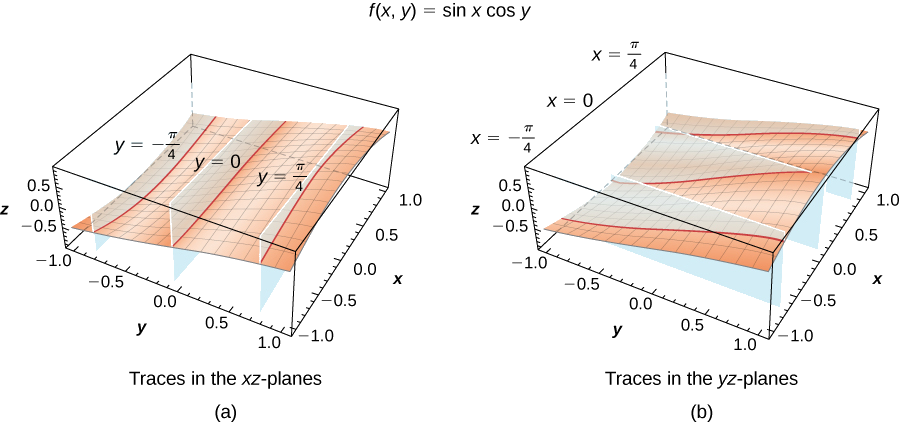
Find vertical traces for the function
Solution
First set
This describes a cosine graph in the plane
| Vertical Trace for |
|
|---|---|
| 0 | |
In a similar fashion, we can substitute the
| Vertical Trace for |
|
|---|---|
| 0 | |
The three traces in the
Determine the equation of the vertical trace of the function
- Hint
-
Set
- Solution
-
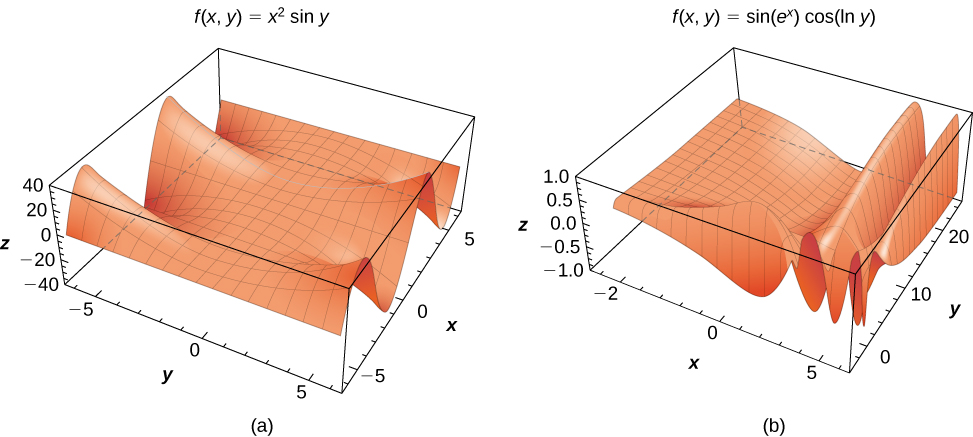
Functions of two variables can produce some striking-looking surfaces. Figure
Functions of More Than Two Variables
So far, we have examined only functions of two variables. However, it is useful to take a brief look at functions of more than two variables. Two such examples are
and
In the first function,
Find the domain of each of the following functions:
Solution:
a. For the function
- The denominator cannot be zero.
- The radicand cannot be negative.
Combining these conditions leads to the inequality
Moving the variables to the other side and reversing the inequality gives the domain as
which describes a ball of radius
b. For the function
- The radicand cannot be negative.
- The denominator cannot be zero.
Since the radicand cannot be negative, this implies
Find the domain of the function
- Hint
-
Check for values that make radicands negative or denominators equal to zero.
- Solution
-
Functions of two variables have level curves, which are shown as curves in the
Given a function
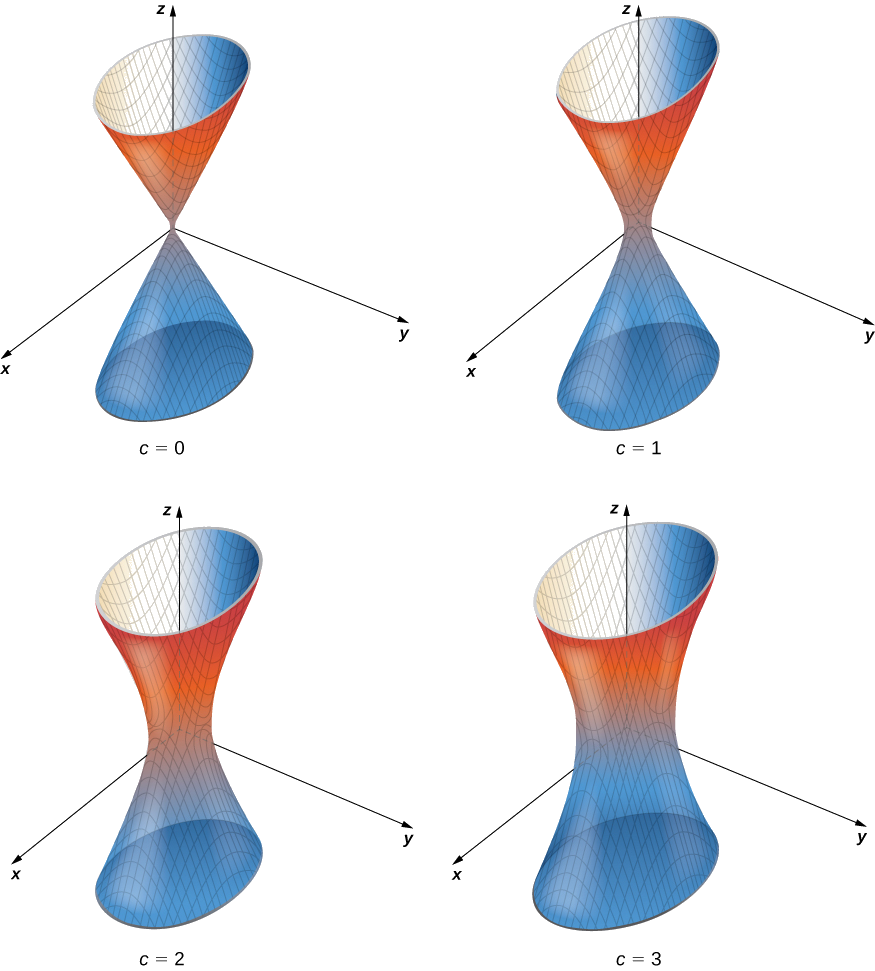
Find the level surface for the function
Solution
The level surface is defined by the equation
Find the equation of the level surface of the function
corresponding to
- Hint
-
Set
- Solution
-
Summary
- The graph of a function of two variables is a surface in
- A set of level curves is called a contour map.
Key Equations
- Vertical trace
- Level surface of a function of three variables
Glossary
- contour map
- a plot of the various level curves of a given function
- function of two variables
- a function
- graph of a function of two variables
- a set of ordered triples
- level curve of a function of two variables
- the set of points satisfying the equation
- level surface of a function of three variables
- the set of points satisfying the equation
- surface
- the graph of a function of two variables,
- vertical trace
- the set of ordered triples