
8.3.1: Comparing Groups
- Page ID
- 39028

\( \newcommand{\vecs}[1]{\overset { \scriptstyle \rightharpoonup} {\mathbf{#1}} } \)
\( \newcommand{\vecd}[1]{\overset{-\!-\!\rightharpoonup}{\vphantom{a}\smash {#1}}} \)
\( \newcommand{\dsum}{\displaystyle\sum\limits} \)
\( \newcommand{\dint}{\displaystyle\int\limits} \)
\( \newcommand{\dlim}{\displaystyle\lim\limits} \)
\( \newcommand{\id}{\mathrm{id}}\) \( \newcommand{\Span}{\mathrm{span}}\)
( \newcommand{\kernel}{\mathrm{null}\,}\) \( \newcommand{\range}{\mathrm{range}\,}\)
\( \newcommand{\RealPart}{\mathrm{Re}}\) \( \newcommand{\ImaginaryPart}{\mathrm{Im}}\)
\( \newcommand{\Argument}{\mathrm{Arg}}\) \( \newcommand{\norm}[1]{\| #1 \|}\)
\( \newcommand{\inner}[2]{\langle #1, #2 \rangle}\)
\( \newcommand{\Span}{\mathrm{span}}\)
\( \newcommand{\id}{\mathrm{id}}\)
\( \newcommand{\Span}{\mathrm{span}}\)
\( \newcommand{\kernel}{\mathrm{null}\,}\)
\( \newcommand{\range}{\mathrm{range}\,}\)
\( \newcommand{\RealPart}{\mathrm{Re}}\)
\( \newcommand{\ImaginaryPart}{\mathrm{Im}}\)
\( \newcommand{\Argument}{\mathrm{Arg}}\)
\( \newcommand{\norm}[1]{\| #1 \|}\)
\( \newcommand{\inner}[2]{\langle #1, #2 \rangle}\)
\( \newcommand{\Span}{\mathrm{span}}\) \( \newcommand{\AA}{\unicode[.8,0]{x212B}}\)
\( \newcommand{\vectorA}[1]{\vec{#1}} % arrow\)
\( \newcommand{\vectorAt}[1]{\vec{\text{#1}}} % arrow\)
\( \newcommand{\vectorB}[1]{\overset { \scriptstyle \rightharpoonup} {\mathbf{#1}} } \)
\( \newcommand{\vectorC}[1]{\textbf{#1}} \)
\( \newcommand{\vectorD}[1]{\overrightarrow{#1}} \)
\( \newcommand{\vectorDt}[1]{\overrightarrow{\text{#1}}} \)
\( \newcommand{\vectE}[1]{\overset{-\!-\!\rightharpoonup}{\vphantom{a}\smash{\mathbf {#1}}}} \)
\( \newcommand{\vecs}[1]{\overset { \scriptstyle \rightharpoonup} {\mathbf{#1}} } \)
\(\newcommand{\longvect}{\overrightarrow}\)
\( \newcommand{\vecd}[1]{\overset{-\!-\!\rightharpoonup}{\vphantom{a}\smash {#1}}} \)
\(\newcommand{\avec}{\mathbf a}\) \(\newcommand{\bvec}{\mathbf b}\) \(\newcommand{\cvec}{\mathbf c}\) \(\newcommand{\dvec}{\mathbf d}\) \(\newcommand{\dtil}{\widetilde{\mathbf d}}\) \(\newcommand{\evec}{\mathbf e}\) \(\newcommand{\fvec}{\mathbf f}\) \(\newcommand{\nvec}{\mathbf n}\) \(\newcommand{\pvec}{\mathbf p}\) \(\newcommand{\qvec}{\mathbf q}\) \(\newcommand{\svec}{\mathbf s}\) \(\newcommand{\tvec}{\mathbf t}\) \(\newcommand{\uvec}{\mathbf u}\) \(\newcommand{\vvec}{\mathbf v}\) \(\newcommand{\wvec}{\mathbf w}\) \(\newcommand{\xvec}{\mathbf x}\) \(\newcommand{\yvec}{\mathbf y}\) \(\newcommand{\zvec}{\mathbf z}\) \(\newcommand{\rvec}{\mathbf r}\) \(\newcommand{\mvec}{\mathbf m}\) \(\newcommand{\zerovec}{\mathbf 0}\) \(\newcommand{\onevec}{\mathbf 1}\) \(\newcommand{\real}{\mathbb R}\) \(\newcommand{\twovec}[2]{\left[\begin{array}{r}#1 \\ #2 \end{array}\right]}\) \(\newcommand{\ctwovec}[2]{\left[\begin{array}{c}#1 \\ #2 \end{array}\right]}\) \(\newcommand{\threevec}[3]{\left[\begin{array}{r}#1 \\ #2 \\ #3 \end{array}\right]}\) \(\newcommand{\cthreevec}[3]{\left[\begin{array}{c}#1 \\ #2 \\ #3 \end{array}\right]}\) \(\newcommand{\fourvec}[4]{\left[\begin{array}{r}#1 \\ #2 \\ #3 \\ #4 \end{array}\right]}\) \(\newcommand{\cfourvec}[4]{\left[\begin{array}{c}#1 \\ #2 \\ #3 \\ #4 \end{array}\right]}\) \(\newcommand{\fivevec}[5]{\left[\begin{array}{r}#1 \\ #2 \\ #3 \\ #4 \\ #5 \\ \end{array}\right]}\) \(\newcommand{\cfivevec}[5]{\left[\begin{array}{c}#1 \\ #2 \\ #3 \\ #4 \\ #5 \\ \end{array}\right]}\) \(\newcommand{\mattwo}[4]{\left[\begin{array}{rr}#1 \amp #2 \\ #3 \amp #4 \\ \end{array}\right]}\) \(\newcommand{\laspan}[1]{\text{Span}\{#1\}}\) \(\newcommand{\bcal}{\cal B}\) \(\newcommand{\ccal}{\cal C}\) \(\newcommand{\scal}{\cal S}\) \(\newcommand{\wcal}{\cal W}\) \(\newcommand{\ecal}{\cal E}\) \(\newcommand{\coords}[2]{\left\{#1\right\}_{#2}}\) \(\newcommand{\gray}[1]{\color{gray}{#1}}\) \(\newcommand{\lgray}[1]{\color{lightgray}{#1}}\) \(\newcommand{\rank}{\operatorname{rank}}\) \(\newcommand{\row}{\text{Row}}\) \(\newcommand{\col}{\text{Col}}\) \(\renewcommand{\row}{\text{Row}}\) \(\newcommand{\nul}{\text{Nul}}\) \(\newcommand{\var}{\text{Var}}\) \(\newcommand{\corr}{\text{corr}}\) \(\newcommand{\len}[1]{\left|#1\right|}\) \(\newcommand{\bbar}{\overline{\bvec}}\) \(\newcommand{\bhat}{\widehat{\bvec}}\) \(\newcommand{\bperp}{\bvec^\perp}\) \(\newcommand{\xhat}{\widehat{\xvec}}\) \(\newcommand{\vhat}{\widehat{\vvec}}\) \(\newcommand{\uhat}{\widehat{\uvec}}\) \(\newcommand{\what}{\widehat{\wvec}}\) \(\newcommand{\Sighat}{\widehat{\Sigma}}\) \(\newcommand{\lt}{<}\) \(\newcommand{\gt}{>}\) \(\newcommand{\amp}{&}\) \(\definecolor{fillinmathshade}{gray}{0.9}\)Lesson
Let's compare two groups.
Exercise \(\PageIndex{1}\): Notice and Wonder: Comparing Heights
What do you notice? What do you wonder?

Exercise \(\PageIndex{2}\): More Team Heights
- How much taller is the volleyball team than the gymnastics team?
- Gymnastics team’s heights (in inches) : 56, 59, 60, 62, 62, 63, 63, 63, 64, 64, 68, 69
- Volleyball team’s heights (in inches): 72, 75, 76, 76, 78, 79, 79, 80, 80, 81, 81, 81
- Make dot plots to compare the heights of the tennis and badminton teams.
- Tennis team’s heights (in inches): 66, 67, 69, 70, 71, 73, 73, 74, 75, 75, 76
- Badminton team’s heights (in inches): 62, 62, 65, 66, 68, 71, 73
What do you notice about your dot plots?
- Elena says the members of the tennis team were taller than the badminton team. Lin disagrees. Do you agree with either of them? Explain or show your reasoning.
Exercise \(\PageIndex{3}\): Family Heights
Compare the heights of these two families. Explain or show your reasoning.
- The heights (in inches) of Noah’s family members: 28, 39, 41, 52, 63, 66, 71
- The heights (in inches) of Jada’s family members: 49, 60, 68, 70, 71, 73, 77
Are you ready for more?
If Jada's family adopts newborn twins who are each 18 inches tall, does this change your thinking? Explain your reasoning.
Exercise \(\PageIndex{4}\): Track Length
Here are three dot plots that represent the lengths, in minutes, of songs on different albums.
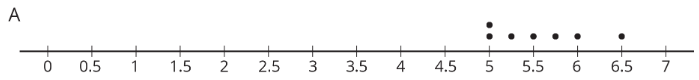
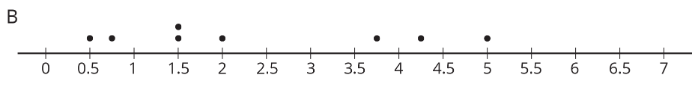

- One of these data sets has a mean of 5.57 minutes and another has a mean of 3.91 minutes.
- Which dot plot shows each of these data sets?
- Calculate the mean for the data set on the other dot plot.
- One of these data sets has a mean absolute deviation of 0.30 and another has a MAD of 0.44.
- Which dot plot shows each of these data sets?
- Calculate the MAD for the other data set.
- Do you think the three groups are very different or not? Be prepared to explain your reasoning.
- A fourth album has a mean length of 8 minutes with a mean absolute deviation of 1.2. Is this data set very different from each of the others?
Summary
Comparing two individuals is fairly straightforward. The question "Which dog is taller?" can be answered by measuring the heights of two dogs and comparing them directly. Comparing two groups can be more challenging. What does it mean for the basketball team to generally be taller than the soccer team?
To compare two groups, we use the distribution of values for the two groups. Most importantly, a measure of center (usually mean or median) and its associated measure of variability (usually mean absolute deviation or interquartile range) can help determine the differences between groups.
For example, if the average height of pugs in a dog show is 11 inches, and the average height of the beagles in the dog show is 15 inches, it seems that the beagles are generally taller. On the other hand, if the MAD is 3 inches, it would not be unreasonable to find a beagle that is 11 inches tall or a pug that is 14 inches tall. Therefore the heights of the two dog breeds may not be very different from one another.
Glossary Entries
Definition: Mean
The mean is one way to measure the center of a data set. We can think of it as a balance point. For example, for the data set 7, 9, 12, 13, 14, the mean is 11.

To find the mean, add up all the numbers in the data set. Then, divide by how many numbers there are. \(7+9+12+13+14=55\) and \(55\div 5=11\).
Definition: Mean Absolute Deviation (MAD)
The mean absolute deviation is one way to measure how spread out a data set is. Sometimes we call this the MAD. For example, for the data set 7, 9, 12, 13, 14, the MAD is 2.4. This tells us that these travel times are typically 2.4 minutes away from the mean, which is 11.
To find the MAD, add up the distance between each data point and the mean. Then, divide by how many numbers there are.
\(4+2+1+2+3=12\) and \(12\div 5=2.4\)
Definition: Median
The median is one way to measure the center of a data set. It is the middle number when the data set is listed in order.
For the data set 7, 9, 12, 13, 14, the median is 12.
For the data set 3, 5, 6, 8, 11, 12, there are two numbers in the middle. The median is the average of these two numbers. \(6+8=14\) and \(14\div 2=7\).
Practice
Exercise \(\PageIndex{5}\)
Compare the weights of the backpacks for the students in these three classes.

Exercise \(\PageIndex{6}\)
A bookstore has marked down the price for all the books in a certain series by 15%.
- How much is the discount on a book that normally costs $18.00?
- After the discount, how much would the book cost?
(From Unit 4.3.2)
Exercise \(\PageIndex{7}\)
Match each expression in the first list with an equivalent expression from the second list.
- \(6(x+2y)-2(y-2x)\)
- \(2.5(2x+4y)-5(4y-x)\)
- \(4(5x-3y)-10x+6y\)
- \(5.5(x+y)-2(x+y)+6.5(x+y)\)
- \(7.9(5x+3y)-4.2(5x+3y)-1.7(5x+3y)\)
- \(10(x-y)\)
- \(10(x+y)\)
- \(10x+6y\)
- \(10x-6y\)
(From Unit 6.4.5)
Exercise \(\PageIndex{8}\)
Angles \(C\) and \(D\) are complementary. The ratio of the measure of Angle \(C\) to the measure of Angle \(D\) is \(2:3\). Find the measure of each angle. Explain or show your reasoning.
(From Unit 7.1.2)