
7.4: Solving Quadratic Inequalities
- Page ID
- 173499

\( \newcommand{\vecs}[1]{\overset { \scriptstyle \rightharpoonup} {\mathbf{#1}} } \)
\( \newcommand{\vecd}[1]{\overset{-\!-\!\rightharpoonup}{\vphantom{a}\smash {#1}}} \)
\( \newcommand{\dsum}{\displaystyle\sum\limits} \)
\( \newcommand{\dint}{\displaystyle\int\limits} \)
\( \newcommand{\dlim}{\displaystyle\lim\limits} \)
\( \newcommand{\id}{\mathrm{id}}\) \( \newcommand{\Span}{\mathrm{span}}\)
( \newcommand{\kernel}{\mathrm{null}\,}\) \( \newcommand{\range}{\mathrm{range}\,}\)
\( \newcommand{\RealPart}{\mathrm{Re}}\) \( \newcommand{\ImaginaryPart}{\mathrm{Im}}\)
\( \newcommand{\Argument}{\mathrm{Arg}}\) \( \newcommand{\norm}[1]{\| #1 \|}\)
\( \newcommand{\inner}[2]{\langle #1, #2 \rangle}\)
\( \newcommand{\Span}{\mathrm{span}}\)
\( \newcommand{\id}{\mathrm{id}}\)
\( \newcommand{\Span}{\mathrm{span}}\)
\( \newcommand{\kernel}{\mathrm{null}\,}\)
\( \newcommand{\range}{\mathrm{range}\,}\)
\( \newcommand{\RealPart}{\mathrm{Re}}\)
\( \newcommand{\ImaginaryPart}{\mathrm{Im}}\)
\( \newcommand{\Argument}{\mathrm{Arg}}\)
\( \newcommand{\norm}[1]{\| #1 \|}\)
\( \newcommand{\inner}[2]{\langle #1, #2 \rangle}\)
\( \newcommand{\Span}{\mathrm{span}}\) \( \newcommand{\AA}{\unicode[.8,0]{x212B}}\)
\( \newcommand{\vectorA}[1]{\vec{#1}} % arrow\)
\( \newcommand{\vectorAt}[1]{\vec{\text{#1}}} % arrow\)
\( \newcommand{\vectorB}[1]{\overset { \scriptstyle \rightharpoonup} {\mathbf{#1}} } \)
\( \newcommand{\vectorC}[1]{\textbf{#1}} \)
\( \newcommand{\vectorD}[1]{\overrightarrow{#1}} \)
\( \newcommand{\vectorDt}[1]{\overrightarrow{\text{#1}}} \)
\( \newcommand{\vectE}[1]{\overset{-\!-\!\rightharpoonup}{\vphantom{a}\smash{\mathbf {#1}}}} \)
\( \newcommand{\vecs}[1]{\overset { \scriptstyle \rightharpoonup} {\mathbf{#1}} } \)
\(\newcommand{\longvect}{\overrightarrow}\)
\( \newcommand{\vecd}[1]{\overset{-\!-\!\rightharpoonup}{\vphantom{a}\smash {#1}}} \)
\(\newcommand{\avec}{\mathbf a}\) \(\newcommand{\bvec}{\mathbf b}\) \(\newcommand{\cvec}{\mathbf c}\) \(\newcommand{\dvec}{\mathbf d}\) \(\newcommand{\dtil}{\widetilde{\mathbf d}}\) \(\newcommand{\evec}{\mathbf e}\) \(\newcommand{\fvec}{\mathbf f}\) \(\newcommand{\nvec}{\mathbf n}\) \(\newcommand{\pvec}{\mathbf p}\) \(\newcommand{\qvec}{\mathbf q}\) \(\newcommand{\svec}{\mathbf s}\) \(\newcommand{\tvec}{\mathbf t}\) \(\newcommand{\uvec}{\mathbf u}\) \(\newcommand{\vvec}{\mathbf v}\) \(\newcommand{\wvec}{\mathbf w}\) \(\newcommand{\xvec}{\mathbf x}\) \(\newcommand{\yvec}{\mathbf y}\) \(\newcommand{\zvec}{\mathbf z}\) \(\newcommand{\rvec}{\mathbf r}\) \(\newcommand{\mvec}{\mathbf m}\) \(\newcommand{\zerovec}{\mathbf 0}\) \(\newcommand{\onevec}{\mathbf 1}\) \(\newcommand{\real}{\mathbb R}\) \(\newcommand{\twovec}[2]{\left[\begin{array}{r}#1 \\ #2 \end{array}\right]}\) \(\newcommand{\ctwovec}[2]{\left[\begin{array}{c}#1 \\ #2 \end{array}\right]}\) \(\newcommand{\threevec}[3]{\left[\begin{array}{r}#1 \\ #2 \\ #3 \end{array}\right]}\) \(\newcommand{\cthreevec}[3]{\left[\begin{array}{c}#1 \\ #2 \\ #3 \end{array}\right]}\) \(\newcommand{\fourvec}[4]{\left[\begin{array}{r}#1 \\ #2 \\ #3 \\ #4 \end{array}\right]}\) \(\newcommand{\cfourvec}[4]{\left[\begin{array}{c}#1 \\ #2 \\ #3 \\ #4 \end{array}\right]}\) \(\newcommand{\fivevec}[5]{\left[\begin{array}{r}#1 \\ #2 \\ #3 \\ #4 \\ #5 \\ \end{array}\right]}\) \(\newcommand{\cfivevec}[5]{\left[\begin{array}{c}#1 \\ #2 \\ #3 \\ #4 \\ #5 \\ \end{array}\right]}\) \(\newcommand{\mattwo}[4]{\left[\begin{array}{rr}#1 \amp #2 \\ #3 \amp #4 \\ \end{array}\right]}\) \(\newcommand{\laspan}[1]{\text{Span}\{#1\}}\) \(\newcommand{\bcal}{\cal B}\) \(\newcommand{\ccal}{\cal C}\) \(\newcommand{\scal}{\cal S}\) \(\newcommand{\wcal}{\cal W}\) \(\newcommand{\ecal}{\cal E}\) \(\newcommand{\coords}[2]{\left\{#1\right\}_{#2}}\) \(\newcommand{\gray}[1]{\color{gray}{#1}}\) \(\newcommand{\lgray}[1]{\color{lightgray}{#1}}\) \(\newcommand{\rank}{\operatorname{rank}}\) \(\newcommand{\row}{\text{Row}}\) \(\newcommand{\col}{\text{Col}}\) \(\renewcommand{\row}{\text{Row}}\) \(\newcommand{\nul}{\text{Nul}}\) \(\newcommand{\var}{\text{Var}}\) \(\newcommand{\corr}{\text{corr}}\) \(\newcommand{\len}[1]{\left|#1\right|}\) \(\newcommand{\bbar}{\overline{\bvec}}\) \(\newcommand{\bhat}{\widehat{\bvec}}\) \(\newcommand{\bperp}{\bvec^\perp}\) \(\newcommand{\xhat}{\widehat{\xvec}}\) \(\newcommand{\vhat}{\widehat{\vvec}}\) \(\newcommand{\uhat}{\widehat{\uvec}}\) \(\newcommand{\what}{\widehat{\wvec}}\) \(\newcommand{\Sighat}{\widehat{\Sigma}}\) \(\newcommand{\lt}{<}\) \(\newcommand{\gt}{>}\) \(\newcommand{\amp}{&}\) \(\definecolor{fillinmathshade}{gray}{0.9}\)Media
| Title | Level of Approach | Type | Length |
|---|---|---|---|
| Solving Quadratic Inequalities Using Graphs | Intermediate Algebra (Algebra 2) | Lecture | 20:47 |
| Solving Quadratic Inequalities Using Sign Charts | Intermediate Algebra (Algebra 2) | Lecture | 23:56 |
| Applications Involving Quadratic Inequalities | Intermediate Algebra (Algebra 2) | Lecture | 23:20 |
| A Review of Solving Quadratic Inequalities | College Algebra (Algebra 2.5) | Review | 23:01 |
Definitions and Theorems
A quadratic inequality is an inequality that contains a quadratic expression. This inequality can be written in any of the following forms:\[ \begin{array}{lcl}
a x^2+b x+c <0 & \quad & a x^2+b x+c \leq 0 \\[6pt]
a x^2+b x+c>0 & \quad & a x^2+b x+c \geq 0 \\[6pt]
\end{array} \nonumber \]
Methods and Tactics
Graphical Method
If we consider \(f(x) = x^2-x-6\), then solving \(x^2 - x -6 < 0\) corresponds graphically to finding the values of \(x\) for which the graph of \(y=f(x)=x^2-x-6\) (the parabola) is below the graph of \(y=0\) (the \(x\)-axis).

We can see that the graph of \(f\) dips below the \(x\)-axis between its two \(x\)-intercepts. The zeros of \(f\) are \(x=-2\) and \(x=3\) in this case and they divide the domain (the \(x\)-axis) into three intervals: \((-\infty, -2)\), \((-2,3)\) and \((3, \infty)\). For every number in \((-\infty, -2)\), the graph of \(f\) is above the \(x\)-axis; in other words, \(f(x) > 0\) for all \(x\) in \((-\infty, -2)\). Similarly, \(f(x) < 0\) for all \(x\) in \((-2,3)\), and \(f(x) > 0\) for all \(x\) in \((3, \infty)\). Thus, the solution to \(x^2 - x -6 < 0\) is all \( x \) in the interval \( \left( -2,3 \right) \).
The method introduced above (graphing the quadratic function and determining when the graph satisfies the inequality) is called the graphical method of solving a quadratic inequality. This is the method I prefer to teach in my courses because it simultaneously reinforces graphing and it is much faster (in the long run) than the alternative method.
Sign Chart Method
The alternative method is called the sign chart method of solving a quadratic inequality. Like the graphical method, we start by finding the \( x \)-intercepts. We then mark those intercepts on a number line. For example, considering our original inequality \( x^2 - x - 6< 0 \), we would create the sign chart below.

Here, the \((+)\) above a portion of the number line indicates \(f(x) > 0\) for those values of \(x\); the \((-)\) indicates \(f(x) < 0\) there. The numbers labeled on the number line are the zeros of \(f\), so we place \(0\) above them. We see at once that the solution to \(f(x) < 0\) is \((-2,3)\).
An important property of quadratic functions is that if the function is positive at one point and negative at another, the function must have at least one zero in between. Graphically, this means that a parabola can’t be above the \(x\)-axis at one point and below the \(x\)-axis at another point without crossing the \(x\)-axis. This allows us to determine the sign of all of the function values on a given interval by testing the function at just one value in the interval.
Examples
Solve \(x^{2}−6x+8<0\) graphically. Write the solution in interval notation.
Solution:
Step 1: Write the quadratic inequality in standard form.
The inequality is in standard form.
\(x^{2}-6 x+8<0\)
Step 2: Graph the function \(f(x)=a x^{2}+b x+c\) using properties or transformations.
We will graph using the properties.
\(f(x)=x^{2}-6 x+8\)
Look at \(a\) in the equation.
\(\color{red}{a=1, b=-6, c=8}\)
\(f(x)=x^{2}-6 x+8\)
Since \(a\) is positive, the parabola opens upward.
The parabola opens upward.
.png?revision=1)
\(f(x)=x^{2}-6 x+8\)
The axis of symmetry is the line \(x=-\frac{b}{2 a}\).
Axis of Symmetry
\(x=-\frac{b}{2 a}\)
\(\begin{array}{l}{x=-\frac{(-6)}{2 \cdot 1}} \\ {x=3}\end{array}\)
The axis of symmetry is the line \(x=3\).
The vertex is on the axis of symmetry. Substitute \(x=3\) into the function.
Vertex
\(\begin{array}{l}{f(x)=x^{2}-6 x+8} \\ {f(3)=(\color{red}{3}\color{black}{)}^{2}-6(\color{red}{3}\color{black}{)}+8} \\ {f(3)=-1}\end{array}\)
The vertex is \((3,-1)\).
We find \(f(0)\)
\(y\)-intercept
\(\begin{array}{l}{f(x)=x^{2}-6 x+8} \\ {f(0)=(\color{red}{0}\color{black}{)}^{2}-6(\color{red}{0}\color{black}{)}+8} \\ {f(0)=8}\end{array}\)
The \(y\)-intercept is \((0,8)\).
We use the axis of symmetry to find a point symmetric to the \(y\)-intercept. The \(y\)-intercept is \(3\) units left of the axis of symmetry, \(x=3\). A point \(3\) units to the right of the axis of symmetry has \(x=6\).
Point symmetric to \(y\)-intercept
The point is \((6,8)\).
We solve \(f(x)=0\).
\(x\)-intercepts
We can solve this quadratic equation by factoring.
\(\begin{aligned} f(x) &=x^{2}-6 x+8 \\ \color{red}{0} &\color{black}{=}x^{2}-6 x+8 \\ \color{red}{0} &\color{black}{=}(x-2)(x-4) \\ x &=2 \text { or } x=4 \end{aligned}\)
The \(x\)-intercepts are \((2,0)\) and \((4,0)\).
We graph the vertex, intercepts, and the point symmetric to the \(y\)-intercept. We connect these \(5\) points to sketch the parabola.
.png?revision=1)
Step 3: Determine the solution from the graph.
\(x^{2}-6 x+8<0\)
The inequality asks for the values of \(x\) which make the function less than \(0\). Which values of \(x\) make the parabola below the \(x\)-axis.
We do not include the values \(2\), \(4\) as the inequality is less than only.
The solution, in interval notation, is \((2,4)\).
- Solve \(x^{2}+2 x-8<0\) graphically
- Write the solution in interval notation
- Answer
-
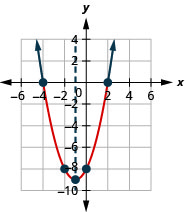
Figure 9.8.4- \((-4,2)\)
- Solve \(x^{2}-8 x+12 \geq 0\) graphically
- Write the solution in interval notation
- Answer
-
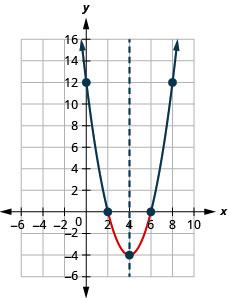
Figure 9.8.5- \((-\infty, 2] \cup[6, \infty)\)
We list the steps to take to solve a quadratic inequality graphically.
Solve a Quadratic Inequality Graphically
- Write the quadratic inequality in standard form.
- Graph the function \(f(x)=ax^{2}+bx+c\).
- Determine the solution from the graph.
In the last example, the parabola opened upward and in the next example, it opens downward. In both cases, we are looking for the part of the parabola that is below the \(x\)-axis but note how the position of the parabola affects the solution.
Solve \(-x^{2}-8 x-12 \leq 0\) graphically. Write the solution in interval notation.
Solution:
| The quadratic inequality in standard form. | \(-x^{2}-8 x-12 \leq 0\) |
|
Graph the function \(f(x)=-x^{2}-8 x-12\) |
The parabola opens downward. 
|
| Find the line of symmetry. | \(\begin{array}{l}{x=-\frac{b}{2 a}} \\ {x=-\frac{-8}{2(-1)}} \\ {x=-4}\end{array}\) |
| Find the vertex. |
\(\begin{aligned} f(x) &=-x^{2}-8 x-12 \\ f(-4) &=-(-4)^{2}-8(-4)-12 \\ f(-4) &=-16+32-12 \\ & f(-4)=4 \end{aligned}\) Vertex \((-4,4)\) |
| Find the \(x\)-intercepts. Let \(f(x)=0\). | \(\begin{aligned} f(x) &=-x^{2}-8 x-12 \\ 0 &=-x^{2}-8 x-12 \end{aligned}\) |
| Factor: Use the Zero Product Property. | \(\begin{array}{l}{0=-1(x+6)(x+2)} \\ {x=-6 \quad x=-2}\end{array}\) |
| Graph the parabola. |
\(x\)-intercepts \((-6,0), (-2.0)\) 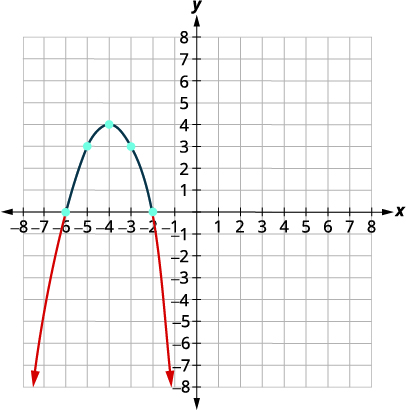
|
| Determine the solution from the graph. We include the \(x\)-intercepts as the inequality is "less than or equal to." | \((-\infty,-6] \cup[-2, \infty)\) |
- Solve \(-x^{2}-6 x-5>0\) graphically
- Write the solution in interval notation
- Answer
-
Figure 9.8.8- \((-5,-1)\)
- Solve \(−x^{2}+10x−16≤0\) graphically
- Write the solution in interval notation
- Answer
-
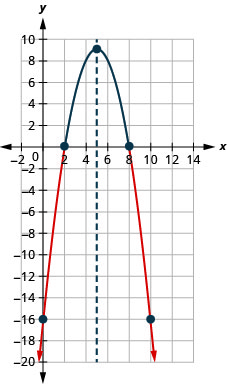
Figure 9.8.9- \((-\infty, 2] \cup[8, \infty)\)
Solve Quadratic Inequalities Algebraically
The algebraic method we will use is very similar to the method we used to solve rational inequalities. We will find the critical points for the inequality, which will be the solutions to the related quadratic equation. Remember a polynomial expression can change signs only where the expression is zero.
We will use the critical points to divide the number line into intervals and then determine whether the quadratic expression will be positive or negative in the interval. We then determine the solution for the inequality.
Solve \(x^{2}-x-12 \geq 0\) algebraically. Write the solution in interval notation.
Solution:
| Step 1: Write the quadratic inequality in standard form. | The inequality is in standard form. | \(x^{2}-x-12 \geq 0\) |
| Step 2: Determine the critical points--the solutions to the related quadratic equation. | Change the inequality sign to an equal sign and then solve the equation. | \(\begin{array}{c}{x^{2}-x-12=0} \\ {(x+3)(x-4)=0} \\ {x+3=0 \quad x-4=0} \\ {x=-3 \quad x=4}\end{array}\) |
| Step 3: Use the critical points to divide the number line into intervals. | Use \(-3\) and \(4\) to divide the number line into intervals. | 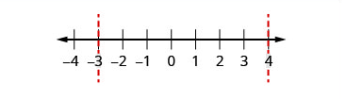.png?revision=1) |
| Step 4: Above the number line show the sign of each quadratic expression using test points from each interval substituted from the original inequality. |
Test: \(x=-5\) \(x=0\) \(x=5\) |
\(\begin{array}{ccc}{x^{2}-x-12} & {x^{2}-x-12} & {x^{2}-x-12} \\ {(-5)^{2}-(-5)-12} & {0^{2}-0-12} & {5^{2}-5-12} \\ {18} & {-12} & {8}\end{array}\) 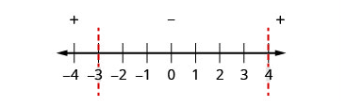.png?revision=1)
|
| Step 5: Determine the intervals where the inequality is correct. Write the solution in interval notation. |
\(x^{2}-x-12 \geq 0\) The inequality is positive in the first and last intervals and equals \(0\) at the points \(-4,3\). |
The solution, in interval notation, is \((-\infty,-3] \cup[4, \infty)\). |
Solve \(x^{2}+2x−8≥0\) algebraically. Write the solution in interval notation.
- Answer
-
\((-\infty,-4] \cup[2, \infty)\)
Solve \(x^{2}−2x−15≤0\) algebraically. Write the solution in interval notation.
- Answer
-
\([-3,5]\)
In this example, since the expression \(x^{2}−x−12\) factors nicely, we can also find the sign in each interval much like we did when we solved rational inequalities. We find the sign of each of the factors, and then the sign of the product. Our number line would like this:
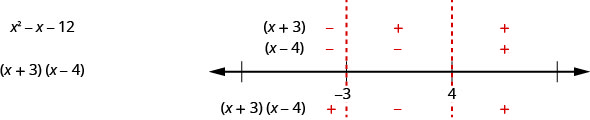
The result is the same as we found using the other method.
We summarize the steps here.
Solve a Quadratic Inequality Algebraically
- Write the quadratic inequality in standard form.
- Determine the critical points—the solutions to the related quadratic equation.
- Use the critical points to divide the number line into intervals.
- Above the number line show the sign of each quadratic expression using test points from each interval substituted into the original inequality.
- Determine the intervals where the inequality is correct. Write the solution in interval notation.
Solve \(x^{2}+6x−7≥0\) algebraically. Write the solution in interval notation.
Solution:
| Write the quadratic inequality in standard form. | \(-x^{2}+6 x-7 \geq 0\) |
| Multiply both sides of the inequality by \(-1\). Remember to reverse the inequality sign. | \(x^{2}-6 x+7 \leq 0\) |
| Determine the critical points by solving the related quadratic equation. | \(x^{2}-6 x+7=0\) |
| Write the Quadratic Formula. | \(x=\frac{-b \pm \sqrt{b^{2}-4 a c}}{2 a}\) |
| Then substitute in the values of \(a, b, c\). | \(x=\frac{-(-6) \pm \sqrt{(-6)^{2}-4 \cdot 1 \cdot(7)}}{2 \cdot 1}\) |
| Simplify. | \(x=\frac{6 \pm \sqrt{8}}{2}\) |
| Simplify the radical. | \(x=\frac{6 \pm 2 \sqrt{2}}{2}\) |
| Remove the common factor, \(2\). | \(\begin{array}{l}{x=\frac{2(3 \pm \sqrt{2})}{2}} \\ {x=3 \pm \sqrt{2}} \\ {x=3+\sqrt{2}} \quad x=3-\sqrt{2} \\ {x \approx 1.6}\quad\quad\:\:\: x\approx 4.4\end{array}\) |
| Use the critical points to divide the number line into intervals. Test numbers from each interval in the original inequality. | 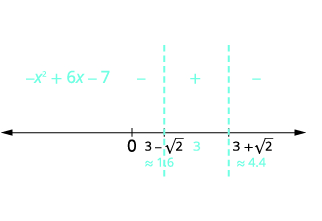 |
| Determine the intervals where the inequality is correct. Write the solution in interval notation. | \(-x^{2}+6 x-7 \geq 0\) in the middle interval \([3-\sqrt{2}, 3+\sqrt{2}]\) |
Solve \(−x^{2}+2x+1≥0\) algebraically. Write the solution in interval notation.
- Answer
-
\([-1-\sqrt{2},-1+\sqrt{2}]\)
Solve \(−x^{2}+8x−14<0\) algebraically. Write the solution in interval notation.
- Answer
-
\((-\infty, 4-\sqrt{2}) \cup(4+\sqrt{2}, \infty)\)
The solutions of the quadratic inequalities in each of the previous examples, were either an interval or the union of two intervals. This resulted from the fact that, in each case we found two solutions to the corresponding quadratic equation \(ax^{2}+bx+c=0\). These two solutions then gave us either the two \(x\)-intercepts for the graph or the two critical points to divide the number line into intervals.
This correlates to our previous discussion of the number and type of solutions to a quadratic equation using the discriminant.
For a quadratic equation of the form \(ax^{2}+bc+c=0, a≠0\).
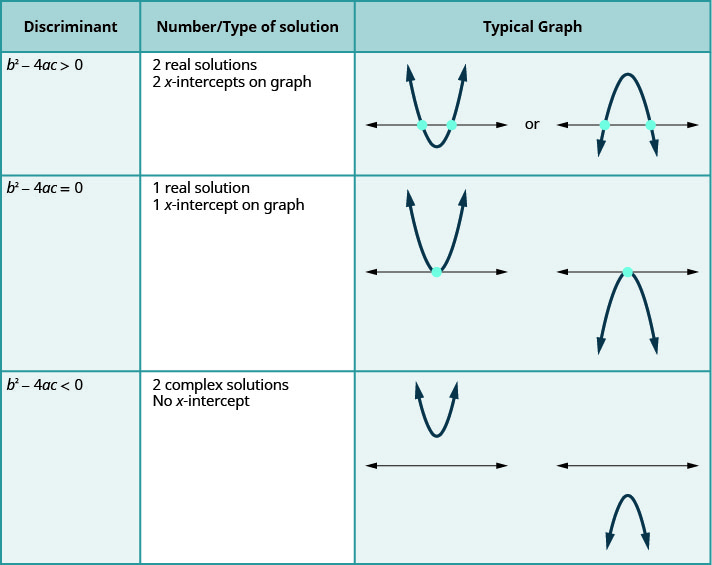
The last row of the table shows us when the parabolas never intersect the \(x\)-axis. Using the Quadratic Formula to solve the quadratic equation, the radicand is a negative. We get two complex solutions.
In the next example, the quadratic inequality solutions will result from the solution of the quadratic equation being complex.
Solve, writing any solution in interval notation:
- \(x^{2}-3 x+4>0\)
- \(x^{2}-3 x+4 \leq 0\)
Solution:
a.
| Write the quadratic inequality in standard form. | \(-x^{2}-3 x+4>0\) |
| Determine the critical points by solving the related quadratic equation. | \(x^{2}-3 x+4=0\) |
| Write the Quadratic Formula. | \(x=\frac{-b \pm \sqrt{b^{2}-4 a c}}{2 a}\) |
| Then substitute in the values of \(a, b, c\). | \(x=\frac{-(-3) \pm \sqrt{(-3)^{2}-4 \cdot 1 \cdot(4)}}{2 \cdot 1}\) |
| Simplify. | \(x=\frac{3 \pm \sqrt{-7}}{2}\) |
| Simplify the radicand. | \(x=\frac{3 \pm \sqrt{7 i}}{2}\) |
| The complex solutions tell us the parabola does not intercept the \(x\)-axis. Also, the parabola opens upward. This tells us that the parabola is completely above the \(x\)-axis. |
Complex solutions 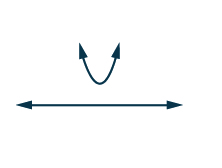
|
We are to find the solution to \(x^{2}−3x+4>0\). Since for all values of \(x\) the graph is above the \(x\)-axis, all values of \(x\) make the inequality true. In interval notation we write \((−∞,∞)\).
b. Write the quadratic inequality in standard form.
\(x^{2}-3 x+4 \leq 0\)
Determine the critical points by solving the related quadratic equation.
\(x^{2}-3 x+4=0\)
Since the corresponding quadratic equation is the same as in part (a), the parabola will be the same. The parabola opens upward and is completely above the \(x\)-axis—no part of it is below the \(x\)-axis.
We are to find the solution to \(x^{2}−3x+4≤0\). Since for all values of \(x\) the graph is never below the \(x\)-axis, no values of \(x\) make the inequality true. There is no solution to the inequality.
Solve and write any solution in interval notation:
- \(-x^{2}+2 x-4 \leq 0\)
- \(-x^{2}+2 x-4 \geq 0\)
- Answer
-
- \((-\infty, \infty)\)
- no solution
Solve and write any solution in interval notation:
- \(x^{2}+3 x+3<0\)
- \(x^{2}+3 x+3>0\)
- Answer
-
- no solution
- \((-\infty, \infty)\)
Key Concepts
- Solve a Quadratic Inequality Graphically
- Write the quadratic inequality in standard form.
- Graph the function \(f(x)=ax^{2}+bx+c\) using properties or transformations.
- Determine the solution from the graph.
- How to Solve a Quadratic Inequality Algebraically
- Write the quadratic inequality in standard form.
- Determine the critical points -- the solutions to the related quadratic equation.
- Use the critical points to divide the number line into intervals.
- Above the number line show the sign of each quadratic expression using test points from each interval substituted into the original inequality.
- Determine the intervals where the inequality is correct. Write the solution in interval notation.
Glossary
- quadratic inequality
- A quadratic inequality is an inequality that contains a quadratic expression.