Mathematics LibreTexts

26.3: N1.03- Section 2 Part 1

  • Page ID
    51762
  • \( \newcommand{\vecs}[1]{\overset { \scriptstyle \rightharpoonup} {\mathbf{#1}} } \) \( \newcommand{\vecd}[1]{\overset{-\!-\!\rightharpoonup}{\vphantom{a}\smash {#1}}} \)\(\newcommand{\id}{\mathrm{id}}\) \( \newcommand{\Span}{\mathrm{span}}\) \( \newcommand{\kernel}{\mathrm{null}\,}\) \( \newcommand{\range}{\mathrm{range}\,}\) \( \newcommand{\RealPart}{\mathrm{Re}}\) \( \newcommand{\ImaginaryPart}{\mathrm{Im}}\) \( \newcommand{\Argument}{\mathrm{Arg}}\) \( \newcommand{\norm}[1]{\| #1 \|}\) \( \newcommand{\inner}[2]{\langle #1, #2 \rangle}\) \( \newcommand{\Span}{\mathrm{span}}\) \(\newcommand{\id}{\mathrm{id}}\) \( \newcommand{\Span}{\mathrm{span}}\) \( \newcommand{\kernel}{\mathrm{null}\,}\) \( \newcommand{\range}{\mathrm{range}\,}\) \( \newcommand{\RealPart}{\mathrm{Re}}\) \( \newcommand{\ImaginaryPart}{\mathrm{Im}}\) \( \newcommand{\Argument}{\mathrm{Arg}}\) \( \newcommand{\norm}[1]{\| #1 \|}\) \( \newcommand{\inner}[2]{\langle #1, #2 \rangle}\) \( \newcommand{\Span}{\mathrm{span}}\)\(\newcommand{\AA}{\unicode[.8,0]{x212B}}\)

    Section 2: Gradual transition between two steady values—Logistic models

    Basic logistic formula: y=\frac{1}{1+{{0.018316}^{(rate\cdot{x})}}}  

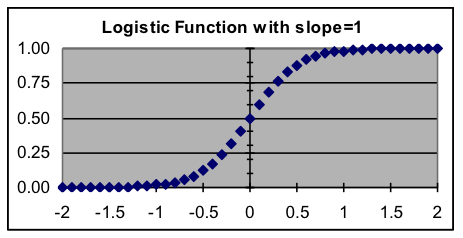
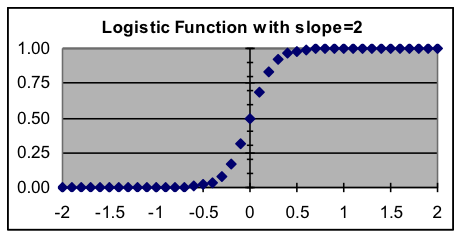
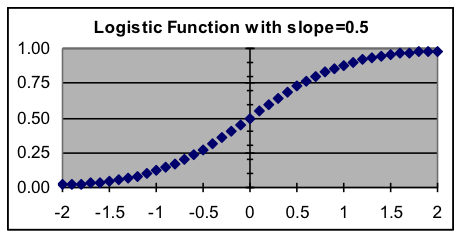
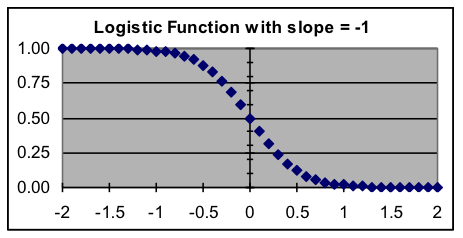
    Even though the formula above looks somewhat strange, its graph is actually rather simple. The graph starts by being almost horizontal barely above zero at the far left, then smoothly transitions through a midpoint to again become almost horizontal barely below one on the far right. The basic logistic function has its largest rate of change at the midpoint, where its slope equals the rate parameter.

    [Optional math fact: Where does the 0.018316 in the formula come from? Actually, any positive number except 1.0 could be used as the base of the exponent and you would still get a logistic graph – it would just have a different slope at the center. The value 0.018316 is used because it makes the slope at the center equal the rate parameter.]

    In the basic logistic formula, the only parameter is the rate of change at the center. Here are some examples of the effect of different values for that slope. In all cases, the x-axis scale is from –2 to +2.

     219.png  314.png
     48.png  54.png

    Spreadsheet formula for basic logistic: =1/(1+0.018316^($G$3*A3)


    CC licensed content, Shared previously
    • Mathematics for Modeling. Authored by: Mary Parker and Hunter Ellinger. License: CC BY: Attribution

    26.3: N1.03- Section 2 Part 1 is shared under a not declared license and was authored, remixed, and/or curated by LibreTexts.

    • Was this article helpful?