
2.3: Venn Diagrams and Euler Diagrams
- Page ID
- 4871

\( \newcommand{\vecs}[1]{\overset { \scriptstyle \rightharpoonup} {\mathbf{#1}} } \)
\( \newcommand{\vecd}[1]{\overset{-\!-\!\rightharpoonup}{\vphantom{a}\smash {#1}}} \)
\( \newcommand{\dsum}{\displaystyle\sum\limits} \)
\( \newcommand{\dint}{\displaystyle\int\limits} \)
\( \newcommand{\dlim}{\displaystyle\lim\limits} \)
\( \newcommand{\id}{\mathrm{id}}\) \( \newcommand{\Span}{\mathrm{span}}\)
( \newcommand{\kernel}{\mathrm{null}\,}\) \( \newcommand{\range}{\mathrm{range}\,}\)
\( \newcommand{\RealPart}{\mathrm{Re}}\) \( \newcommand{\ImaginaryPart}{\mathrm{Im}}\)
\( \newcommand{\Argument}{\mathrm{Arg}}\) \( \newcommand{\norm}[1]{\| #1 \|}\)
\( \newcommand{\inner}[2]{\langle #1, #2 \rangle}\)
\( \newcommand{\Span}{\mathrm{span}}\)
\( \newcommand{\id}{\mathrm{id}}\)
\( \newcommand{\Span}{\mathrm{span}}\)
\( \newcommand{\kernel}{\mathrm{null}\,}\)
\( \newcommand{\range}{\mathrm{range}\,}\)
\( \newcommand{\RealPart}{\mathrm{Re}}\)
\( \newcommand{\ImaginaryPart}{\mathrm{Im}}\)
\( \newcommand{\Argument}{\mathrm{Arg}}\)
\( \newcommand{\norm}[1]{\| #1 \|}\)
\( \newcommand{\inner}[2]{\langle #1, #2 \rangle}\)
\( \newcommand{\Span}{\mathrm{span}}\) \( \newcommand{\AA}{\unicode[.8,0]{x212B}}\)
\( \newcommand{\vectorA}[1]{\vec{#1}} % arrow\)
\( \newcommand{\vectorAt}[1]{\vec{\text{#1}}} % arrow\)
\( \newcommand{\vectorB}[1]{\overset { \scriptstyle \rightharpoonup} {\mathbf{#1}} } \)
\( \newcommand{\vectorC}[1]{\textbf{#1}} \)
\( \newcommand{\vectorD}[1]{\overrightarrow{#1}} \)
\( \newcommand{\vectorDt}[1]{\overrightarrow{\text{#1}}} \)
\( \newcommand{\vectE}[1]{\overset{-\!-\!\rightharpoonup}{\vphantom{a}\smash{\mathbf {#1}}}} \)
\( \newcommand{\vecs}[1]{\overset { \scriptstyle \rightharpoonup} {\mathbf{#1}} } \)
\(\newcommand{\longvect}{\overrightarrow}\)
\( \newcommand{\vecd}[1]{\overset{-\!-\!\rightharpoonup}{\vphantom{a}\smash {#1}}} \)
\(\newcommand{\avec}{\mathbf a}\) \(\newcommand{\bvec}{\mathbf b}\) \(\newcommand{\cvec}{\mathbf c}\) \(\newcommand{\dvec}{\mathbf d}\) \(\newcommand{\dtil}{\widetilde{\mathbf d}}\) \(\newcommand{\evec}{\mathbf e}\) \(\newcommand{\fvec}{\mathbf f}\) \(\newcommand{\nvec}{\mathbf n}\) \(\newcommand{\pvec}{\mathbf p}\) \(\newcommand{\qvec}{\mathbf q}\) \(\newcommand{\svec}{\mathbf s}\) \(\newcommand{\tvec}{\mathbf t}\) \(\newcommand{\uvec}{\mathbf u}\) \(\newcommand{\vvec}{\mathbf v}\) \(\newcommand{\wvec}{\mathbf w}\) \(\newcommand{\xvec}{\mathbf x}\) \(\newcommand{\yvec}{\mathbf y}\) \(\newcommand{\zvec}{\mathbf z}\) \(\newcommand{\rvec}{\mathbf r}\) \(\newcommand{\mvec}{\mathbf m}\) \(\newcommand{\zerovec}{\mathbf 0}\) \(\newcommand{\onevec}{\mathbf 1}\) \(\newcommand{\real}{\mathbb R}\) \(\newcommand{\twovec}[2]{\left[\begin{array}{r}#1 \\ #2 \end{array}\right]}\) \(\newcommand{\ctwovec}[2]{\left[\begin{array}{c}#1 \\ #2 \end{array}\right]}\) \(\newcommand{\threevec}[3]{\left[\begin{array}{r}#1 \\ #2 \\ #3 \end{array}\right]}\) \(\newcommand{\cthreevec}[3]{\left[\begin{array}{c}#1 \\ #2 \\ #3 \end{array}\right]}\) \(\newcommand{\fourvec}[4]{\left[\begin{array}{r}#1 \\ #2 \\ #3 \\ #4 \end{array}\right]}\) \(\newcommand{\cfourvec}[4]{\left[\begin{array}{c}#1 \\ #2 \\ #3 \\ #4 \end{array}\right]}\) \(\newcommand{\fivevec}[5]{\left[\begin{array}{r}#1 \\ #2 \\ #3 \\ #4 \\ #5 \\ \end{array}\right]}\) \(\newcommand{\cfivevec}[5]{\left[\begin{array}{c}#1 \\ #2 \\ #3 \\ #4 \\ #5 \\ \end{array}\right]}\) \(\newcommand{\mattwo}[4]{\left[\begin{array}{rr}#1 \amp #2 \\ #3 \amp #4 \\ \end{array}\right]}\) \(\newcommand{\laspan}[1]{\text{Span}\{#1\}}\) \(\newcommand{\bcal}{\cal B}\) \(\newcommand{\ccal}{\cal C}\) \(\newcommand{\scal}{\cal S}\) \(\newcommand{\wcal}{\cal W}\) \(\newcommand{\ecal}{\cal E}\) \(\newcommand{\coords}[2]{\left\{#1\right\}_{#2}}\) \(\newcommand{\gray}[1]{\color{gray}{#1}}\) \(\newcommand{\lgray}[1]{\color{lightgray}{#1}}\) \(\newcommand{\rank}{\operatorname{rank}}\) \(\newcommand{\row}{\text{Row}}\) \(\newcommand{\col}{\text{Col}}\) \(\renewcommand{\row}{\text{Row}}\) \(\newcommand{\nul}{\text{Nul}}\) \(\newcommand{\var}{\text{Var}}\) \(\newcommand{\corr}{\text{corr}}\) \(\newcommand{\len}[1]{\left|#1\right|}\) \(\newcommand{\bbar}{\overline{\bvec}}\) \(\newcommand{\bhat}{\widehat{\bvec}}\) \(\newcommand{\bperp}{\bvec^\perp}\) \(\newcommand{\xhat}{\widehat{\xvec}}\) \(\newcommand{\vhat}{\widehat{\vvec}}\) \(\newcommand{\uhat}{\widehat{\uvec}}\) \(\newcommand{\what}{\widehat{\wvec}}\) \(\newcommand{\Sighat}{\widehat{\Sigma}}\) \(\newcommand{\lt}{<}\) \(\newcommand{\gt}{>}\) \(\newcommand{\amp}{&}\) \(\definecolor{fillinmathshade}{gray}{0.9}\)It is often helpful when working with sets and their operations, to use Venn diagrams:
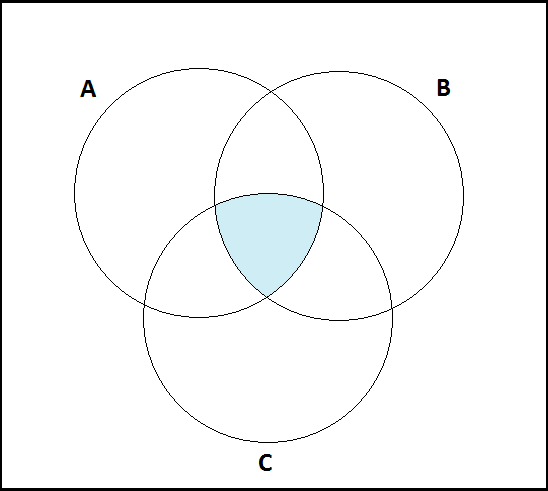
Example \(\PageIndex{1}\): \((A \cap B) \cap C\)
Consider \((A \cap B) \cap C\):
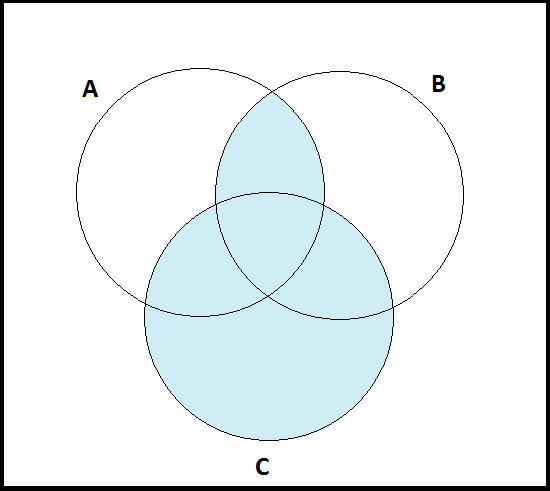
Example \(\PageIndex{2}\): \((A \cap B) \cup C\)
Consider \((A \cap B) \cup C\):
Now consider \((A \cup C) \cap (B \cup C)\):
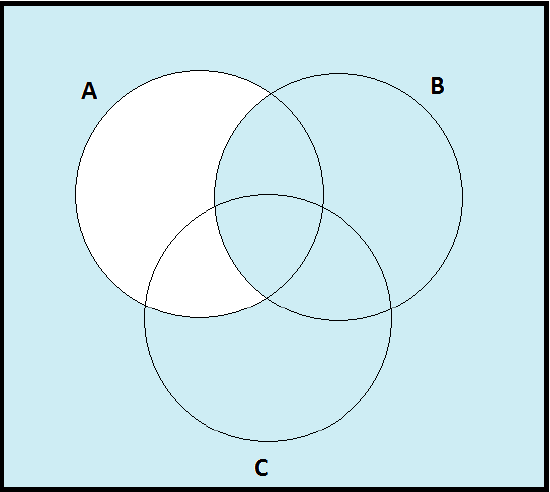
Example \(\PageIndex{3}\):
Consider \(A\)c\(\cup B\):
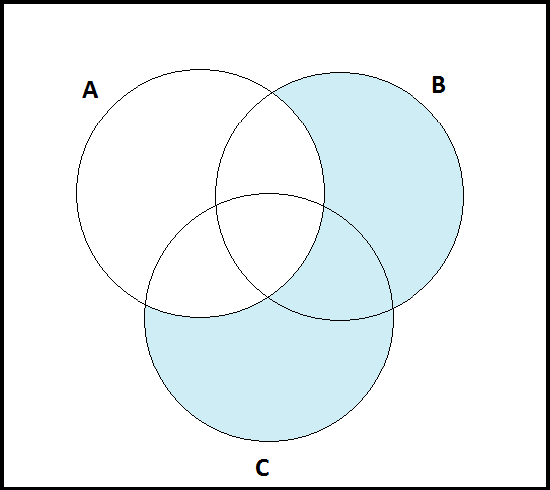
Example \(\PageIndex{4}\):
Consider \(A\)c\(\cap (B \cup C)\):
Another use of Venn diagrams illustrates the following result:
Definition: Term
Let \( n(A)=\) number of elements in the set \(A.\) Then for any two finite sets \(A\) and \(B,\) \(n(A \cup B)=n(A)+n(B)-n(A \cap B).\)
Example \(\PageIndex{5}\):
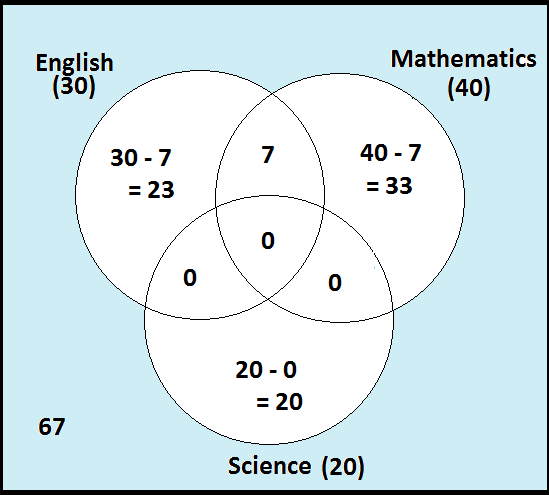
A survey was taken of 150 University first-year students. 40 of them were majoring in Mathematics, 30 of them were majoring in English, 20 were majoring in Science, 7 had a double major of Mathematics and English, and none had double (triple) major with Science. How many students had majors other than Mathematics, English, or Science?
Let's use a Venn diagram to get started, shall we?
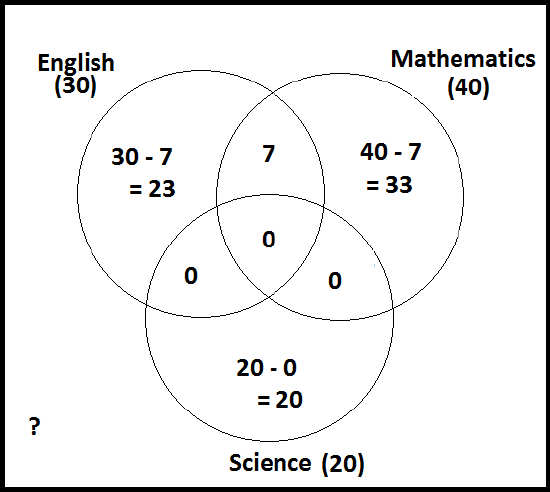
So, we know that \(n = 150\), and we can calculate how many students we have currently accounted for:
\[s = \Sigma \{23 + 33 + 20 + 7\} = 83\]
Using this, we can work out how many students we haven't counted yet:
\[150 - 83 = 67.\]
So 67 students had majors that were not in our three categories.
Example \(\PageIndex{6}\):
Suppose a group of students on a college campus is asked to compare some animated future films, and the following information is produced.
- 37 like "Beauty and the Beast"
- 26 like "The Boss Baby"
- 25 like "The Lion King"
- 16 like "Beauty and the Beast" and "The Boss Baby"
- 12 like "Beauty and the Beast" and "The Lion King"
- 10 like "The Boss Baby" and "The Lion King"
- 4 like all three films
- 5 like none of these films.
- How many students liked "The Lion King" only?
- How many students liked only two of the films?
- How many students were surveyed?
Let's use a Venn diagram to help us sort it out:
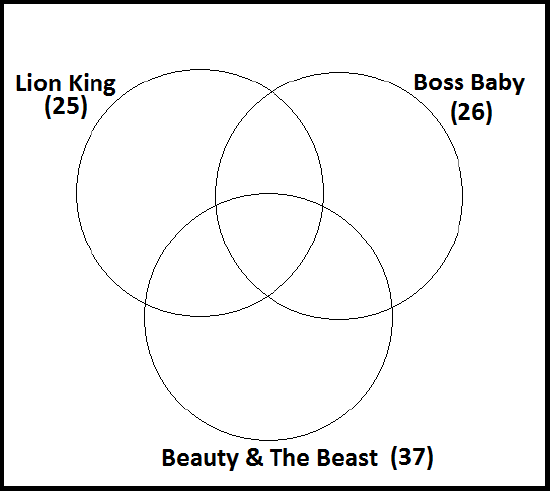
Here we know the total number of votes received for each movie, but some people may have voted twice! So, using the data, we will fill in the intersecting sections first:
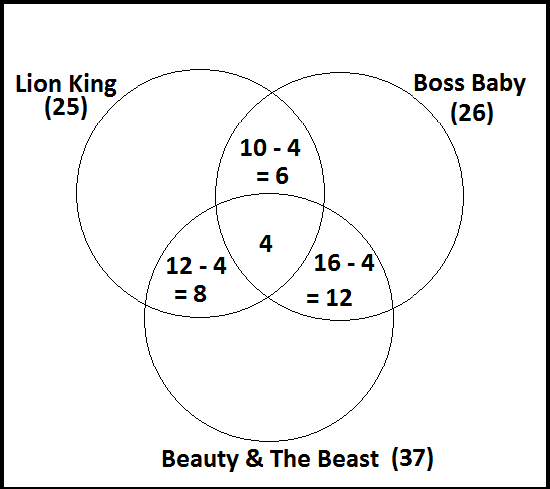
Now we can use the data to fill in the rest, before answering questions. Don't forget to include those in \(U\) that don't fall in any other category:

Now that we have a clear picture, we can begin to answer the questions:
1. How many students liked "The Lion King" only?
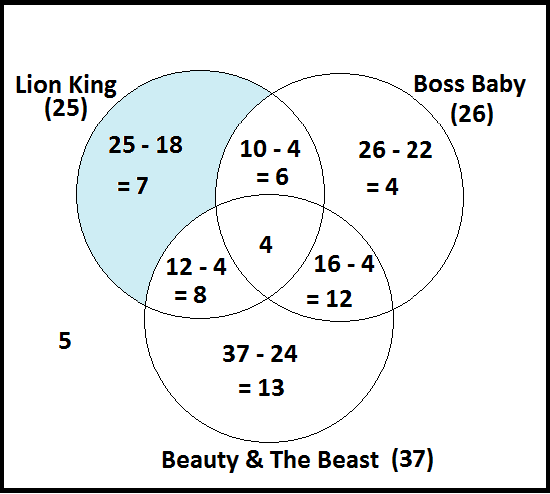
So our answer is: 'Seven students liked "The Lion King" only.'
2. How many students liked only two movies?
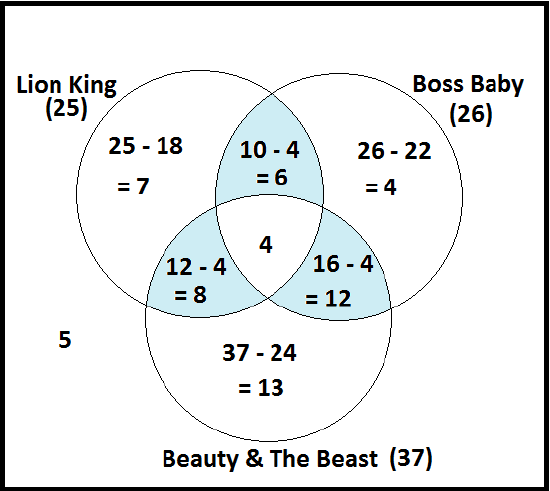
Our answer is: \(8 + 6 + 12 = 26\) (the sum of the three highlighted sections), so "26 students liked only two movies."
3. What was the total number of students surveyed?
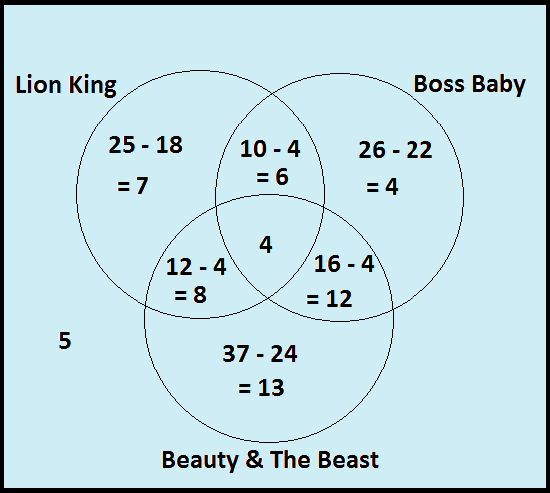
We begin by adding the values of each section:
\(n = \Sigma \{7, 4, 13, 6, 12, 8, 4, 5\} = 59\)
So, our answer is: "59 students were surveyed."
Summary
Let \( n(A)=|A|=\) number of elements in the set \(A.\) Then for any two sets \(A\) and \(B,\) \(n(A \cup B)=n(A)+n(B)-n(A \cap B).\)
Euler Diagram
Euler Diagram shows relevant relationships between sets while the Venn diagram shows all possibilities.
Thinking out Loud
Can you think of an example of an Euler diagram?