
5.1E:

( \newcommand{\kernel}{\mathrm{null}\,}\)
Exercise 5.1E.1
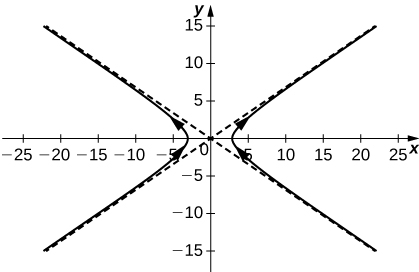
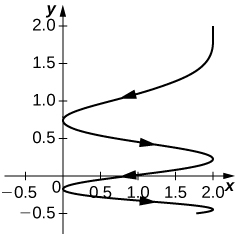
1) Give the component functions x=f(t) and y=g(t) for the vector-valued function r(t)=3secti+2tantj.
Given r(t)=3secti+2tantj, find the following values (if possible).
- r(π4)
- r(π)
- r(π2)
Sketch the curve of the vector-valued function r(t)=3secti+2tantj and give the orientation of the curve. Sketch asymptotes as a guide to the graph.
2)
Evaluate limt→0⟨eti+sinttj+e−tk⟩
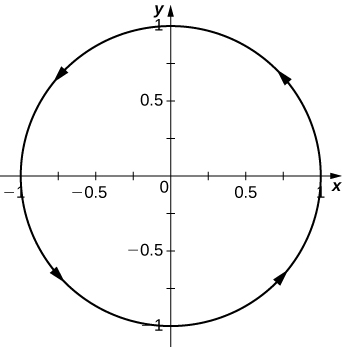
3) Given the vector-valued function r(t)=⟨cost,sint⟩ find the following values:
- limt→π4r(t)
- r(π3)
- Is r(t) continuous at t=π3?
- Graph r(t).
- Answer
-
3) a. ⟨√22,√22⟩, b. ⟨12,√32⟩, c. Yes, the limit as t approaches π3 is equal to r(π3), d.
Exercise 5.1E.2
1) Given the vector-valued function r(t)=⟨t,t2+1⟩, find the following values:
- limt→−3r(t)
- r(−3)
- Is r(t) continuous at x=−3?
- r(t+2)−r(t)
2) Let r(t)=eti+sintj+lntk. Find the following values:
- r(π4)
- limt→π4r(t)
- Is r(t) continuous at t=t=π4?
- Answer
-
a. ⟨eπ4,√22,ln(π4)⟩; b. ⟨eπ4,√22,ln(π4)⟩; c. Yes
Exercise 5.1E.3
Find the limit of the following vector-valued functions at the indicated value of t.
1) limt→4⟨√t−3,√t−2t−4,tan(πt)⟩
2) limt→π2r(t) for r(t)=eti+sintj+lntk
3) limt→∞⟨e−2t,2t+33t−1,arctan(2t)⟩
4) limt→e2⟨tln(t),lntt2,√ln(t2)⟩
5) limt→π6⟨cos2t,sin2t,1⟩
6) limt→∞r(t) for r(t)=2e−ti+e−tj+ln(t−1)k
- Answer
-
2) ⟨eπ2,1,ln(π2)⟩
4) 2e2i+2e4j+2k
6) The limit does not exist because the limit of ln(t−1) as t approaches infinity does not exist.
Exercise 5.1E.4
Describe the curve defined by the vector-valued function r(t)=(1+t)i+(2+5t)j+(−1+6t)k.
- Answer
-
Add texts here. Do not delete this text first.
Exercise 5.1E.5
Find the domain of the vector-valued functions.
1) r(t)=⟨t2,tant,lnt⟩
2) r(t)=⟨t2,√t−3,32t+1⟩
3) r(t)=⟨csc(t),1√t−3,ln(t−2)⟩
- Answer
-
1) t>0,t≠(2k+1)π2, where k is an integer.
3) t>3,t≠nπ, where n is an integer.
Exercise 5.1E.6
Let r(t)=⟨cost,t,sint⟩ and use it to answer the following questions.
For what values of t is r(t) continuous?
Sketch the graph of r(t).
- Answer
-
Exercise 5.1E.7
1) Find the domain of r(t)=2e−ti+e−tj+ln(t−1)k.
2) For what values of t is r(t)=2e−tSi+e−tj+ln(t−1)k continuous?
- Answer
-
2) All t such that t∈(1,∞)
Exercise 5.1E.8
Eliminate the parameter t, write the equation in Cartesian coordinates, then sketch the graphs of the vector-valued functions. (Hint: Let x=2t and y=t2 Solve the first equation for x in terms of t and substitute this result into the second equation.)
1) r(t)=2ti+t2j
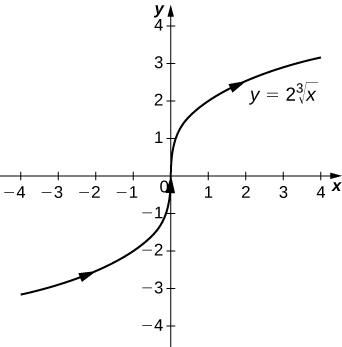
2) r(t)=t3i+2tj
3) r(t)=2(sinht)i+2(cosht)j,t>0
4) r(t)=3(cost)i+3(sint)j
5) r(t)=⟨3sint,3cost⟩
- Answer
-
2) y=23√x, a variation of the cube-root function
4)
x2+y2=9, a circle centered at (0,0) with radius 3, and a counterclockwise orientation

Exercise 5.1E.9
Use a graphing utility to sketch each of the following vector-valued functions:
1) [T] r(t)=2cost2i+(2−√t)j
2) [T] r(t)=⟨ecos(3t),e−sin(t)⟩
3) [T] r(t)=⟨2−sin(2t),3+2cost⟩
- Answer
-
1)
2)
Exercise 5.1E.10
Find a vector-valued function that traces out the given curve in the indicated direction.
1) 4x2+9y2=36; clockwise and counterclockwise
2) r(t)=⟨t,t2⟩; from left to right
- Answer
-
2) For left to right, y=x2, where t increases.
Exercise 5.1E.11
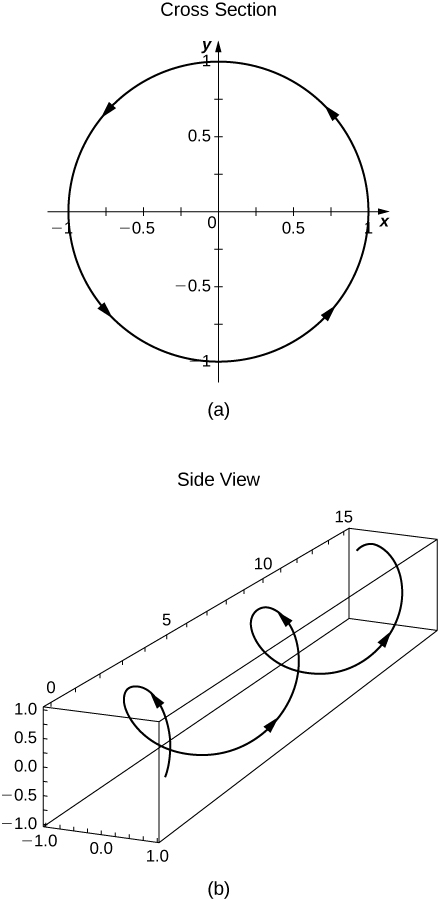
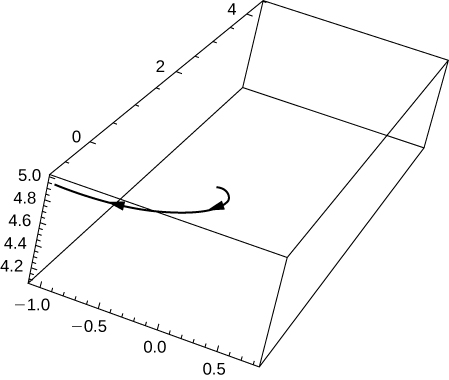
Consider the curve described by the vector-valued function r(t)=(50e−tcost)i+(50e−tsint)j+(5−5e−t)k.
1) What is the initial point of the path corresponding to r(0)?
2) What is limt→∞r(t)?
3) [T] Use technology to sketch the curve.
- Answer
-
1) (50,0,0)
2)
Exercise 5.1E.11
Consider the curve described by the vector-valued function r(t)=(50e−tcost)i+(50e−tsint)j+(5−5e−t)k.
1) What is the initial point of the path corresponding to r(0)?
2) What is limt→∞r(t)?
3) [T] Use technology to sketch the curve.
4) Eliminate the parameter t to show that z=5−r10 where r=x2+y2.
- Answer
-
1) (50,0,0)
3)
Exercise 5.1E.12
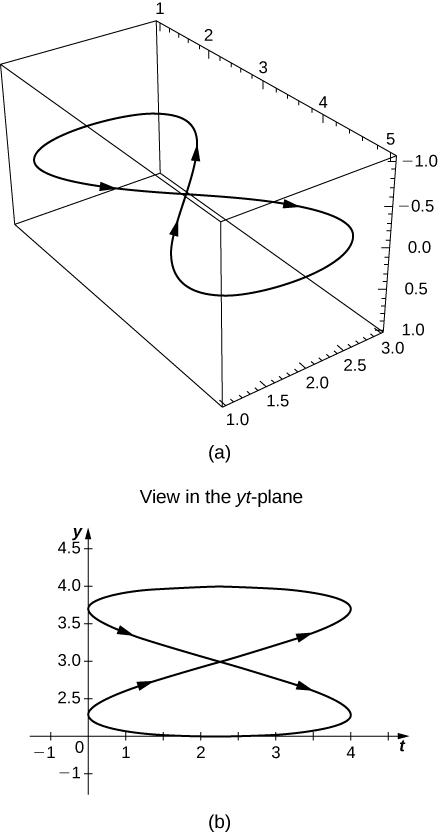
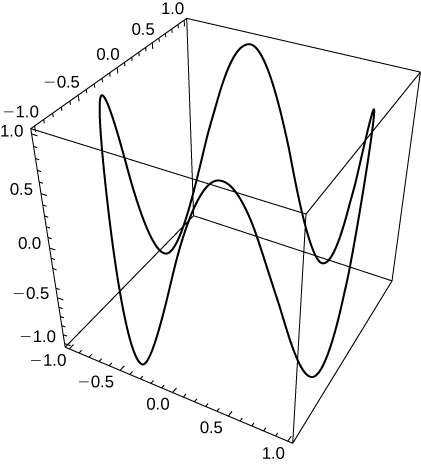
1) [T] Let r(t)=costi+sintj+0.3sin(2t)k. Use technology to graph the curve (called the roller-coaster curve) over the interval [0,2π). Choose at least two views to determine the peaks and valleys.
2) [T] Use the result of the preceding problem to construct an equation of a roller coaster with a steep drop from the peak and steep incline from the “valley.” Then, use technology to graph the equation.
3) Use the results of the preceding two problems to construct an equation of a path of a roller coaster with more than two turning points (peaks and valleys).
- Answer
-
1)
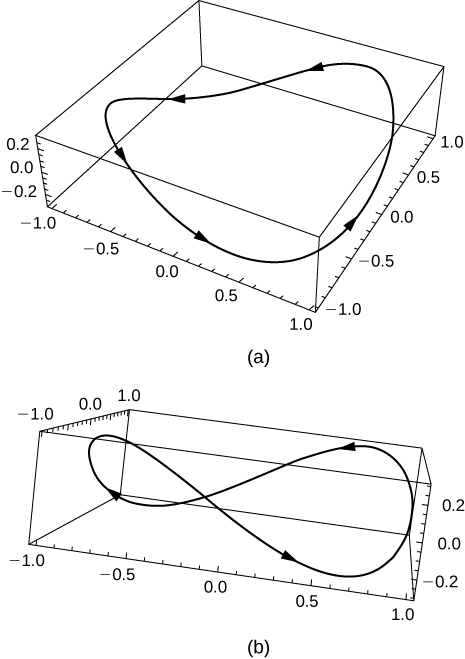
3)
One possibility is r(t)=costi+sintj+sin(4t)k. By increasing the coefficient of t in the third component, the number of turning points will increase.
Exercise 5.1E.13
- Graph the curve r(t)=(4+cos(18t))cos(t)i+(4+cos(18t)sin(t))j+0.3sin(18t)k using two viewing angles of your choice to see the overall shape of the curve.
- Does the curve resemble a “slinky”?
- What changes to the equation should be made to increase the number of coils of the slinky?