
4.2: Node Attributes
- Page ID
- 7666

\( \newcommand{\vecs}[1]{\overset { \scriptstyle \rightharpoonup} {\mathbf{#1}} } \)
\( \newcommand{\vecd}[1]{\overset{-\!-\!\rightharpoonup}{\vphantom{a}\smash {#1}}} \)
\( \newcommand{\dsum}{\displaystyle\sum\limits} \)
\( \newcommand{\dint}{\displaystyle\int\limits} \)
\( \newcommand{\dlim}{\displaystyle\lim\limits} \)
\( \newcommand{\id}{\mathrm{id}}\) \( \newcommand{\Span}{\mathrm{span}}\)
( \newcommand{\kernel}{\mathrm{null}\,}\) \( \newcommand{\range}{\mathrm{range}\,}\)
\( \newcommand{\RealPart}{\mathrm{Re}}\) \( \newcommand{\ImaginaryPart}{\mathrm{Im}}\)
\( \newcommand{\Argument}{\mathrm{Arg}}\) \( \newcommand{\norm}[1]{\| #1 \|}\)
\( \newcommand{\inner}[2]{\langle #1, #2 \rangle}\)
\( \newcommand{\Span}{\mathrm{span}}\)
\( \newcommand{\id}{\mathrm{id}}\)
\( \newcommand{\Span}{\mathrm{span}}\)
\( \newcommand{\kernel}{\mathrm{null}\,}\)
\( \newcommand{\range}{\mathrm{range}\,}\)
\( \newcommand{\RealPart}{\mathrm{Re}}\)
\( \newcommand{\ImaginaryPart}{\mathrm{Im}}\)
\( \newcommand{\Argument}{\mathrm{Arg}}\)
\( \newcommand{\norm}[1]{\| #1 \|}\)
\( \newcommand{\inner}[2]{\langle #1, #2 \rangle}\)
\( \newcommand{\Span}{\mathrm{span}}\) \( \newcommand{\AA}{\unicode[.8,0]{x212B}}\)
\( \newcommand{\vectorA}[1]{\vec{#1}} % arrow\)
\( \newcommand{\vectorAt}[1]{\vec{\text{#1}}} % arrow\)
\( \newcommand{\vectorB}[1]{\overset { \scriptstyle \rightharpoonup} {\mathbf{#1}} } \)
\( \newcommand{\vectorC}[1]{\textbf{#1}} \)
\( \newcommand{\vectorD}[1]{\overrightarrow{#1}} \)
\( \newcommand{\vectorDt}[1]{\overrightarrow{\text{#1}}} \)
\( \newcommand{\vectE}[1]{\overset{-\!-\!\rightharpoonup}{\vphantom{a}\smash{\mathbf {#1}}}} \)
\( \newcommand{\vecs}[1]{\overset { \scriptstyle \rightharpoonup} {\mathbf{#1}} } \)
\(\newcommand{\longvect}{\overrightarrow}\)
\( \newcommand{\vecd}[1]{\overset{-\!-\!\rightharpoonup}{\vphantom{a}\smash {#1}}} \)
\(\newcommand{\avec}{\mathbf a}\) \(\newcommand{\bvec}{\mathbf b}\) \(\newcommand{\cvec}{\mathbf c}\) \(\newcommand{\dvec}{\mathbf d}\) \(\newcommand{\dtil}{\widetilde{\mathbf d}}\) \(\newcommand{\evec}{\mathbf e}\) \(\newcommand{\fvec}{\mathbf f}\) \(\newcommand{\nvec}{\mathbf n}\) \(\newcommand{\pvec}{\mathbf p}\) \(\newcommand{\qvec}{\mathbf q}\) \(\newcommand{\svec}{\mathbf s}\) \(\newcommand{\tvec}{\mathbf t}\) \(\newcommand{\uvec}{\mathbf u}\) \(\newcommand{\vvec}{\mathbf v}\) \(\newcommand{\wvec}{\mathbf w}\) \(\newcommand{\xvec}{\mathbf x}\) \(\newcommand{\yvec}{\mathbf y}\) \(\newcommand{\zvec}{\mathbf z}\) \(\newcommand{\rvec}{\mathbf r}\) \(\newcommand{\mvec}{\mathbf m}\) \(\newcommand{\zerovec}{\mathbf 0}\) \(\newcommand{\onevec}{\mathbf 1}\) \(\newcommand{\real}{\mathbb R}\) \(\newcommand{\twovec}[2]{\left[\begin{array}{r}#1 \\ #2 \end{array}\right]}\) \(\newcommand{\ctwovec}[2]{\left[\begin{array}{c}#1 \\ #2 \end{array}\right]}\) \(\newcommand{\threevec}[3]{\left[\begin{array}{r}#1 \\ #2 \\ #3 \end{array}\right]}\) \(\newcommand{\cthreevec}[3]{\left[\begin{array}{c}#1 \\ #2 \\ #3 \end{array}\right]}\) \(\newcommand{\fourvec}[4]{\left[\begin{array}{r}#1 \\ #2 \\ #3 \\ #4 \end{array}\right]}\) \(\newcommand{\cfourvec}[4]{\left[\begin{array}{c}#1 \\ #2 \\ #3 \\ #4 \end{array}\right]}\) \(\newcommand{\fivevec}[5]{\left[\begin{array}{r}#1 \\ #2 \\ #3 \\ #4 \\ #5 \\ \end{array}\right]}\) \(\newcommand{\cfivevec}[5]{\left[\begin{array}{c}#1 \\ #2 \\ #3 \\ #4 \\ #5 \\ \end{array}\right]}\) \(\newcommand{\mattwo}[4]{\left[\begin{array}{rr}#1 \amp #2 \\ #3 \amp #4 \\ \end{array}\right]}\) \(\newcommand{\laspan}[1]{\text{Span}\{#1\}}\) \(\newcommand{\bcal}{\cal B}\) \(\newcommand{\ccal}{\cal C}\) \(\newcommand{\scal}{\cal S}\) \(\newcommand{\wcal}{\cal W}\) \(\newcommand{\ecal}{\cal E}\) \(\newcommand{\coords}[2]{\left\{#1\right\}_{#2}}\) \(\newcommand{\gray}[1]{\color{gray}{#1}}\) \(\newcommand{\lgray}[1]{\color{lightgray}{#1}}\) \(\newcommand{\rank}{\operatorname{rank}}\) \(\newcommand{\row}{\text{Row}}\) \(\newcommand{\col}{\text{Col}}\) \(\renewcommand{\row}{\text{Row}}\) \(\newcommand{\nul}{\text{Nul}}\) \(\newcommand{\var}{\text{Var}}\) \(\newcommand{\corr}{\text{corr}}\) \(\newcommand{\len}[1]{\left|#1\right|}\) \(\newcommand{\bbar}{\overline{\bvec}}\) \(\newcommand{\bhat}{\widehat{\bvec}}\) \(\newcommand{\bperp}{\bvec^\perp}\) \(\newcommand{\xhat}{\widehat{\xvec}}\) \(\newcommand{\vhat}{\widehat{\vvec}}\) \(\newcommand{\uhat}{\widehat{\uvec}}\) \(\newcommand{\what}{\widehat{\wvec}}\) \(\newcommand{\Sighat}{\widehat{\Sigma}}\) \(\newcommand{\lt}{<}\) \(\newcommand{\gt}{>}\) \(\newcommand{\amp}{&}\) \(\definecolor{fillinmathshade}{gray}{0.9}\)Differences of kind: We often have information available about some attributes of each the actors in our network. In the Bob, Carol, Ted and Alice example, we noted that two of the actors were male and two female. The scores of the cases (Bob, Carol, Ted, Alice) on the variable "sex" are a nominal dichotomy. It is also pretty common to be able to divide actors in a "multiple-choice" way; that is, we can record an attribute as a nominal polyotomy (for example, if we knew the religious affiliation of each actor, we might record it as "Christian," "Muslim," "Jewish," "Zoroastrian," or whatever).
It is often the case that the structure of a network depends on the attributes of the actors embedded in it. If we are looking at the network of "spouse" ties among Bob, Carol, Ted, and Alice, one would note that ties exist for male-female pairs, but not (in our example) for female-female or male-male pairs. Being able to visualize the locations of different types of actors in a graph can help us see patterns, and to understand the nature of the social processes that generated the tie structure.
Using colors and shapes are useful ways of conveying information about what "type" of actor each node is. Figures 4.1 and 4.2 provide an example. The data here describe the exchange of information among ten organizations that were involved in the local political economy of social welfare services in a Midwestern city (from a study by David Knoke; the data are one of the data sets distributed with UCINET). In Figure 4.1, NetDraw has been used to render a directed graph of the data. This is done by opening Netdraw>File>Open>UCInet dataset>Network, and locating the data file. NetDraw produces a basic graph that you can then edit.

Figure 4.1. Knoke information exchange network
Institutional theory might suggest that information exchange among organizations of the same "type" would be more common than information exchange between organizations of different types. Some of the organizations here are governmental (Welfare, Coun, Educ, Mayor, Indu), some are non-governmental (UWay, News, WRO, Comm, West).
In Netdraw, we used the Transform>mode attribute editor to assign a score of "1" to each node if it was governmental, and "0" if it was not. We then used Properties>nodes>color>attribute-based to select the government attribute, and assign the color red to government organizations, and blue to non-government organizations. You could also create an attribute data file in UCINET using the same nodes as the network data file, and creating one or more columns of attributes. NetDraw>File>Open>UCInet dataset>Attribute data can then be used to open the attributes, along with the network, in NetDraw.
Ecological theory of organizations suggests that a division between organizations that are "generalists" (i.e. perform a variety of functions and operate in several different fields) and organizations that are "specialists" (e.g. work only in social welfare) might affect information-sharing patterns.
In Netdraw, we used the Transform>mode attribute editor to create a new column to hold information about whether each organization was a "generalist" or a "specialist." We assigned the score of "1" to "generalists" (e.g. the Newspaper, Mayor) and a score of "0" to "specialists (e.g. the Welfare Rights Organization). We then used Properties>nodes>shape>attribute-based to assign the shape "square" to generalists and "circle" to specialists. The result of these operations is shown in figure 4.2.
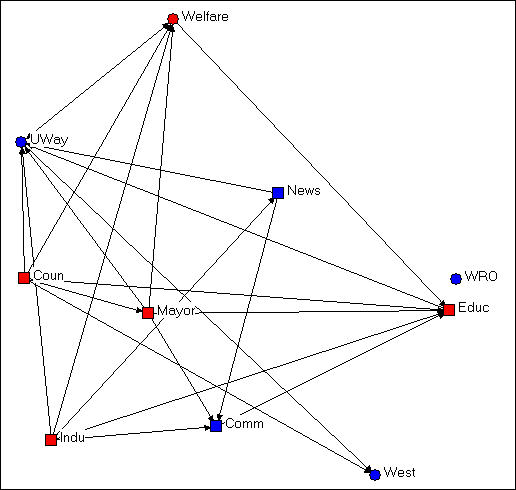
Figure 4.2. Knoke information exchange with government/non-government and specialist/generalist codes
A visual inspection of the diagram with the two attributes highlighted by node color and shape is much more informative about the hypotheses of differential rates of connection among red/blue and among circle/square. It doesn't look like this diagram is very supportive of either of our hypotheses.
Identifying types of nodes according to their attributes can be useful to point out characteristics of actors that are based on their position in the graph. Consider the example in the next Figure, 4.3.

Figure 4.3. Knoke information exchange with k-cores
This figure was created by using the Analysis>K-core tool that is built into NetDraw. We'll talk about the precise definition of a k-core in a later chapter. But, generally, a k-core is a set of nodes that are more closely connected to one another than they are to nodes in other k-cores. That is, a k-core is one definition of a "group" or "sub-structure" in a graph.
Figure 4.3 shows four sub-groups, which are colored to identify which nodes are members of which group (the "West" group and the "WRO" group each contain only a single node). In addition, the size of the nodes in each K-core are proportional to the size of the K-core. The largest group contains government members (Mayor, County Government, Board of Education), as well as the main public (Welfare) and private (United Way) welfare agencies. A second group, colored in black, groups together the newspaper, chamber of commerce, and industrial development agency. Substantively, this actually makes some sense!
This example shows that color and shape of nodes to represent qualitative differences among actors can be based on classifying actors according to their position in the graph, how they are embedded, rather than on some inherent feature of the actor itself (e.g. governmental or non-governmental). One can use UCINET (or other programs) to identify "types" of actors based on their relations (e.g. where are the cliques?), and then enter this information into the attribute editor of NetDraw (Transform>node attribute editor>edit>add column). The groupings that are created by using Analysis tools already built-in to NetDraw are automatically added to the node attribute data base).
Differences of amount: Figure 4.3 also uses the size of the nodes (Properties>nodes>size>attribute-based) to display an index of the number of nodes in each group. This difference of amount among the nodes is best indicated, visually, by assigning the size of the node to values of some attribute. In example 4.3, NetDraw has done this automatically for an amount that was computed by its Analysis>K-cores tool. One can easily compute other variables reflecting differences in amount among actors (e.g. how many "out degrees" or arrows from each actor are there?) using UCINET or other programs. Once these quantities are computed, they can be added to NetDraw (Transform>node attribute editor>edit>add column), and then added to the graph (Properties>nodes>size>attribute-based).
Differences of amount among the nodes could also reflect an attribute that is inherent to an actor alone. In the welfare organizations example, we might know the annual budget or number of employees of each organization. These measures of organizational "size" might be added to the node attributes, and used to scale the size of the nodes so that we could see whether information sharing patterns differ by organizational size.
Color, shape, and size of the nodes in a graph then can be used to visualize information that we have about the attributes of the actors. These attributes can be based on either "external" information about inherent differences in kind and amount among the actors; or, the attributes can be based on "internal" information about differences in kind and amount that describe how the actor is embedded in the relational network.