
8.3: Polar Coordinates
- Page ID
- 1377

\( \newcommand{\vecs}[1]{\overset { \scriptstyle \rightharpoonup} {\mathbf{#1}} } \)
\( \newcommand{\vecd}[1]{\overset{-\!-\!\rightharpoonup}{\vphantom{a}\smash {#1}}} \)
\( \newcommand{\dsum}{\displaystyle\sum\limits} \)
\( \newcommand{\dint}{\displaystyle\int\limits} \)
\( \newcommand{\dlim}{\displaystyle\lim\limits} \)
\( \newcommand{\id}{\mathrm{id}}\) \( \newcommand{\Span}{\mathrm{span}}\)
( \newcommand{\kernel}{\mathrm{null}\,}\) \( \newcommand{\range}{\mathrm{range}\,}\)
\( \newcommand{\RealPart}{\mathrm{Re}}\) \( \newcommand{\ImaginaryPart}{\mathrm{Im}}\)
\( \newcommand{\Argument}{\mathrm{Arg}}\) \( \newcommand{\norm}[1]{\| #1 \|}\)
\( \newcommand{\inner}[2]{\langle #1, #2 \rangle}\)
\( \newcommand{\Span}{\mathrm{span}}\)
\( \newcommand{\id}{\mathrm{id}}\)
\( \newcommand{\Span}{\mathrm{span}}\)
\( \newcommand{\kernel}{\mathrm{null}\,}\)
\( \newcommand{\range}{\mathrm{range}\,}\)
\( \newcommand{\RealPart}{\mathrm{Re}}\)
\( \newcommand{\ImaginaryPart}{\mathrm{Im}}\)
\( \newcommand{\Argument}{\mathrm{Arg}}\)
\( \newcommand{\norm}[1]{\| #1 \|}\)
\( \newcommand{\inner}[2]{\langle #1, #2 \rangle}\)
\( \newcommand{\Span}{\mathrm{span}}\) \( \newcommand{\AA}{\unicode[.8,0]{x212B}}\)
\( \newcommand{\vectorA}[1]{\vec{#1}} % arrow\)
\( \newcommand{\vectorAt}[1]{\vec{\text{#1}}} % arrow\)
\( \newcommand{\vectorB}[1]{\overset { \scriptstyle \rightharpoonup} {\mathbf{#1}} } \)
\( \newcommand{\vectorC}[1]{\textbf{#1}} \)
\( \newcommand{\vectorD}[1]{\overrightarrow{#1}} \)
\( \newcommand{\vectorDt}[1]{\overrightarrow{\text{#1}}} \)
\( \newcommand{\vectE}[1]{\overset{-\!-\!\rightharpoonup}{\vphantom{a}\smash{\mathbf {#1}}}} \)
\( \newcommand{\vecs}[1]{\overset { \scriptstyle \rightharpoonup} {\mathbf{#1}} } \)
\(\newcommand{\longvect}{\overrightarrow}\)
\( \newcommand{\vecd}[1]{\overset{-\!-\!\rightharpoonup}{\vphantom{a}\smash {#1}}} \)
\(\newcommand{\avec}{\mathbf a}\) \(\newcommand{\bvec}{\mathbf b}\) \(\newcommand{\cvec}{\mathbf c}\) \(\newcommand{\dvec}{\mathbf d}\) \(\newcommand{\dtil}{\widetilde{\mathbf d}}\) \(\newcommand{\evec}{\mathbf e}\) \(\newcommand{\fvec}{\mathbf f}\) \(\newcommand{\nvec}{\mathbf n}\) \(\newcommand{\pvec}{\mathbf p}\) \(\newcommand{\qvec}{\mathbf q}\) \(\newcommand{\svec}{\mathbf s}\) \(\newcommand{\tvec}{\mathbf t}\) \(\newcommand{\uvec}{\mathbf u}\) \(\newcommand{\vvec}{\mathbf v}\) \(\newcommand{\wvec}{\mathbf w}\) \(\newcommand{\xvec}{\mathbf x}\) \(\newcommand{\yvec}{\mathbf y}\) \(\newcommand{\zvec}{\mathbf z}\) \(\newcommand{\rvec}{\mathbf r}\) \(\newcommand{\mvec}{\mathbf m}\) \(\newcommand{\zerovec}{\mathbf 0}\) \(\newcommand{\onevec}{\mathbf 1}\) \(\newcommand{\real}{\mathbb R}\) \(\newcommand{\twovec}[2]{\left[\begin{array}{r}#1 \\ #2 \end{array}\right]}\) \(\newcommand{\ctwovec}[2]{\left[\begin{array}{c}#1 \\ #2 \end{array}\right]}\) \(\newcommand{\threevec}[3]{\left[\begin{array}{r}#1 \\ #2 \\ #3 \end{array}\right]}\) \(\newcommand{\cthreevec}[3]{\left[\begin{array}{c}#1 \\ #2 \\ #3 \end{array}\right]}\) \(\newcommand{\fourvec}[4]{\left[\begin{array}{r}#1 \\ #2 \\ #3 \\ #4 \end{array}\right]}\) \(\newcommand{\cfourvec}[4]{\left[\begin{array}{c}#1 \\ #2 \\ #3 \\ #4 \end{array}\right]}\) \(\newcommand{\fivevec}[5]{\left[\begin{array}{r}#1 \\ #2 \\ #3 \\ #4 \\ #5 \\ \end{array}\right]}\) \(\newcommand{\cfivevec}[5]{\left[\begin{array}{c}#1 \\ #2 \\ #3 \\ #4 \\ #5 \\ \end{array}\right]}\) \(\newcommand{\mattwo}[4]{\left[\begin{array}{rr}#1 \amp #2 \\ #3 \amp #4 \\ \end{array}\right]}\) \(\newcommand{\laspan}[1]{\text{Span}\{#1\}}\) \(\newcommand{\bcal}{\cal B}\) \(\newcommand{\ccal}{\cal C}\) \(\newcommand{\scal}{\cal S}\) \(\newcommand{\wcal}{\cal W}\) \(\newcommand{\ecal}{\cal E}\) \(\newcommand{\coords}[2]{\left\{#1\right\}_{#2}}\) \(\newcommand{\gray}[1]{\color{gray}{#1}}\) \(\newcommand{\lgray}[1]{\color{lightgray}{#1}}\) \(\newcommand{\rank}{\operatorname{rank}}\) \(\newcommand{\row}{\text{Row}}\) \(\newcommand{\col}{\text{Col}}\) \(\renewcommand{\row}{\text{Row}}\) \(\newcommand{\nul}{\text{Nul}}\) \(\newcommand{\var}{\text{Var}}\) \(\newcommand{\corr}{\text{corr}}\) \(\newcommand{\len}[1]{\left|#1\right|}\) \(\newcommand{\bbar}{\overline{\bvec}}\) \(\newcommand{\bhat}{\widehat{\bvec}}\) \(\newcommand{\bperp}{\bvec^\perp}\) \(\newcommand{\xhat}{\widehat{\xvec}}\) \(\newcommand{\vhat}{\widehat{\vvec}}\) \(\newcommand{\uhat}{\widehat{\uvec}}\) \(\newcommand{\what}{\widehat{\wvec}}\) \(\newcommand{\Sighat}{\widehat{\Sigma}}\) \(\newcommand{\lt}{<}\) \(\newcommand{\gt}{>}\) \(\newcommand{\amp}{&}\) \(\definecolor{fillinmathshade}{gray}{0.9}\)- Plot points using polar coordinates.
- Convert from polar coordinates to rectangular coordinates.
- Convert from rectangular coordinates to polar coordinates.
- Transform equations between polar and rectangular forms.
- Identify and graph polar equations by converting to rectangular equations.
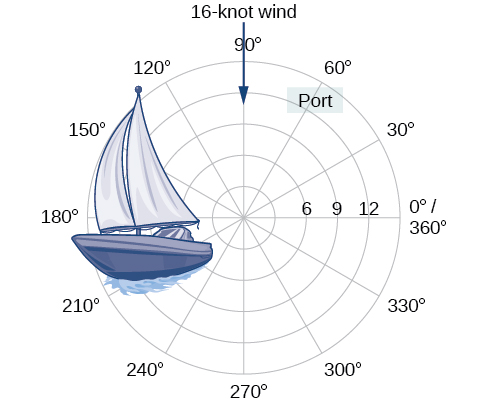
Over \(12\) kilometers from port, a sailboat encounters rough weather and is blown off course by a \(16\)-knot wind (see Figure \(\PageIndex{1}\)). How can the sailor indicate his location to the Coast Guard? In this section, we will investigate a method of representing location that is different from a standard coordinate grid.
Plotting Points Using Polar Coordinates
When we think about plotting points in the plane, we usually think of rectangular coordinates \((x,y)\) in the Cartesian coordinate plane. However, there are other ways of writing a coordinate pair and other types of grid systems. In this section, we introduce to polar coordinates, which are points labeled \((r,\theta)\) and plotted on a polar grid. The polar grid is represented as a series of concentric circles radiating out from the pole, or the origin of the coordinate plane.
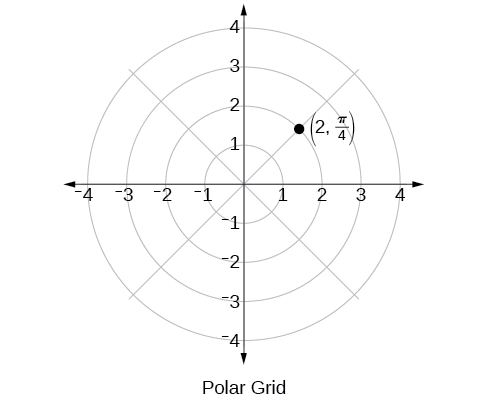
The polar grid is scaled as the unit circle with the positive \(x\)-axis now viewed as the polar axis and the origin as the pole. The first coordinate \(r\) is the radius or length of the directed line segment from the pole. The angle \(\theta\), measured in radians, indicates the direction of \(r\). We move counterclockwise from the polar axis by an angle of \(\theta\),and measure a directed line segment the length of \(r\) in the direction of \(\theta\). Even though we measure \(\theta\) first and then \(r\), the polar point is written with the \(r\)-coordinate first. For example, to plot the point \(\left(2,\dfrac{\pi}{4}\right)\),we would move \(\dfrac{\pi}{4}\) units in the counterclockwise direction and then a length of \(2\) from the pole. This point is plotted on the grid in Figure \(\PageIndex{2}\).
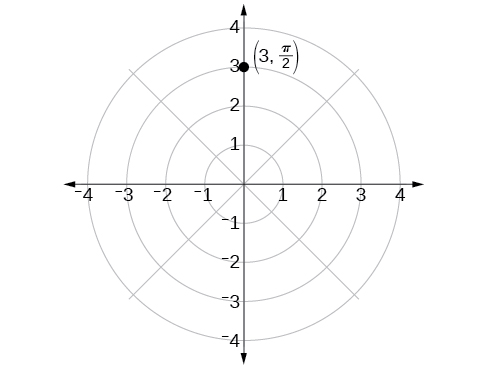
Plot the point \(\left(3,\dfrac{\pi}{2}\right)\) on the polar grid.
Solution
The angle \(\dfrac{\pi}{2}\) is found by sweeping in a counterclockwise direction \(90°\) from the polar axis. The point is located at a length of \(3\) units from the pole in the \(\dfrac{\pi}{2}\) direction, as shown in Figure \(\PageIndex{3}\).
Plot the point \(\left(2, \dfrac{\pi}{3}\right)\) in the polar grid.
- Answer
-
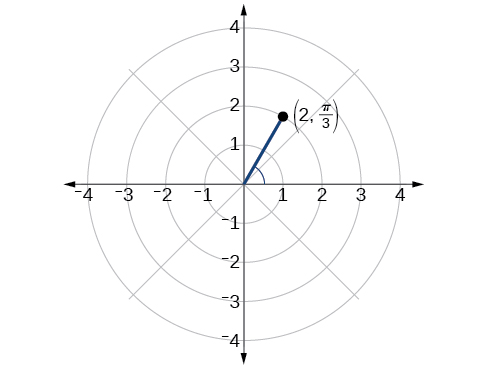
Figure \(\PageIndex{4}\)
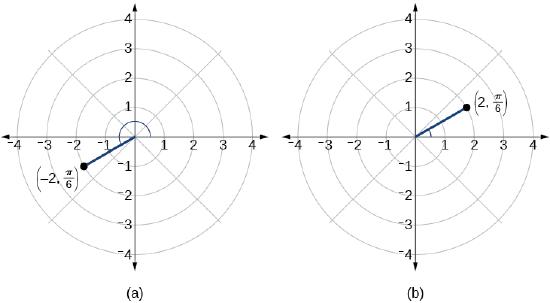
Plot the point \(\left(−2, \dfrac{\pi}{6}\right)\) on the polar grid.
Solution
We know that \(\dfrac{\pi}{6}\) is located in the first quadrant. However, \(r=−2\). We can approach plotting a point with a negative \(r\) in two ways:
- Plot the point \(\left(2,\dfrac{\pi}{6}\right)\) by moving \(\dfrac{\pi}{6}\) in the counterclockwise direction and extending a directed line segment \(2\) units into the first quadrant. Then retrace the directed line segment back through the pole, and continue \(2\) units into the third quadrant;
- Move \(\dfrac{\pi}{6}\) in the counterclockwise direction, and draw the directed line segment from the pole \(2\) units in the negative direction, into the third quadrant.
See Figure \(\PageIndex{5a}\). Compare this to the graph of the polar coordinate \((2,π6)\) shown in Figure \(\PageIndex{5b}\).
Plot the points \(\left(3,−\dfrac{\pi}{6}\right)\) and \(\left(2,\dfrac{9\pi}{4}\right)\) on the same polar grid.
- Answer
-
.jpg?revision=1)
Figure \(\PageIndex{6}\)
Converting from Polar Coordinates to Rectangular Coordinates
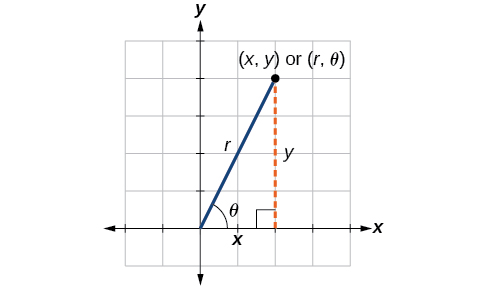
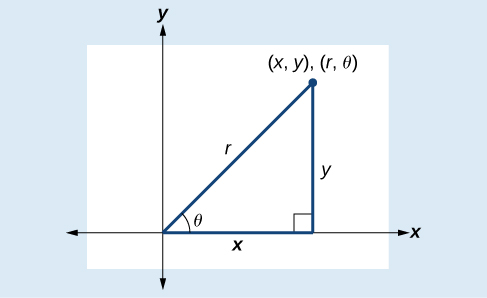
When given a set of polar coordinates, we may need to convert them to rectangular coordinates. To do so, we can recall the relationships that exist among the variables \(x\), \(y\), \(r\), and \(\theta\).
\(\cos \theta=\dfrac{x}{r}\rightarrow x=r \cos \theta\)
\(\sin \theta=\dfrac{y}{r}\rightarrow y=r \sin \theta\)
Dropping a perpendicular from the point in the plane to the x-axis forms a right triangle, as illustrated in Figure \(\PageIndex{7}\). An easy way to remember the equations above is to think of \(\cos \theta\) as the adjacent side over the hypotenuse and \(\sin \theta\) as the opposite side over the hypotenuse.
To convert polar coordinates \((r, \theta)\) to rectangular coordinates \((x, y)\), let
\[\cos \theta=\dfrac{x}{r}\rightarrow x=r \cos \theta\]
\[\sin \theta=\dfrac{y}{r}\rightarrow y=r \sin \theta\]
- Given the polar coordinate \((r,\theta)\), write \(x=r \cos \theta\) and \(y=r \sin \theta\).
- Evaluate \(\cos \theta\) and \(\sin \theta\).
- Multiply \(\cos \theta\) by \(r\) to find the \(x\)-coordinate of the rectangular form.
- Multiply \(\sin \theta\) by \(r\) to find the \(y\)-coordinate of the rectangular form.
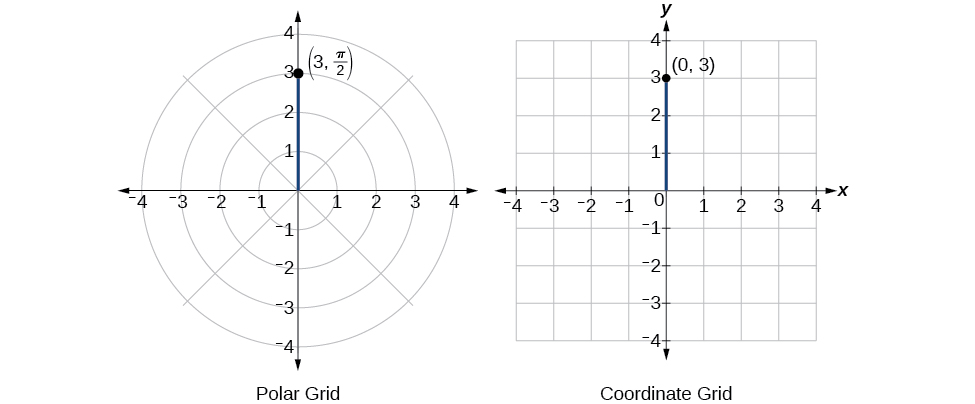
Write the polar coordinates \(\left(3,\dfrac{\pi}{2}\right)\) as rectangular coordinates.
Solution
Use the equivalent relationships.
\[\begin{align*} x&= r \cos \theta\\ x&= 3 \cos \dfrac{\pi}{2}\\ &= 0\\ y&= r \sin \theta\\ y&= 3 \sin \dfrac{\pi}{2}\\ &= 3 \end{align*}\]
The rectangular coordinates are \((0,3)\). See Figure \(\PageIndex{8}\).
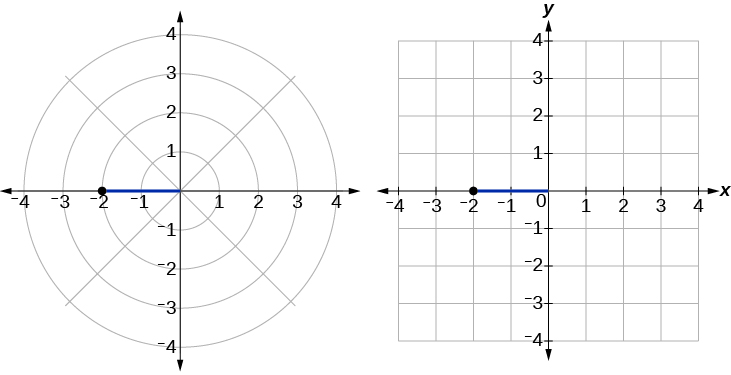
Write the polar coordinates \((−2,0)\) as rectangular coordinates.
Solution
See Figure \(\PageIndex{9}\). Writing the polar coordinates as rectangular, we have
\[\begin{align*} x&= r \cos \theta\\ x&= -2 \cos(0)\\ &= -2\\ y&= r \sin \theta\\ y&= -2 \sin(0)\\ &= 0 \end{align*}\]
The rectangular coordinates are also \((−2,0)\).
Write the polar coordinates \(\left(−1,\dfrac{2\pi}{3}\right)\) as rectangular coordinates.
- Answer
-
\((x,y)=\left(\dfrac{1}{2},−\dfrac{\sqrt{3}}{2}\right)\)
Converting from Rectangular Coordinates to Polar Coordinates
To convert rectangular coordinates to polar coordinates, we will use two other familiar relationships. With this conversion, however, we need to be aware that a set of rectangular coordinates will yield more than one polar point.
Converting from rectangular coordinates to polar coordinates requires the use of one or more of the relationships illustrated in Figure \(\PageIndex{10}\).
\(\cos \theta=\dfrac{x}{r}\) or \(x=r \cos \theta\)
\(\sin \theta=\dfrac{y}{r}\) or \(y=r \sin \theta\)
\(r^2=x^2+y^2\)
\(\tan \theta=\dfrac{y}{x}\)
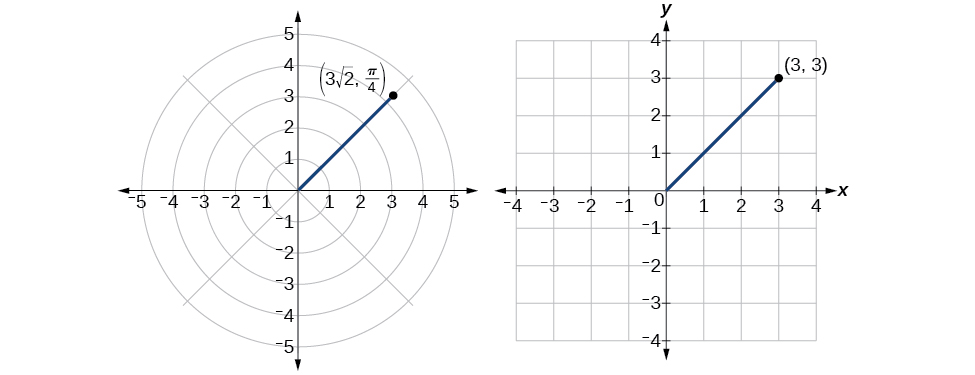
Convert the rectangular coordinates \((3,3)\) to polar coordinates.
Solution
We see that the original point \((3,3)\) is in the first quadrant. To find \(\theta\), use the formula \(\tan \theta=\dfrac{y}{x}\). This gives
\[\begin{align*} \tan \theta&= \dfrac{3}{3}\\ \tan \theta&= 1\\ {\tan}^{-1}(1)&= \dfrac{\pi}{4} \end{align*}\]
To find \(r\), we substitute the values for \(x\) and \(y\) into the formula \(r=\sqrt{x^2+y^2}\). We know that \(r\) must be positive, as \(\dfrac{\pi}{4}\) is in the first quadrant. Thus
\[\begin{align*} r&= \sqrt{3^2+3^2}\\ r&= \sqrt{9+9}\\ r&= \sqrt{18}\\ &= 3\sqrt{2} \end{align*}\]
So, \(r=3\sqrt{2}\) and \(\theta=\dfrac{\pi}{4}\), giving us the polar point \((3\sqrt{2},\dfrac{\pi}{4})\). See Figure \(\PageIndex{11}\).
Analysis
There are other sets of polar coordinates that will be the same as our first solution. For example, the points \(\left(−3\sqrt{2}, \dfrac{5\pi}{4}\right)\) and \(\left(3\sqrt{2},−\dfrac{7\pi}{4}\right)\) will coincide with the original solution of \(\left(3\sqrt{2}, \dfrac{\pi}{4}\right)\). The point \(\left(−3\sqrt{2}, \dfrac{5\pi}{4}\right)\) indicates a move further counterclockwise by \(\pi\), which is directly opposite \(\dfrac{\pi}{4}\). The radius is expressed as \(−3\sqrt{2}\). However, the angle \(\dfrac{5\pi}{4}\) is located in the third quadrant and, as \(r\) is negative, we extend the directed line segment in the opposite direction, into the first quadrant. This is the same point as \(\left(3\sqrt{2}, \dfrac{\pi}{4}\right)\). The point \(\left(3\sqrt{2}, −\dfrac{7\pi}{4}\right)\) is a move further clockwise by \(−\dfrac{7\pi}{4}\), from \(\dfrac{\pi}{4}\). The radius, \(3\sqrt{2}\), is the same.
Transforming Equations between Polar and Rectangular Forms
We can now convert coordinates between polar and rectangular form. Converting equations can be more difficult, but it can be beneficial to be able to convert between the two forms. Since there are a number of polar equations that cannot be expressed clearly in Cartesian form, and vice versa, we can use the same procedures we used to convert points between the coordinate systems. We can then use a graphing calculator to graph either the rectangular form or the polar form of the equation.
- Change the MODE to POL, representing polar form.
- Press the Y= button to bring up a screen allowing the input of six equations: \(r_1\), \(r_2\),..., \(r_6\).
- Enter the polar equation, set equal to \(r\).
- Press GRAPH.
Write the Cartesian equation \(x^2+y^2=9\) in polar form.
Solution
The goal is to eliminate \(x\) and \(y\) from the equation and introduce \(r\) and \(\theta\). Ideally, we would write the equation \(r\) as a function of \(\theta\). To obtain the polar form, we will use the relationships between \((x,y)\) and \((r,\theta)\). Since \(x=r \cos \theta\) and \(y=r \sin \theta\), we can substitute and solve for \(r\).
\(\begin{align*} {(r \cos \theta)}^2+{(r \sin \theta)}^2&= 9\\ r^2 {\cos}^2 \theta+r^2 {\sin}^2 \theta&= 9\\ r^2({\cos}^2 \theta+{\sin}^2 \theta)&= 9\\ r^2(1)&= 9\qquad \text {Substitute } {\cos}^2 \theta+{\sin}^2 \theta=1\\ r&= \pm 3\qquad \text {Use the square root property.} \end{align*}\)
Thus, \(x^2+y^2=9\),\(r=3\),and \(r=−3\) should generate the same graph. See Figure \(\PageIndex{12}\).
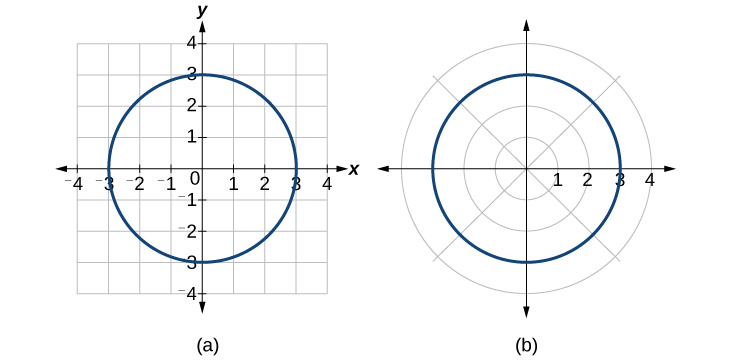
To graph a circle in rectangular form, we must first solve for \(y\).
\[\begin{align*} x^2+y^2&= 9\\ y^2&= 9-x^2\\ y&= \pm \sqrt{9-x^2} \end{align*}\]
Note that this is two separate functions, since a circle fails the vertical line test. Therefore, we need to enter the positive and negative square roots into the calculator separately, as two equations in the form \(Y_1=\sqrt{9−x^2}\) and \(Y_2=−\sqrt{9−x^2}\). Press GRAPH.
Rewrite the Cartesian equation \(x^2+y^2=6y\) as a polar equation.
Solution
This equation appears similar to the previous example, but it requires different steps to convert the equation.
We can still follow the same procedures we have already learned and make the following substitutions:
\(\begin{array}{ll} r^2=6y & \text{Use }x^2+y^2=r^2. \\ r^2=6r \sin \theta & \text{Substitute }y=r \sin \theta. \\ r^2−6r \sin \theta=0 & \text{Set equal to }0. \\ r(r−6 \sin \theta)=0 & \text{Factor and solve.} \\ r=0 & \text{We reject }r=0 \text{, as it only represents one point, }(0,0). \\ \text{or }r=6 \sin \theta \end{array}\)
Therefore, the equations \(x^2+y^2=6y\) and \(r=6 \sin \theta\) should give us the same graph. See Figure \(\PageIndex{13}\).
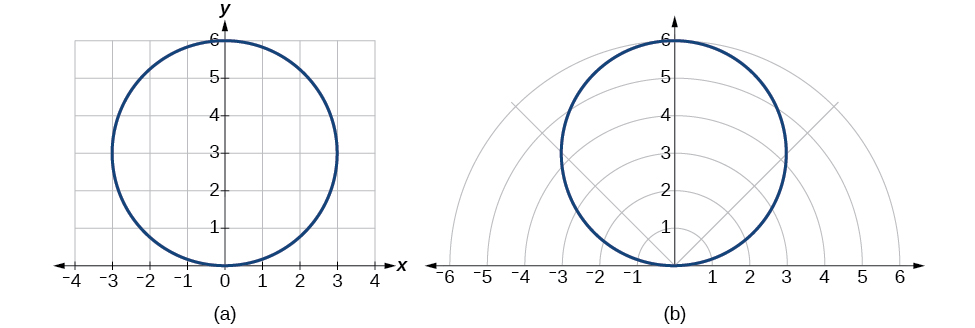
The Cartesian or rectangular equation is plotted on the rectangular grid, and the polar equation is plotted on the polar grid. Clearly, the graphs are identical.
Rewriting a Cartesian Equation in Polar Form
Rewrite the Cartesian equation \(y=3x+2\) as a polar equation.
- Answer
-
We will use the relationships \(x=r \cos \theta\) and \(y=r \sin \theta\).
\(\begin{array}{cl} y=3x+2 \\ r \sin \theta=3r \cos \theta+2 \\ r \sin \theta−3r \cos \theta=2 \\ r(\sin \theta−3 \cos \theta)=2 & \text{Isolate }r. \\ r=\dfrac{2}{\sin \theta−3\cos \theta} & \text{Solve for }r. \end{array}\)
Rewrite the Cartesian equation \(y^2=3−x^2\) in polar form.
- Answer
-
\(r=\sqrt{3}\)
Identify and Graph Polar Equations by Converting to Rectangular Equations
We have learned how to convert rectangular coordinates to polar coordinates, and we have seen that the points are indeed the same. We have also transformed polar equations to rectangular equations and vice versa. Now we will demonstrate that their graphs, while drawn on different grids, are identical.
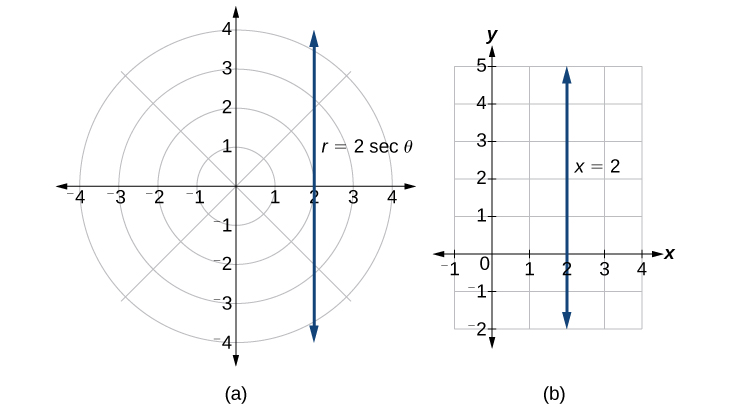
Covert the polar equation \(r=2 \sec \theta\) to a rectangular equation, and draw its corresponding graph.
Solution
The conversion is
\[\begin{align*} r &=2 \sec \theta \\ r &= \dfrac{2}{\cos \theta} \\ r \cos \theta &=2 \\ x &=2 \end{align*}\]
Notice that the equation \(r=2 \sec \theta\) drawn on the polar grid is clearly the same as the vertical line \(x=2\) drawn on the rectangular grid (see Figure \(\PageIndex{14}\)). Just as \(x=c\) is the standard form for a vertical line in rectangular form, \(r=c \sec \theta\) is the standard form for a vertical line in polar form.
A similar discussion would demonstrate that the graph of the function \(r=2 \csc \theta\) will be the horizontal line \(y=2\). In fact, \(r=c \csc \theta\) is the standard form for a horizontal line in polar form, corresponding to the rectangular form \(y=c\).
Rewrite the polar equation \(r=\dfrac{3}{1−2 \cos \theta}\) as a Cartesian equation.
Solution
The goal is to eliminate \(\theta\) and \(r\),and introduce \(x\) and \(y\). We clear the fraction, and then use substitution. In order to replace \(r\) with \(x\) and \(y\), we must use the expression \(x^2+y^2=r^2\).
\(\begin{array} r =\dfrac{3}{1−2 \cos \theta} \\ r(1−2 \cos \theta)=3 \\ r\left(1−2\left(\dfrac{x}{r}\right)\right)=3 & \text{Use }\cos \theta=\dfrac{x}{r} \text{ to eliminate }\theta. \\ r−2x=3 \\ r=3+2x & \text{Isolate }r. \\ r^2={(3+2x)}^2 & \text{Square both sides.} \\ x^2+y^2={(3+2x)}^2 & \text{Use }x^2+y^2=r^2. \end{array}\)
The Cartesian equation is \(x^2+y^2={(3+2x)}^2\). However, to graph it, especially using a graphing calculator or computer program, we want to isolate \(y\).
\[\begin{align*} x^2+y^2 &= {(3+2x)}^2 \\ y^2 &= {(3+2x)}^2-x^2 \\ y &= \pm {(3+2x)}^2-x^2 \end{align*}\]
When our entire equation has been changed from \(r\) and \(\theta\) to \(x\) and \(y\), we can stop, unless asked to solve for \(y\) or simplify. See Figure \(\PageIndex{15}\).
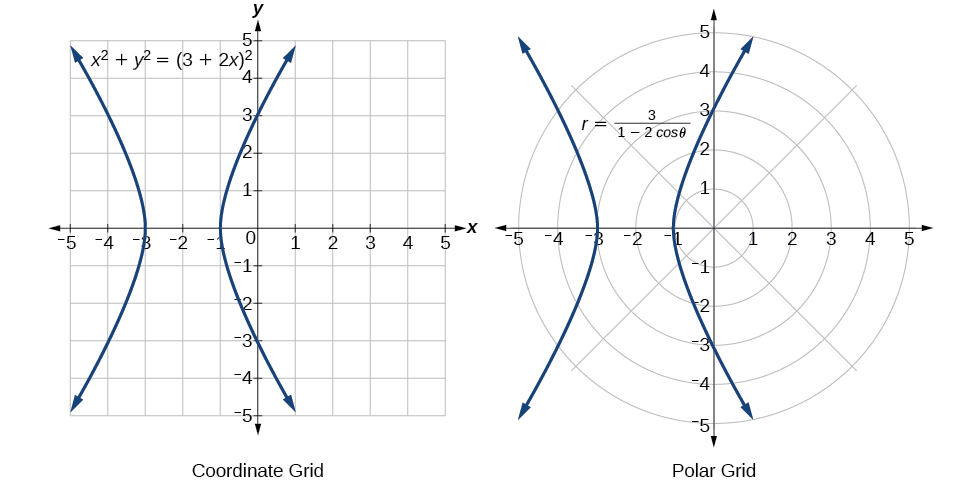
The “hour-glass” shape of the graph is called a hyperbola. Hyperbolas have many interesting geometric features and applications, which we will investigate further in Analytic Geometry.
Analysis
In this example, the right side of the equation can be expanded and the equation simplified further, as shown above. However, the equation cannot be written as a single function in Cartesian form. We may wish to write the rectangular equation in the hyperbola’s standard form. To do this, we can start with the initial equation.
\(\begin{array}{ll} x^2+y^2={(3+2x)}^2 \\ x^2+y^2−{(3+2x)}^2=0 \\ x^2+y^2−(9+12x+4x^2)=0 \\ x^2+y^2−9−12x−4x^2=0 \\ −3x^2−12x+y^2=9 & \text{Multiply through by }−1. \\ 3x^2+12x−y^2=−9 \\ 3(x^2+4x)−y2=−9 & \text{Organize terms to complete the square for }x. \\ 3(x^2+4x+4)−y^2=−9+12 \\ 3{(x+2)}^2−y^2=3 \\ {(x+2)}^2−\dfrac{y^2}{3}=1\end{array}\)
Rewrite the polar equation \(r=2 \sin \theta\) in Cartesian form.
- Answer
-
\(x^2+y^2=2y\) or, in the standard form for a circle, \(x^2+{(y−1)}^2=1\)
Rewrite the polar equation \(r=\sin(2\theta)\) in Cartesian form.
Solution
\(\begin{array}{cl} r=\sin(2\theta) & \text{Use the double angle identity for sine.} \\ r=2 \sin \theta \cos \theta & \text{Use }\cos \theta=\dfrac{x}{r} \text{ and } \sin \theta=\dfrac{y}{r}. \\ r=2 \dfrac{x}{r})(\dfrac{y}{r}) & \text{ Simplify.} \\ r=\dfrac{2xy}{r^2} & \text{Multiply both sides by }r^2. \\ r^3=2xy \\ {(x^2+y^2)}^3=2xy & \text{As }x^2+y^2=r^2, r=\sqrt{x^2+y^2}. \end{array}\)
This equation can also be written as
\({(x^2+y^2)}^{\frac{3}{2}}=2xy \text{ or }x^2+y^2={(2xy)}^{\frac{2}{3}}\)
Access these online resources for additional instruction and practice with polar coordinates.
Key Equations
|
Conversion formulas |
\(\cos \theta=\dfrac{x}{r} \rightarrow x=r \cos\theta\) \(\sin \theta=\dfrac{y}{r} \rightarrow y=r \sin \theta\) \(r^2=x^2+y^2\) \(\tan \theta=\dfrac{y}{x}\) |
Key Concepts
- The polar grid is represented as a series of concentric circles radiating out from the pole, or origin.
- To plot a point in the form \((r,\theta)\), \(\theta>0\), move in a counterclockwise direction from the polar axis by an angle of \(\theta\), and then extend a directed line segment from the pole the length of \(r\) in the direction of \(\theta\). If \(\theta\) is negative, move in a clockwise direction, and extend a directed line segment the length of \(r\) in the direction of \(\theta\). See Example \(\PageIndex{1}\).
- If \(r\) is negative, extend the directed line segment in the opposite direction of \(\theta\). See Example \(\PageIndex{2}\).
- To convert from polar coordinates to rectangular coordinates, use the formulas \(x=r \cos \theta\) and \(y=r \sin \theta\). See Example \(\PageIndex{3}\) and Example \(\PageIndex{4}\).
- To convert from rectangular coordinates to polar coordinates, use one or more of the formulas: \(\cos \theta=\dfrac{x}{r}\), \(\sin \theta=\dfrac{y}{r}\), \(\tan \theta=\dfrac{y}{x}\), and \(r=\sqrt{x^2+y^2}\). See Example \(\PageIndex{5}\).
- Transforming equations between polar and rectangular forms means making the appropriate substitutions based on the available formulas, together with algebraic manipulations. See Example \(\PageIndex{6}\), Example \(\PageIndex{7}\), and Example \(\PageIndex{8}\).
- Using the appropriate substitutions makes it possible to rewrite a polar equation as a rectangular equation, and then graph it in the rectangular plane. See Example \(\PageIndex{9}\), Example \(\PageIndex{10}\), and Example \(\PageIndex{11}\).