
3.10: Chapter 3 Review Exercises
- Page ID
- 160820
\( \newcommand{\vecs}[1]{\overset { \scriptstyle \rightharpoonup} {\mathbf{#1}} } \)
\( \newcommand{\vecd}[1]{\overset{-\!-\!\rightharpoonup}{\vphantom{a}\smash {#1}}} \)
\( \newcommand{\dsum}{\displaystyle\sum\limits} \)
\( \newcommand{\dint}{\displaystyle\int\limits} \)
\( \newcommand{\dlim}{\displaystyle\lim\limits} \)
\( \newcommand{\id}{\mathrm{id}}\) \( \newcommand{\Span}{\mathrm{span}}\)
( \newcommand{\kernel}{\mathrm{null}\,}\) \( \newcommand{\range}{\mathrm{range}\,}\)
\( \newcommand{\RealPart}{\mathrm{Re}}\) \( \newcommand{\ImaginaryPart}{\mathrm{Im}}\)
\( \newcommand{\Argument}{\mathrm{Arg}}\) \( \newcommand{\norm}[1]{\| #1 \|}\)
\( \newcommand{\inner}[2]{\langle #1, #2 \rangle}\)
\( \newcommand{\Span}{\mathrm{span}}\)
\( \newcommand{\id}{\mathrm{id}}\)
\( \newcommand{\Span}{\mathrm{span}}\)
\( \newcommand{\kernel}{\mathrm{null}\,}\)
\( \newcommand{\range}{\mathrm{range}\,}\)
\( \newcommand{\RealPart}{\mathrm{Re}}\)
\( \newcommand{\ImaginaryPart}{\mathrm{Im}}\)
\( \newcommand{\Argument}{\mathrm{Arg}}\)
\( \newcommand{\norm}[1]{\| #1 \|}\)
\( \newcommand{\inner}[2]{\langle #1, #2 \rangle}\)
\( \newcommand{\Span}{\mathrm{span}}\) \( \newcommand{\AA}{\unicode[.8,0]{x212B}}\)
\( \newcommand{\vectorA}[1]{\vec{#1}} % arrow\)
\( \newcommand{\vectorAt}[1]{\vec{\text{#1}}} % arrow\)
\( \newcommand{\vectorB}[1]{\overset { \scriptstyle \rightharpoonup} {\mathbf{#1}} } \)
\( \newcommand{\vectorC}[1]{\textbf{#1}} \)
\( \newcommand{\vectorD}[1]{\overrightarrow{#1}} \)
\( \newcommand{\vectorDt}[1]{\overrightarrow{\text{#1}}} \)
\( \newcommand{\vectE}[1]{\overset{-\!-\!\rightharpoonup}{\vphantom{a}\smash{\mathbf {#1}}}} \)
\( \newcommand{\vecs}[1]{\overset { \scriptstyle \rightharpoonup} {\mathbf{#1}} } \)
\(\newcommand{\longvect}{\overrightarrow}\)
\( \newcommand{\vecd}[1]{\overset{-\!-\!\rightharpoonup}{\vphantom{a}\smash {#1}}} \)
\(\newcommand{\avec}{\mathbf a}\) \(\newcommand{\bvec}{\mathbf b}\) \(\newcommand{\cvec}{\mathbf c}\) \(\newcommand{\dvec}{\mathbf d}\) \(\newcommand{\dtil}{\widetilde{\mathbf d}}\) \(\newcommand{\evec}{\mathbf e}\) \(\newcommand{\fvec}{\mathbf f}\) \(\newcommand{\nvec}{\mathbf n}\) \(\newcommand{\pvec}{\mathbf p}\) \(\newcommand{\qvec}{\mathbf q}\) \(\newcommand{\svec}{\mathbf s}\) \(\newcommand{\tvec}{\mathbf t}\) \(\newcommand{\uvec}{\mathbf u}\) \(\newcommand{\vvec}{\mathbf v}\) \(\newcommand{\wvec}{\mathbf w}\) \(\newcommand{\xvec}{\mathbf x}\) \(\newcommand{\yvec}{\mathbf y}\) \(\newcommand{\zvec}{\mathbf z}\) \(\newcommand{\rvec}{\mathbf r}\) \(\newcommand{\mvec}{\mathbf m}\) \(\newcommand{\zerovec}{\mathbf 0}\) \(\newcommand{\onevec}{\mathbf 1}\) \(\newcommand{\real}{\mathbb R}\) \(\newcommand{\twovec}[2]{\left[\begin{array}{r}#1 \\ #2 \end{array}\right]}\) \(\newcommand{\ctwovec}[2]{\left[\begin{array}{c}#1 \\ #2 \end{array}\right]}\) \(\newcommand{\threevec}[3]{\left[\begin{array}{r}#1 \\ #2 \\ #3 \end{array}\right]}\) \(\newcommand{\cthreevec}[3]{\left[\begin{array}{c}#1 \\ #2 \\ #3 \end{array}\right]}\) \(\newcommand{\fourvec}[4]{\left[\begin{array}{r}#1 \\ #2 \\ #3 \\ #4 \end{array}\right]}\) \(\newcommand{\cfourvec}[4]{\left[\begin{array}{c}#1 \\ #2 \\ #3 \\ #4 \end{array}\right]}\) \(\newcommand{\fivevec}[5]{\left[\begin{array}{r}#1 \\ #2 \\ #3 \\ #4 \\ #5 \\ \end{array}\right]}\) \(\newcommand{\cfivevec}[5]{\left[\begin{array}{c}#1 \\ #2 \\ #3 \\ #4 \\ #5 \\ \end{array}\right]}\) \(\newcommand{\mattwo}[4]{\left[\begin{array}{rr}#1 \amp #2 \\ #3 \amp #4 \\ \end{array}\right]}\) \(\newcommand{\laspan}[1]{\text{Span}\{#1\}}\) \(\newcommand{\bcal}{\cal B}\) \(\newcommand{\ccal}{\cal C}\) \(\newcommand{\scal}{\cal S}\) \(\newcommand{\wcal}{\cal W}\) \(\newcommand{\ecal}{\cal E}\) \(\newcommand{\coords}[2]{\left\{#1\right\}_{#2}}\) \(\newcommand{\gray}[1]{\color{gray}{#1}}\) \(\newcommand{\lgray}[1]{\color{lightgray}{#1}}\) \(\newcommand{\rank}{\operatorname{rank}}\) \(\newcommand{\row}{\text{Row}}\) \(\newcommand{\col}{\text{Col}}\) \(\renewcommand{\row}{\text{Row}}\) \(\newcommand{\nul}{\text{Nul}}\) \(\newcommand{\var}{\text{Var}}\) \(\newcommand{\corr}{\text{corr}}\) \(\newcommand{\len}[1]{\left|#1\right|}\) \(\newcommand{\bbar}{\overline{\bvec}}\) \(\newcommand{\bhat}{\widehat{\bvec}}\) \(\newcommand{\bperp}{\bvec^\perp}\) \(\newcommand{\xhat}{\widehat{\xvec}}\) \(\newcommand{\vhat}{\widehat{\vvec}}\) \(\newcommand{\uhat}{\widehat{\uvec}}\) \(\newcommand{\what}{\widehat{\wvec}}\) \(\newcommand{\Sighat}{\widehat{\Sigma}}\) \(\newcommand{\lt}{<}\) \(\newcommand{\gt}{>}\) \(\newcommand{\amp}{&}\) \(\definecolor{fillinmathshade}{gray}{0.9}\)Exercises 1 - 4
True or False? Justify the answer with a proof or a counterexample.
- Every function has a derivative.
- Answer
- False
- A continuous function has a continuous derivative.
- A continuous function has a derivative.
- Answer
- False
- If a function is differentiable, it is continuous.
Exercises 5 - 6
Use the limit definition of the derivative to exactly evaluate the derivative.
- \(f(x)=\sqrt{x+4}\)
- Answer
- \(f'(x) = \dfrac{1}{2\sqrt{x+4}}\)
- \(f(x)=\dfrac{3}{x}\)
Exercises 7 - 14
Find the derivatives of the given functions.
- \(f(x)=3x^3−\dfrac{4}{x^2}\)
- Answer
- \(f'(x) = 9x^2+\frac{8}{x^3}\)
- \(f(x)=(4−x^2)^3\)
- \(f(x)=e^{\sin x}\)
- Answer
- \(f'(x) = e^{\sin x}\cos x\)
- \(f(x)=\ln(x+2)\)
- \(f(x)=x^2\cos x+x\tan x\)
- Answer
- \(f'(x) = x\sec^2 x+2x\cos x+\tan x−x^2\sin x \)
- \(f(x)=\sqrt{3x^2+2}\)
- \(f(x)=\dfrac{x}{4}\sin^{−1}(x)\)
- Answer
- \(f'(x) = \frac{1}{4}\left(\frac{x}{\sqrt{1−x^2}}+\sin^{−1} x\right)\)
- \(x^2y=(y+2)+xy\sin x\)
Exercises 15 - 17
Find the indicated derivatives of various orders.
- First derivative of \(y=x(\ln x)\cos x\)
- Answer
- \(\dfrac{dy}{dx} = \cos x⋅(\ln x+1)−x(\ln x)\sin x\)
- Third derivative of \(y=(3x+2)^2\)
- Second derivative of \(y=4^x+x^2\sin x\)
- Answer
- \(\dfrac{d^2y}{dx^2} = 4^x(\ln 4)^2+2\sin x+4x\cos x−x^2\sin x\)
Exercises 18 - 19
Find the equation of the tangent line to the following equations at the specified point.
- \(y=\cos^{−1}(x)+x\) at \(x=0\)
- \(y=x+e^x−\dfrac{1}{x}\) at \(x=1\)
- Answer
- \(y = (2+e)x−2\)
Exercises 20 - 21
Draw the derivative of the functions with the given graphs.
- Answer
-
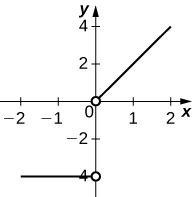
Figure \(\PageIndex{3}\): A piecewise function is plotted with two distinct segments: For negative \(x\)-values, the function is a horizontal line at \(y=−4\), extending to the left. There is an open circle at \((0,−4)\). For positive \(x\)-values, the function is a diagonal line with a positive slope, starting from the origin (0,0), though there is an open hole there, and increasing as \(x\) increases.
Exercises 22 and 23
These exercises concern the water level in Ocean City, New Jersey, in January, which can be approximated by \(w(t)=1.9+2.9\cos(\frac{π}{6}t),\) where \(t\) is measured in hours after midnight, and the height is measured in feet.
- Find and graph the derivative. What is the physical meaning?
- Find \(w′(3).\) What is the physical meaning of this value?
- Answer
- \(w′(3)=−\frac{2.9π}{6}\). At 3 a.m. the tide is decreasing at a rate of 1.514 ft/hr.
Exercises 24 and 25
Consider the wind speeds of Hurricane Katrina, which affected New Orleans, Louisiana, in August 2005. The data are displayed in a table.
| Hours after Midnight, August 26 | Wind Speed (mph) |
|---|---|
| 1 | 45 |
| 5 | 75 |
| 11 | 100 |
| 29 | 115 |
| 49 | 145 |
| 58 | 175 |
| 73 | 155 |
| 81 | 125 |
| 85 | 95 |
| 107 | 35 |
Wind Speeds of Hurricane KatrinaSource: news.nationalgeographic.com/n..._timeline.html.
- Using the table, estimate the derivative of the wind speed at hour 39. What is the physical meaning?
- Estimate the derivative of the wind speed at hour 83. What is the physical meaning?
- Answer
- \(−7.5.\) The wind speed is decreasing at a rate of 7.5 mph/hr