
4.0: Area
- Page ID
- 212031

\( \newcommand{\vecs}[1]{\overset { \scriptstyle \rightharpoonup} {\mathbf{#1}} } \)
\( \newcommand{\vecd}[1]{\overset{-\!-\!\rightharpoonup}{\vphantom{a}\smash {#1}}} \)
\( \newcommand{\dsum}{\displaystyle\sum\limits} \)
\( \newcommand{\dint}{\displaystyle\int\limits} \)
\( \newcommand{\dlim}{\displaystyle\lim\limits} \)
\( \newcommand{\id}{\mathrm{id}}\) \( \newcommand{\Span}{\mathrm{span}}\)
( \newcommand{\kernel}{\mathrm{null}\,}\) \( \newcommand{\range}{\mathrm{range}\,}\)
\( \newcommand{\RealPart}{\mathrm{Re}}\) \( \newcommand{\ImaginaryPart}{\mathrm{Im}}\)
\( \newcommand{\Argument}{\mathrm{Arg}}\) \( \newcommand{\norm}[1]{\| #1 \|}\)
\( \newcommand{\inner}[2]{\langle #1, #2 \rangle}\)
\( \newcommand{\Span}{\mathrm{span}}\)
\( \newcommand{\id}{\mathrm{id}}\)
\( \newcommand{\Span}{\mathrm{span}}\)
\( \newcommand{\kernel}{\mathrm{null}\,}\)
\( \newcommand{\range}{\mathrm{range}\,}\)
\( \newcommand{\RealPart}{\mathrm{Re}}\)
\( \newcommand{\ImaginaryPart}{\mathrm{Im}}\)
\( \newcommand{\Argument}{\mathrm{Arg}}\)
\( \newcommand{\norm}[1]{\| #1 \|}\)
\( \newcommand{\inner}[2]{\langle #1, #2 \rangle}\)
\( \newcommand{\Span}{\mathrm{span}}\) \( \newcommand{\AA}{\unicode[.8,0]{x212B}}\)
\( \newcommand{\vectorA}[1]{\vec{#1}} % arrow\)
\( \newcommand{\vectorAt}[1]{\vec{\text{#1}}} % arrow\)
\( \newcommand{\vectorB}[1]{\overset { \scriptstyle \rightharpoonup} {\mathbf{#1}} } \)
\( \newcommand{\vectorC}[1]{\textbf{#1}} \)
\( \newcommand{\vectorD}[1]{\overrightarrow{#1}} \)
\( \newcommand{\vectorDt}[1]{\overrightarrow{\text{#1}}} \)
\( \newcommand{\vectE}[1]{\overset{-\!-\!\rightharpoonup}{\vphantom{a}\smash{\mathbf {#1}}}} \)
\( \newcommand{\vecs}[1]{\overset { \scriptstyle \rightharpoonup} {\mathbf{#1}} } \)
\(\newcommand{\longvect}{\overrightarrow}\)
\( \newcommand{\vecd}[1]{\overset{-\!-\!\rightharpoonup}{\vphantom{a}\smash {#1}}} \)
\(\newcommand{\avec}{\mathbf a}\) \(\newcommand{\bvec}{\mathbf b}\) \(\newcommand{\cvec}{\mathbf c}\) \(\newcommand{\dvec}{\mathbf d}\) \(\newcommand{\dtil}{\widetilde{\mathbf d}}\) \(\newcommand{\evec}{\mathbf e}\) \(\newcommand{\fvec}{\mathbf f}\) \(\newcommand{\nvec}{\mathbf n}\) \(\newcommand{\pvec}{\mathbf p}\) \(\newcommand{\qvec}{\mathbf q}\) \(\newcommand{\svec}{\mathbf s}\) \(\newcommand{\tvec}{\mathbf t}\) \(\newcommand{\uvec}{\mathbf u}\) \(\newcommand{\vvec}{\mathbf v}\) \(\newcommand{\wvec}{\mathbf w}\) \(\newcommand{\xvec}{\mathbf x}\) \(\newcommand{\yvec}{\mathbf y}\) \(\newcommand{\zvec}{\mathbf z}\) \(\newcommand{\rvec}{\mathbf r}\) \(\newcommand{\mvec}{\mathbf m}\) \(\newcommand{\zerovec}{\mathbf 0}\) \(\newcommand{\onevec}{\mathbf 1}\) \(\newcommand{\real}{\mathbb R}\) \(\newcommand{\twovec}[2]{\left[\begin{array}{r}#1 \\ #2 \end{array}\right]}\) \(\newcommand{\ctwovec}[2]{\left[\begin{array}{c}#1 \\ #2 \end{array}\right]}\) \(\newcommand{\threevec}[3]{\left[\begin{array}{r}#1 \\ #2 \\ #3 \end{array}\right]}\) \(\newcommand{\cthreevec}[3]{\left[\begin{array}{c}#1 \\ #2 \\ #3 \end{array}\right]}\) \(\newcommand{\fourvec}[4]{\left[\begin{array}{r}#1 \\ #2 \\ #3 \\ #4 \end{array}\right]}\) \(\newcommand{\cfourvec}[4]{\left[\begin{array}{c}#1 \\ #2 \\ #3 \\ #4 \end{array}\right]}\) \(\newcommand{\fivevec}[5]{\left[\begin{array}{r}#1 \\ #2 \\ #3 \\ #4 \\ #5 \\ \end{array}\right]}\) \(\newcommand{\cfivevec}[5]{\left[\begin{array}{c}#1 \\ #2 \\ #3 \\ #4 \\ #5 \\ \end{array}\right]}\) \(\newcommand{\mattwo}[4]{\left[\begin{array}{rr}#1 \amp #2 \\ #3 \amp #4 \\ \end{array}\right]}\) \(\newcommand{\laspan}[1]{\text{Span}\{#1\}}\) \(\newcommand{\bcal}{\cal B}\) \(\newcommand{\ccal}{\cal C}\) \(\newcommand{\scal}{\cal S}\) \(\newcommand{\wcal}{\cal W}\) \(\newcommand{\ecal}{\cal E}\) \(\newcommand{\coords}[2]{\left\{#1\right\}_{#2}}\) \(\newcommand{\gray}[1]{\color{gray}{#1}}\) \(\newcommand{\lgray}[1]{\color{lightgray}{#1}}\) \(\newcommand{\rank}{\operatorname{rank}}\) \(\newcommand{\row}{\text{Row}}\) \(\newcommand{\col}{\text{Col}}\) \(\renewcommand{\row}{\text{Row}}\) \(\newcommand{\nul}{\text{Nul}}\) \(\newcommand{\var}{\text{Var}}\) \(\newcommand{\corr}{\text{corr}}\) \(\newcommand{\len}[1]{\left|#1\right|}\) \(\newcommand{\bbar}{\overline{\bvec}}\) \(\newcommand{\bhat}{\widehat{\bvec}}\) \(\newcommand{\bperp}{\bvec^\perp}\) \(\newcommand{\xhat}{\widehat{\xvec}}\) \(\newcommand{\vhat}{\widehat{\vvec}}\) \(\newcommand{\uhat}{\widehat{\uvec}}\) \(\newcommand{\what}{\widehat{\wvec}}\) \(\newcommand{\Sighat}{\widehat{\Sigma}}\) \(\newcommand{\lt}{<}\) \(\newcommand{\gt}{>}\) \(\newcommand{\amp}{&}\) \(\definecolor{fillinmathshade}{gray}{0.9}\)The primary purpose of this introductory section is to help develop your intuition about areas and your ability to reason using geometric arguments about area. This type of reasoning will appear often in the rest of this book and is very helpful for applying the ideas of calculus.
The basic shape we will use is the rectangle: the area of a rectangle is \((\mbox{base})\cdot(\mbox{height})\). If the units for each side of the rectangle are “meters,” then the area will have units \((\mbox{meters})\cdot(\mbox{meters}) =\) “square meters” \(= \mbox{m}^2\). The only other area formulas needed for this section are for triangles (area \(= \frac12 b\cdot h\)) and for circles (area \(= \pi\cdot r^2\)). In addition, we will use (and assume to be true) three other familiar properties of area:
- Addition Property: The total area of a region is the sum of the areas of the non-overlapping pieces that comprise the region:

- Inclusion Property: If region \(B\) is inside region \(A\) (see margin), then the area of region \(B\) is less than or equal to the area of region \(A\):

- Location-Independence Property: The area of a region does not depend on its location:

Determine the area of the region shown below left.

Solution
We can easily break the region into two rectangles (shown above right), with areas of \(35\) square inches and \(3\) square inches respectively, so the area of the original region is \(38\) square inches.
Determine the area of the trapezoidal region shown below:

by cutting it in two ways:
- into a rectangle and triangle and
- into two triangles.
- Answer
-
- \(3(6) + \frac12(4)(3) = 24\)
- \(\frac12 (3)(10) + \frac12 (6)(3) = 24\)
We can use our three area properties to deduce information about areas that are difficult to calculate exactly. Let \(A\) be the region bounded by the graph of \(\displaystyle f(x) = \frac{1}{x}\), the \(x\)-axis, and the vertical lines \(x = 1\) and \(x = 3\). Because the two rectangles in the margin figure sit inside region \(A\) and do not overlap each other, the area of the rectangles, \(\displaystyle \frac12 + \frac13 = \frac56\), is less than the area of region \(A\).
Build two rectangles, each with base \(1\) unit, with boundaries that extend outside the shaded region in the figure below:

and use their areas to make another valid statement about the area of region \(A\).
- Answer
-
outside rectangular area \(= (1)(1) + (1)\left(\frac12\right) = 1.5\)
What can you say about the area of region \(A\) from Practice \(\PageIndex{2}\) if we use “inside” and “outside” rectangles each with base \(\frac12\) unit?
- Answer
-
Using rectangles with base \(= \frac12\):
\begin{align*}\mbox{inside area} &= \frac12\left(\frac23 + \frac12 + \frac25 + \frac13\right) = \frac{57}{60} \approx 0.95\\
\mbox{outside area} &= \frac12\left( 1 + \frac23 + \frac12 + \frac25\right) = \frac{72}{60} = 1.2\end{align*}
so the area of the region is between \(0.95\) and \(1.2\).
The figure below right includes 32 dark squares, each 1 centimeter on a side, and 31 lighter squares of the same size:

We can be sure that the area of the leaf below left is smaller than what number?
Solution
The area of the leaf is smaller than \(32 + 31 = 63\, \mbox{cm}^2\).
We can be sure that the area of the leaf from Example \(\PageIndex{2}\) is at least how large?
- Answer
-
The leaf’s area is larger than the area of the dark rectangles, \(32\,\mbox{cm}^2\).
Functions can be defined in terms of areas. For the constant function \(f(t) = 2\), define \(A(x)\) to be the area of the rectangular region:
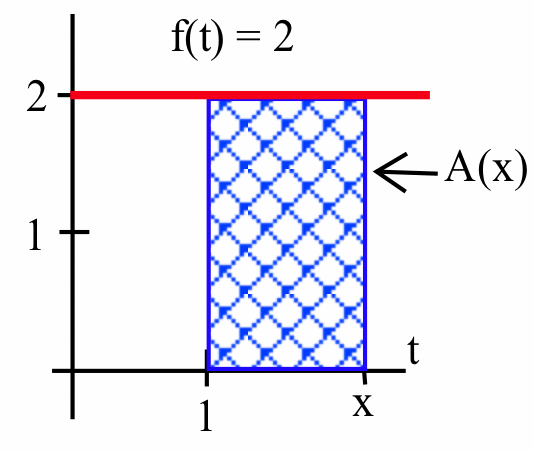
bounded by the graph of \(f\), the \(t\)-axis, and the vertical lines at \(t=1\) and \(t=x\); we can easily see that \(A(2) = 2\), as indicated by the shaded region:

Similarly, \(A(3)= 4\) and \(A(4)=6\). In general, \(A(x)= (\mbox{base})(\mbox{height}) = (x-1)(2) = 2x - 2\) for any \(x\geq 1\). From the graph of \(y=A(x)\):
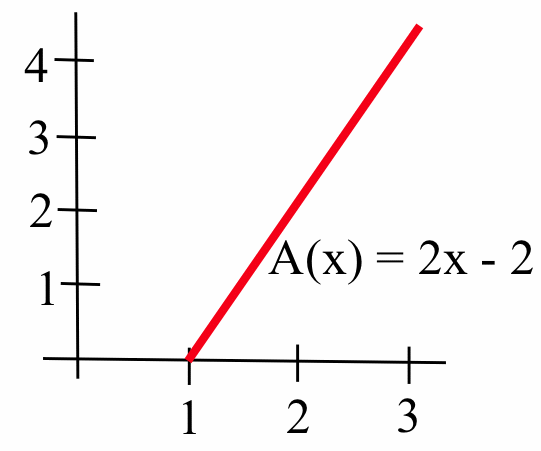
we can see that \(A'(x) = 2\) for every value of \(x > 1\).
(The fact that \(A'(x) = f(x)\) in the preceding discussion is not a coincidence, as we shall soon learn.)
For \(f(t)=2\), define \(B(x)\) to be the area of the region bounded by the graph of \(f\), the \(t\)-axis, and vertical lines at \(t = 0\) and \(t = x\):

Fill in the table below with the requested values of \(B\). How are the graphs of \(y = A(x)\) and \(y = B(x)\) related?
| \(x\) | \(B(x)\) |
|---|---|
| \(0\) | |
| \(0.5\) | |
| \(1\) | |
| \(2\) |
- Answer
-
\(y = B(x) = 2x\) is a line with slope \(2\), so it is parallel to the line \(y = A(x) = 2x - 2\).
version of previous table with values of B filled in \(x\) \(B(x)\) \(0\) \(0\) \(0.5\) \(1\) \(1\) \(2\) \(2\) \(4\)
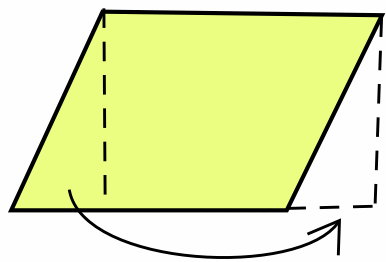
Sometimes it is useful to move regions around. The area of a parallelogram is obvious if we move the triangular region from one side of the parallelogram to fill the region on the other side, resulting in with a rectangle:
At first glance, it is difficult to estimate the total area of the shaded regions shown below left:

but if we slide all of them into a single column (above right), then becomes easy to determine that the shaded area is less than the area of the enclosing rectangle \(= (\mbox{base})(\mbox{height}) = (1)(2) = 2\).
The total area of the shaded regions in the figure below:

is less than what number?
- Answer
-
Area \(<\) area of the rectangle enclosing the shifted regions \(= 5\):

Some Applications of “Area”
One reason “areas” are so useful is that they can represent quantities other than sizes of simple geometric shapes. For example, if the units of the base of a rectangle are “hours” and the units of the height are “\(\frac{\mbox{miles}}{\mbox{hour}}\),” then the units of the “area” of the rectangle are:\[(\mbox{hours})\cdot\left(\frac{\mbox{miles}}{\mbox{hour}}\right) = \mbox{miles}\nonumber\]a measure of distance:

Similarly, if the base units are “pounds” and the height units are “feet,” then the “area” units are “foot-pounds,” a measure of work.
In the figure below, \(f(t)\) is the velocity of a car in “miles per hour,” and \(t\) is the time in “hours”:

So the shaded “area” will be \((\mbox{base})\cdot(\mbox{height}) = (3\,\mbox{hours})\cdot\left(20\,\frac{\mbox{miles}}{\mbox{hour}}\right) = 60\) miles, the distance traveled by the car in the 3 hours from 1:00 p.m. until 4:00 p.m.
If \(f(t)\) is the (positive) forward velocity of an object at time \(t\), then the “area” between the graph of \(f\) and the \(t\)-axis and the vertical lines at times \(t = a\) and \(t = b\) will equal the distance that the object has moved forward between times \(a\) and \(b\).
This “area as distance” concept can make some difficult distance problems much easier.
A car starts from rest (velocity \(= 0\)) and steadily speeds up so that 20 seconds later its speed is 88 feet per second (60 miles per hour). How far did the car travel during those 20 seconds?
Solution
We could answer the question using the techniques of Chapter 3 (try this). But if “steadily” means that the velocity increases linearly, then it is easier to use the figure below:
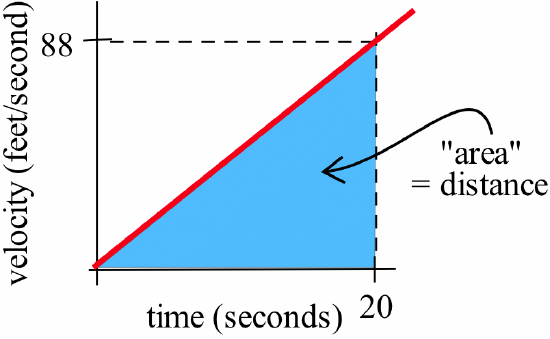
and the concept of “area as distance.”
The “area” of the triangular region represents the distance traveled:\[\mbox{distance} = \frac12 (\mbox{base})(\mbox{height}) = \frac12 (20\,\mbox{sec})\left(88\,\frac{\mbox{ft}}{\mbox{sec}}\right) = 880\,\mbox{ft}\nonumber\]The car travels a total of 880 feet during those 20 seconds.
A train initially traveling at 45 miles per hour (66 feet per second) takes 60 seconds to decelerate to a complete stop. If the train slowed down at a steady rate (the velocity decreased linearly), how many feet did the train travel before coming to a stop?
- Answer
-
Draw a graph of the velocity function:

and then use the concept of “area as distance”:
\begin{align*}
\mbox{distance} &= \mbox{area of shaded region}\\
&= \frac12(\mbox{base})(\mbox{height})\\
&= \frac12(60\,\mbox{sec})\left(66\,\frac{\mbox{ft}}{\mbox{sec}}\right) = 1980\,\mbox{feet}\end{align*}
You and a friend start off at noon and walk in the same direction along the same path at the rates shown below:

- Who is walking faster at 2:00 p.m.? Who is ahead at 2:00 p.m.?
- Who is walking faster at 3:00 p.m.? Who is ahead at 3:00 p.m.?
- When will you and your friend be together? (Answer in words.)
- Answer
-
- At 2:00 p.m. both are walking at the same velocity. You are ahead.
- At 3:00 p.m. your friend is walking faster than you, but you are still ahead. (The “area” under your velocity curve is larger than the “area” under your friend’s.)
- You and your friend will be together on the trail when the “areas” (distances) under the two velocity graphs are equal.
In the preceding Example and Practice problems, a function represented a rate of travel (in miles per hour, for instance) and the area represented the total distance traveled. For functions representing other rates, such as the production of a factory (bicycles per day) or the flow of water in a river (gallons per minute) or traffic over a bridge (cars per minute) or the spread of a disease (newly sick people per week), the area will still represent the total amount of something.
If \(f(t)\) represents a positive rate (in units per time interval) at time \(t\), then the “area” between the graph of \(f\) and the \(t\)-axis and the vertical lines at times \(t=a\) and \(t=b\) will be the total amount of {something} that accumulates between times \(a\) and \(b\):

For example, the figure below shows the flow rate (in cubic feet per second) of water in the Skykomish River near the town of Gold Bar, Washington:

The area of the shaded region represents the total volume (cubic feet) of water flowing past the town during the month of October:
\begin{align*}\mbox{total water} &= \mbox{“area”} = \mbox{area of rectangle} + \mbox{area of triangle}\\ &\approx \left(2000\,\frac{\mbox{ft}^3}{\mbox{sec}}\right)(30\,\mbox{days}) + \frac12\left(1500\,\frac{\mbox{ft}^3}{\mbox{sec}}\right)(30\,\mbox{days})\\ &= \left(2750\,\frac{\mbox{ft}^3}{\mbox{sec}}\right)(30\,\mbox{days}) = \left(2750\,\frac{\mbox{ft}^3}{\mbox{sec}}\right)(2592000\,\mbox{sec})\\ &\approx 7.128\times 10^9\,\mbox{ft}^3\end{align*}
For comparison, the flow over Niagara Falls is about \(2.12\times 10^5\,\frac{\mbox{ft}^3}{\mbox{sec}}\).
Problems
-
- Calculate the area of the shaded region:

- Calculate the area of the shaded region:

- Calculate the area of the shaded region:
- Calculate the area of the trapezoidal region in the figure below left by breaking it into a triangle and a rectangle.

- Break the region shown above right into a triangle and rectangle and verify that the total area of the trapezoid is \(\displaystyle b\cdot\left(\frac{h + H}{2}\right)\).
-
- Calculate the sum of the rectangular areas in the region shown below left.
![Two graphs of a red curve y=1+x^2 on a [0,2]X[0,6] grid. The graph on the left has two green-shaded rectangles of width 1 below the curve with their bases on the horizontal axis and their upper-left corners on the curve at (0,1) and (1,2). In the graph on the right, the region below the curve, above the horizontal axis and between x = 0 and x = 2 is shaded blue.](https://math.libretexts.org/@api/deki/files/140564/fig400_23.png?revision=1&size=bestfit&width=428&height=248)
- What can you say about the area of the shaded region shown above right?
- Calculate the sum of the rectangular areas in the region shown below left.
-
- Calculate the sum of the areas of the rectangles shown below left.

- What can you say about the area of the shaded region shown above right?
- Calculate the sum of the areas of the rectangles shown below left.
-
- Calculate the sum of the areas of the trapezoids shown below left.

- What can you say about the area of the shaded region shown above right?
- Calculate the sum of the areas of the trapezoids shown below left.
- Consider the region bounded by the graph of \(y = 2+x^3\), the positive \(x\)-axis, the positive \(y\)-axis and the line \(x=2\). Use two well-placed rectangles to estimate the area of this region.
- Consider the region bounded by the graph of \(y = 9-3^x\), the positive \(x\)-axis and the positive \(y\)-axis. Use two well-placed trapezoids to estimate the area of this region.
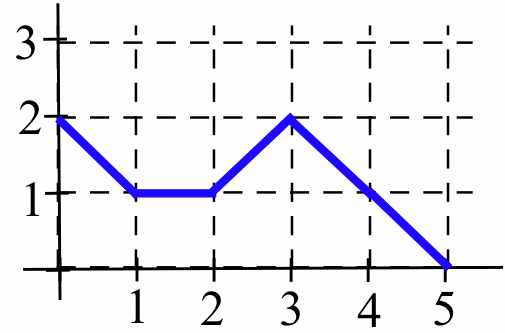
- Let \(A(x)\) represent the area bounded by the graph of the function shown below, the horizontal axis, and vertical lines at \(t=0\) and \(t=x\):

Evaluate \(A(x)\) for \(x = 1\), \(2\), \(3\), \(4\) and \(5\). - Let \(B(x)\) represent the area bounded by the graph of the function shown below, the horizontal axis, and vertical lines at \(t=0\) and \(t=x\):
Evaluate \(B(x)\) for \(x = 1\), \(2\), \(3\), \(4\) and \(5\). - Let \(C(x)\) represent the area bounded by the graph of the function shown below, the horizontal axis, and vertical lines at \(t=0\) and \(t=x\):

Evaluate \(C(x)\) for \(x = 1\), \(2\) and \(3\), and use that information to deduce a formula for \(C(x)\). - Let \(A(x)\) represent the area bounded by the graph of the function shown below, the horizontal axis, and vertical lines at \(t=0\) and \(t=x\):

Evaluate \(A(x)\) for \(x = 1\), \(2\) and \(3\), and find a formula for \(A(x)\). - The figure below shows the velocity of a car during a 30-second time frame:

How far did the car travel between \(t=0\) to \(t=30\) seconds? - The figure below shows the velocity of a car during a 30-second time frame:

How far did the car travel between \(t=0\) to \(t=30\) seconds? - The figure below shows the velocities of two cars:

From the time the brakes were applied:- how long did it take each car to stop?
- which car traveled farther before stopping?
- A speeder traveling 45 miles per hour (in a 25-mph zone) passes a stopped police car, which immediately takes off after the speeder. If the police car speeds up steadily to 60 mph over a 10-second interval and then travels at a constant 60 mph, how long — and how far — will it be before the police car catches the speeder, who continued traveling at 45 mph?

- Fill in the table with the units for “area” of a rectangle with the given base and height units.
base height “area” miles per second seconds hours dollars per hour square feet feet kilowatts hours houses people per house meals meals