
5.8: Additional Applications
- Page ID
- 212051

\( \newcommand{\vecs}[1]{\overset { \scriptstyle \rightharpoonup} {\mathbf{#1}} } \)
\( \newcommand{\vecd}[1]{\overset{-\!-\!\rightharpoonup}{\vphantom{a}\smash {#1}}} \)
\( \newcommand{\dsum}{\displaystyle\sum\limits} \)
\( \newcommand{\dint}{\displaystyle\int\limits} \)
\( \newcommand{\dlim}{\displaystyle\lim\limits} \)
\( \newcommand{\id}{\mathrm{id}}\) \( \newcommand{\Span}{\mathrm{span}}\)
( \newcommand{\kernel}{\mathrm{null}\,}\) \( \newcommand{\range}{\mathrm{range}\,}\)
\( \newcommand{\RealPart}{\mathrm{Re}}\) \( \newcommand{\ImaginaryPart}{\mathrm{Im}}\)
\( \newcommand{\Argument}{\mathrm{Arg}}\) \( \newcommand{\norm}[1]{\| #1 \|}\)
\( \newcommand{\inner}[2]{\langle #1, #2 \rangle}\)
\( \newcommand{\Span}{\mathrm{span}}\)
\( \newcommand{\id}{\mathrm{id}}\)
\( \newcommand{\Span}{\mathrm{span}}\)
\( \newcommand{\kernel}{\mathrm{null}\,}\)
\( \newcommand{\range}{\mathrm{range}\,}\)
\( \newcommand{\RealPart}{\mathrm{Re}}\)
\( \newcommand{\ImaginaryPart}{\mathrm{Im}}\)
\( \newcommand{\Argument}{\mathrm{Arg}}\)
\( \newcommand{\norm}[1]{\| #1 \|}\)
\( \newcommand{\inner}[2]{\langle #1, #2 \rangle}\)
\( \newcommand{\Span}{\mathrm{span}}\) \( \newcommand{\AA}{\unicode[.8,0]{x212B}}\)
\( \newcommand{\vectorA}[1]{\vec{#1}} % arrow\)
\( \newcommand{\vectorAt}[1]{\vec{\text{#1}}} % arrow\)
\( \newcommand{\vectorB}[1]{\overset { \scriptstyle \rightharpoonup} {\mathbf{#1}} } \)
\( \newcommand{\vectorC}[1]{\textbf{#1}} \)
\( \newcommand{\vectorD}[1]{\overrightarrow{#1}} \)
\( \newcommand{\vectorDt}[1]{\overrightarrow{\text{#1}}} \)
\( \newcommand{\vectE}[1]{\overset{-\!-\!\rightharpoonup}{\vphantom{a}\smash{\mathbf {#1}}}} \)
\( \newcommand{\vecs}[1]{\overset { \scriptstyle \rightharpoonup} {\mathbf{#1}} } \)
\(\newcommand{\longvect}{\overrightarrow}\)
\( \newcommand{\vecd}[1]{\overset{-\!-\!\rightharpoonup}{\vphantom{a}\smash {#1}}} \)
\(\newcommand{\avec}{\mathbf a}\) \(\newcommand{\bvec}{\mathbf b}\) \(\newcommand{\cvec}{\mathbf c}\) \(\newcommand{\dvec}{\mathbf d}\) \(\newcommand{\dtil}{\widetilde{\mathbf d}}\) \(\newcommand{\evec}{\mathbf e}\) \(\newcommand{\fvec}{\mathbf f}\) \(\newcommand{\nvec}{\mathbf n}\) \(\newcommand{\pvec}{\mathbf p}\) \(\newcommand{\qvec}{\mathbf q}\) \(\newcommand{\svec}{\mathbf s}\) \(\newcommand{\tvec}{\mathbf t}\) \(\newcommand{\uvec}{\mathbf u}\) \(\newcommand{\vvec}{\mathbf v}\) \(\newcommand{\wvec}{\mathbf w}\) \(\newcommand{\xvec}{\mathbf x}\) \(\newcommand{\yvec}{\mathbf y}\) \(\newcommand{\zvec}{\mathbf z}\) \(\newcommand{\rvec}{\mathbf r}\) \(\newcommand{\mvec}{\mathbf m}\) \(\newcommand{\zerovec}{\mathbf 0}\) \(\newcommand{\onevec}{\mathbf 1}\) \(\newcommand{\real}{\mathbb R}\) \(\newcommand{\twovec}[2]{\left[\begin{array}{r}#1 \\ #2 \end{array}\right]}\) \(\newcommand{\ctwovec}[2]{\left[\begin{array}{c}#1 \\ #2 \end{array}\right]}\) \(\newcommand{\threevec}[3]{\left[\begin{array}{r}#1 \\ #2 \\ #3 \end{array}\right]}\) \(\newcommand{\cthreevec}[3]{\left[\begin{array}{c}#1 \\ #2 \\ #3 \end{array}\right]}\) \(\newcommand{\fourvec}[4]{\left[\begin{array}{r}#1 \\ #2 \\ #3 \\ #4 \end{array}\right]}\) \(\newcommand{\cfourvec}[4]{\left[\begin{array}{c}#1 \\ #2 \\ #3 \\ #4 \end{array}\right]}\) \(\newcommand{\fivevec}[5]{\left[\begin{array}{r}#1 \\ #2 \\ #3 \\ #4 \\ #5 \\ \end{array}\right]}\) \(\newcommand{\cfivevec}[5]{\left[\begin{array}{c}#1 \\ #2 \\ #3 \\ #4 \\ #5 \\ \end{array}\right]}\) \(\newcommand{\mattwo}[4]{\left[\begin{array}{rr}#1 \amp #2 \\ #3 \amp #4 \\ \end{array}\right]}\) \(\newcommand{\laspan}[1]{\text{Span}\{#1\}}\) \(\newcommand{\bcal}{\cal B}\) \(\newcommand{\ccal}{\cal C}\) \(\newcommand{\scal}{\cal S}\) \(\newcommand{\wcal}{\cal W}\) \(\newcommand{\ecal}{\cal E}\) \(\newcommand{\coords}[2]{\left\{#1\right\}_{#2}}\) \(\newcommand{\gray}[1]{\color{gray}{#1}}\) \(\newcommand{\lgray}[1]{\color{lightgray}{#1}}\) \(\newcommand{\rank}{\operatorname{rank}}\) \(\newcommand{\row}{\text{Row}}\) \(\newcommand{\col}{\text{Col}}\) \(\renewcommand{\row}{\text{Row}}\) \(\newcommand{\nul}{\text{Nul}}\) \(\newcommand{\var}{\text{Var}}\) \(\newcommand{\corr}{\text{corr}}\) \(\newcommand{\len}[1]{\left|#1\right|}\) \(\newcommand{\bbar}{\overline{\bvec}}\) \(\newcommand{\bhat}{\widehat{\bvec}}\) \(\newcommand{\bperp}{\bvec^\perp}\) \(\newcommand{\xhat}{\widehat{\xvec}}\) \(\newcommand{\vhat}{\widehat{\vvec}}\) \(\newcommand{\uhat}{\widehat{\uvec}}\) \(\newcommand{\what}{\widehat{\wvec}}\) \(\newcommand{\Sighat}{\widehat{\Sigma}}\) \(\newcommand{\lt}{<}\) \(\newcommand{\gt}{>}\) \(\newcommand{\amp}{&}\) \(\definecolor{fillinmathshade}{gray}{0.9}\)This section introduces two additional applications of integrals that once again illustrate the process of going from an applied problem to a Riemann sum and on to a definite integral. A third application does not follow this process: it uses the idea of “area” to model an election and to qualitatively understand why certain election outcomes occur.
The main point of this section is to demonstrate the power of definite integrals to solve a wide variety of applied problems. Each of these new applications is treated more briefly than those in the previous sections. These are far from the only applications that could be included here. By now, however, you should have developed enough of an understanding of the Riemann-sum process so that when you encounter other applications (in physics, engineering, biology, statistics, probability, economics, computer graphics … ) you will be able to use that process to set up an integral to compute or approximate a desired quantity.
Fluid Pressures and Forces
In physics, pressure is defined as force per unit of area. The hydrostatic pressure on an object immersed in a fluid (such as water) is the product of the density of that fluid and the depth of the object:\[\mbox{pressure} = (\mbox{density})(\mbox{depth})\nonumber\]The total hydrostatic force applied against an immersed object is the sum of the hydrostatic forces against each part of the object. (Fluids exert pressure in all possible directions, and the forces due to this pressure act on solid objects in a direction perpendicular to the object.)
In the metric system, the standard unit of force is a pascal (abbreviated “Pa”):\[1\,\mbox{Pa} = 1\,\frac{\mbox{N}}{\mbox{m}}\nonumber\]and named after Blaise Pascal (1623–1662), a French mathematician, physicist, inventor, writer and philosopher.
If an entire object is at the same depth, we can determine the total hydrostatic force against that (necessarily flat) object simply by multiplying the density of the fluid times the depth of the object times the object's area. If the unit of density is “pounds per cubic foot” and depth is measured in “feet,” then the unit of pressure is “pounds per square foot,” a measure of force per unit of area. If pressure, with the units “pounds per square foot,” is multiplied by an area with units “square feet,” the result is a force, measured in “pounds.”
Find the total hydrostatic force against the bottom of the freshwater aquarium shown below:

Solution
Water’s desity is \(\displaystyle 62.5\,\frac{\mbox{lb}}{\mbox{ft}^3}\), so the total hydrostatic force is:\[(\mbox{density})\cdot(\mbox{depth})\cdot(\mbox{area}) = \left(62.5\,\frac{\mbox{lb}}{\mbox{ft}^3}\right)\cdot\left(3\,\mbox{ft}\right)\cdot\left(2\,\mbox{ft}^2\right)\nonumber\]or \(375\,\mbox{lbs}\). Finding the total hydrostatic force against the front of the aquarium is a very different problem, because different parts of that front face are located at different depths and subject to different pressures.
To compute the force against the front of the aquarium, we can partition it into \(n\) thin horizontal slices:

and focus on one of them. Because the slice is very thin, every part of the \(k\)-th slice is at (almost) the same depth, so every part of that slice is subject to (almost) the same pressure. We can approximate the total hydrostatic force against the slice at the depth \(x_k\) as:\[(\mbox{density})\cdot(\mbox{depth})\cdot(\mbox{area}) = \left(62.5\,\frac{\mbox{lb}}{\mbox{ft}^3}\right)\cdot\left(x_k\,\mbox{ft}\right)\cdot\left(2\,\mbox{ft}\right)\left(\Delta x_k\,\mbox{ft}\right)\nonumber\]or \(125x_k\cdot\Delta x_k\,\mbox{lbs}\). The total hydrostatic force against the front is the sum of the forces against each slice:\[\mbox{total hydrostatic force} \approx \sum_{k=0}^{n} \, 125x_k\cdot\Delta x_k\nonumber\]which is a Riemann sum. The limit of this Riemann sum as the slices get thinner (\(\Delta x_k \rightarrow 0\)) is a definite integral:\[\sum_{k=0}^{n} \, 125x_k\cdot\Delta x_k \ \longrightarrow \ \int_{x=0}^{x=3} 125x\, dx = \Big[62.5 x^2\Big]_{x=0}^{x=3} = 562.5\,\mbox{lbs}\nonumber\]
Find the total hydrostatic force against one side of the aquarium and the total force against the entire aquarium.
- Answer
-
The reasoning for a side of the aquarium is exactly the same as for the front, except a side is 1 foot long instead of 2, so the force is half of that against the front: 281.25 lbs. The total force against all sides (and the bottom) is:\[2(281.25) + 2(562.5) + 375 = 2062.5\ \mbox{lbs}\nonumber\]
Find the total hydrostatic force against viewing windows \(A\) and \(B\) in the freshwater aquarium shown below:

Solution
For window \(A\), using similar triangles, the width \(w\) of a slice at depth \(x\) m satisfies:\[\frac{w}{6-x} = \frac{3}{2} \ \Rightarrow \ w = \frac32(6-x) = 9-\frac32 x\nonumber\]so the area of a slice of height \(\Delta x_k\) m at depth \(x_k\) m is \(\left(9-\frac32 x_k\right)\Delta x_k\, \mbox{m}^2\). The density of water is \(1000\,\frac{\mbox{kg}}{\mbox{m}^3}\). Multiplying this density by area (with units \(\mbox{m}^2\)) would give kg per m, but pressure is measured in N per m, so we need to multiply by the acceleration due to gravity, \(g \approx 9.81\,\frac{\mbox{m}}{\mbox{sec}^2}\). The hydrostatic force applied to the \(k\)-th slice is thus:\[1000(9.81)x_k\left(9-\frac32 x_k\right)\Delta x_k\nonumber\]and the total hydrostatic force applied to the window is therefore:
\begin{align*}\int_{x=4}^{x=6} 9810 & \left[9x-\frac32 x^2\right]\, dx = 9810\bigg[\frac92 x^2 - \frac12 x^3\bigg]_4^6 \\
&= 9810\left[(162-108)-(72-32)\right] = 137340\,\mbox{N}\end{align*}
For window \(B\), applying the Pythagorean Theorem yields:\[(5-x)^2 + \left(\frac{w}{2}\right)^2 = 1 \ \Rightarrow \ w = 2\sqrt{1 - (5-x)^2}\nonumber\]The total hydrostatic force is thus:\[\int_{x=4}^{x=6} 1000(9.81)x\cdot2\sqrt{1 - (5-x)^2}\, dx\nonumber\]which (using technology) is approximately 154,095 N.
Find the total hydrostatic force against viewing windows \(C\) and \(D\) of the freshwater aquarium shown below:

- Answer
-
For window \(C\), using similar triangles the width \(w\) of a slice at depth \(x\) m satisfies:\[\frac{w}{x-4} = \frac{3}{2} \ \Rightarrow \ w = \frac32(x-4) = \frac32 x - 6\nonumber\]so the area of a slice of height \(\Delta x_k\) m at depth \(x_k\) m is \(\left(\frac32 x_k - 6\right)\Delta x_k\, \mbox{m}^2\). The density of water is \(1000\,\frac{\mbox{kg}}{\mbox{m}^3}\) and \(g \approx 9.81\,\frac{\mbox{m}}{\mbox{sec}^2}\), so the hydrostatic force applied to the \(k\)-th slice is:\[1000(9.81)x_k\left(\frac32 x_k - 6\right)\Delta x_k\nonumber\]and the total hydrostatic force applied to the window is therefore:
\begin{align*}\int_{x=4}^{x=6} 9810 & \left[\frac32 x^2 - 6x\right]\, dx = 9810\bigg[\frac12 x^3 - 3x^2\bigg]_4^6 \\
&= 9810\Big[(108-108)-(32-48)\Big] = 156960\,\mbox{N}\end{align*}
For window \(D\), the width is \(3\) at all depths, so the total hydrostatic force against the window is:\[\int_{x=4}^{x=6} 1000(9.81)x\cdot3 \, dx = 14715 x^2\bigg|_4^6 = 294300\ \mbox{N}\nonumber\] (Windows \(A\) (from Example 2) and \(C\) (with a horizontal flip) fit together to form window \(D\), so it is encouraging that the sum of the total hydrostatic forces against \(A\) and \(C\) is \(137340 + 156960 = 294300\) N, the total hydrostatic force against window \(D\).)
Because the total force at even moderate depths is so large, underwater windows are made of thick glass or plastic and strongly secured to their frames. Similarly, the bottom of a dam is much thicker than the top in order to withstand the greater force against the bottom.
Kinetic Energy
Physicists define the kinetic energy (energy of motion) of an object with mass \(m\) and velocity \(v\) to be:\[\mbox{KE} = \frac12 m\cdot v^2\nonumber\]The greater the mass of an object or the faster it is moves, the greater its kinetic energy. If every part of the object has the same velocity, computing its kinetic energy becomes relatively easy.
Sometimes, however, different parts of an object move with different velocities. For example, if an ice skater is spinning with an angular velocity of 2 revolutions per second, her arms travel further in one second (have a greater linear velocity) when they are extended than when drawn in close to her body:

So the ice skater, spinning at 2 revolutions per second, has greater kinetic energy when her arms are extended. Similarly, the tip of a rotating propeller (or the barrel of a swinging baseball bat) has a greater linear velocity than other parts of the propeller (or the bat’s handle).
If the units of mass are kg and the units of velocity are m/sec\(^2\), then:\[\mbox{KE} = \frac12 \left(m\,\mbox{kg}\right)\cdot \left(v\ \frac{\mbox{m}}{\mbox{sec}}\right)^2 = \frac12 mv^2\ \mbox{kg}\cdot\mbox{m} \cdot \frac{\mbox{m}}{\mbox{sec}^2}\nonumber\]so the units of kinetic energy are N-m, or Joules, the same as work. Similarly, if the units of mass are g and the units of velocity are cm/sec\(^2\), then the units of kinetic energy are dyn-cm, or ergs.
A point-mass of 1 gram at the end of a (massless) 100-cm string rotates at a rate of 2 revolutions per second:

- Find the kinetic energy of the point-mass.
- Find its kinetic energy if the string is 200 cm long.
Solution
- In one second, the mass travels twice around a circle with radius 100 cm so it travels \(2\cdot(2\pi\cdot 100) = 400\pi\) cm. Its velocity is thus \(v = 400\pi\) cm/sec, and:\[\mbox{KE} = \frac12 mv^2 = \frac12 \left(1\ \mbox{g}\right)\cdot \left(400\pi\ \frac{\mbox{cm}}{\mbox{sec}}\right)^2 = 80000\pi^2\ \mbox{ergs}\nonumber\]or about \(0.079\) J.
- If the string is 200 cm long, then the velocity is \(2\cdot(2\pi\cdot 400) = 800\pi\) cm/sec and:\[\mbox{KE} = \frac12 mv^2 = \frac12 \left(1\ \mbox{g}\right)\cdot \left(800\pi\ \frac{\mbox{cm}}{\mbox{sec}}\right)^2 = 320000\pi^2\ \mbox{ergs}\nonumber\]or about \(0.316\) J.
(When the length of the string doubles, the velocity doubles and the kinetic energy quadruples.)
A 1-gram point-mass at the end of a 2-meter (massless) string rotates at a rate of 4 revolutions per second. Find the kinetic energy of the point mass.
- Answer
-
The object travels \(2\pi\left(2\ \mbox{m}\right) = 4\pi\) m during one revolution, so during the \(1\) second it takes to make \(4\) revolutions, the object travels \(16\pi\) m; its velocity is thus \(v = 1600\pi\ \frac{\mbox{cm}}{\mbox{sec}}\) and its kinetic energy is:\[\frac12 m \cdot v^2 = \frac12\left(1\ \mbox{g}\right)\left(1600\pi \ \frac{\mbox{cm}}{\mbox{sec}}\right)^2 = 1280000\pi^2 \ \mbox{ergs} \approx 12633094\ \mbox{ergs}\nonumber\]
If different parts of a rotating object are different distances from the axis of rotation, then those parts have different linear velocities, and it becomes more difficult to calculate the total kinetic energy of the object. By now the method should seem very familiar: partition the object into small pieces, approximate the kinetic energy of each piece, and add the kinetic energies of the small pieces (a Riemann sum) to approximate the total kinetic energy of the object. The limit of the Riemann sum as the pieces get smaller is a definite integral.
The density of a narrow bar:

is 5 grams per meter of length. Find the kinetic energy of the 3-meter-long bar when it rotates at a rate of 2 revolutions per second.
Solution
Partition the bar into \(n\) pieces:

so that the mass of the \(k\)-th piece is:\[m_k \approx (\mbox{length})\cdot(\mbox{density}) = \left(\Delta x_k\ \mbox{m}\right)\left(5\ \frac{\mbox{g}}{\mbox{m}}\right) = 5\cdot\Delta x_k\ \mbox{g}\nonumber\]During one second, the \(k\)-th piece, located at a distance of \(x_k\) m from the pivot line, will make two revolutions, traveling approximately:\[2\left(2\pi\left[\mbox{radius}\right]\right) = 4\pi\Big[100x_k\ \mbox{cm}\Big] = 400\pi x_k\ \mbox{cm}\nonumber\]so \(v_k \approx 400\pi x_k\) cm/sec. The kinetic energy of the \(k\)-th piece is:\[\frac12 m_k\cdot v_k^2 \approx \frac12 \left(5\Delta x_k \ \mbox{g}\right)\left(400\pi x_k \ \frac{\mbox{cm}}{\mbox{sec}}\right)^2 = 400000\pi^2x_k^2\ \mbox{ergs}\nonumber\]and the total kinetic energy of the rotating bar is therefore:\[\sum_{k=1}^n 400000\pi^2 x_k^2\cdot\Delta x_k \ \longrightarrow \ \int_{x=0}^{x=3} 400000\pi^2 x^2\, dx =400000\pi^2\bigg[\frac13 x^3\bigg]_0^3\nonumber\]which equals \(3600000\pi^2\) ergs, or about \(3.55\) J.
Find the kinetic energy of the bar in the previous Example if it rotates at 2 revolutions per second at the end of a 100-centimeter (massless) string:

- Answer
-
Everything remains the same as in Example 4, except for the endpoints of integration:\[\int_{x=1}^{x=4} 400000\pi^2 x^2\, dx =400000\pi^2\bigg[\frac13 x^3\bigg]_1^4 = 8400000\pi^2\ \mbox{ergs}\nonumber\]which is approximately \(82,904,677\) ergs, or \(8.29\) J.
Find the kinetic energy of the thin, flat object with density 0.17 g/cm\(^2\) shown below:

when it rotates at 45 revolutions per minute.
Solution
We can partition the object along one radial line and form \(n\) annular “slices” each \(\Delta x\) cm wide. Then the “slice” between \(x_k\) and \(x_k + \Delta x\) is a thin annulus (a disk with a smaller disk removed from its center) with area: \begin{align*}\pi\left(x_k + \Delta x\right)^2 - \pi\left(x_k\right)^2 &= \pi\left[x_k^2+ 2x_k \Delta x + \left(\Delta x\right)^2 - x_k^2\right] \\ &= 2\pi x_k \Delta x + \pi\left(\Delta x\right)^2 \approx 2\pi x_k \Delta x\end{align*} and mass \((0.17)2\pi x_k \Delta x\). During one revolution, a point on this slice travels approximately \(2\pi x_k\) cm and \(45\) rev/min is equivalent to \(\frac34\) rev/sec, so the linear velocity of the point is \(2\pi x_k \cdot \frac34 = \frac32 \pi x_k\) cm/sec. The kinetic energy of this slice is therefore:\[\Big((0.17)2\pi x_k \Delta x\Big)\left(\frac32 \pi x_k\right)^2 = \frac92(0.17)\pi^2 x_k^3 \Delta x\nonumber\] so the total kinetic energy of the object is:\[\sum_{k=1}^n \, \frac92(0.17)\pi^2 x_k^3 \cdot\Delta x \ \longrightarrow \ \int_a^b \frac92 (0.17)\pi^2 x^3\, dx\nonumber\]Evaluating this integral yields:\[\frac92(0.17)\pi^2\bigg[ \frac14 x^4 \bigg]_a^b = \frac98 (0.17)\pi^2\left[b^4-a^4\right]\nonumber\]Because \(b\) is raised to the fourth power, a small increase in the value of \(b\) (if \(b > 1\)) leads to a large increase in the object’s kinetic energy.
(The “slices” that give rise to the Riemann sum in this problem are — unlike most examples we have seen previously — not rectangles. We also use here the notion that if \(\Delta x\) is small, then \(\left(\Delta x\right)^2\) is very small, so we can essentially ignore it in our approximation of area.)
If \(a = 0.75\) in \(\approx 1.905\) cm and \(b = 3.75\) in \(\approx 9.525\) cm, the total mass of the object is \(42\) g and its total kinetic energy is about 15,512 ergs.
(In the not-so-distant past your grandparents (and perhaps even your parents) used such objects to listen to music — and each one only held two songs!)
Areas and Elections
The previous applications in this chapter have used definite integrals to determine areas, volumes, pressures and energies precisely. But exactness and numerical precision are not the same as “understanding,” and sometimes we can gain insight and understanding simply by determining which of two areas or integrals is larger. One situation of this type involves models of elections.
Suppose the voters of a state have been surveyed about their positions on a single issue, with their responses recorded on a quantitative scale. The distribution of voters who place themselves at each position on this issue appears below:

Suppose also that each voter casts his or her vote for the candidate whose position on this issue is closest to his or her position.
If two candidates have taken the positions labeled \(A\) and \(B\), then a voter at position \(c\) votes for the candidate at \(A\) because \(A\) is closer to \(c\) than \(B\) is to \(c\). Similarly, a voter at position \(d\) votes for the candidate at \(B\). The total votes for the candidate at \(A\) in this election is represented by the shaded area under the curve:

and the candidate with the larger number of votes — the larger area — wins the election. In this illustration, the candidate at \(A\) wins.
The distribution of voters on an issue appears below left. If these voters decide between candidates on the basis of that single issue, which candidate will win the election?


Solution
The figure above right illustrates that \(A\) corresponds to a larger area (more votes) than \(B\): \(A\) will win.
In an election between candidates with positions \(A\) and \(B\) in the figure below:

who will win?
- Answer
-
The shaded regions in the figure below:

show the total votes for each candidate: \(B\) wins.
If voters behave as described and if the election is between two candidates, then we can give the candidates some advice. The best position for a candidate is at the “median point,” the location that divides the voters into two equal-sized (equal-area) groups so that half of the voters are on one side of the median point and half are on the other side:

A candidate at the median point gets more votes than a candidate at any other point. (Why?)
If two candidates have positions on opposite sides of the median point:

then a candidate can get more votes by moving a bit toward the median point. This “move toward the middle ground” commonly occurs in elections as candidates attempt to sell themselves as “moderates” and their opponents as “extremists.”
If more than two candidates are running in an election, the situation changes dramatically. A candidate at the median position, the unbeatable place in a two-candidate election can even get the fewest votes. If the figure below:

represents the distribution of voters on the single issue in the election, then candidate \(A\) would beat \(B\) in an election just between \(A\) and \(B\):

and \(A\) would beat \(C\) in an election just between \(A\) and \(C\):

But in an election among all three candidates, \(A\) would get the fewest votes:

This type of situation really does occur. It leads to the political saying about a primary election with many candidates and a general election between the final nominees from two parties: “extremists can win primaries, but moderates are elected to office.”
The previous discussion of elections and areas is greatly oversimplified. Most elections involve several issues of different importance to different voters, and the views of the voters are seldom completely known before the election. Many candidates take “fuzzy” positions on issues. And it is not even certain that real voters vote for the candidate with the “closest” position: perhaps they don't vote at all unless some candidate is “close enough” to their position. But this very simple model of elections can still help us understand how and why some things happen in elections. It is also a starting place for building more sophisticated models to help understand more complicated election situations and to test assumptions about how voters really do make voting decisions.
Problems
In Problems 1–5, use \(\rho\) for the density of the fluid in the given container.
- Calculate the force against windows \(A\) and \(B\) in the figure below:

- Calculate the force against windows \(C\) and \(D\) in the figure above.
- Calculate the total force against each end of the tank shown below:

How does the total force against the ends of the tank change if the length of the tank is doubled? - Calculate the total force against each end of the tank shown below:

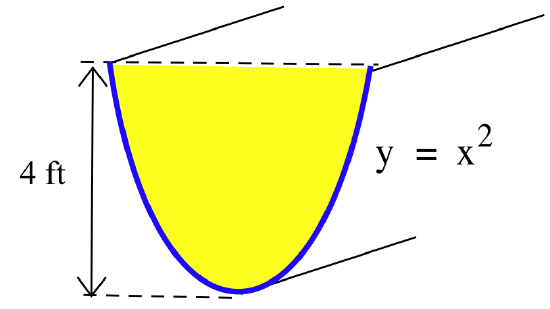
- Calculate the total force against the end of the tank shown below:
- The three tanks shown below are all 6 feet tall and the top perimeter of each tank is 10 feet:

Which tank has the greatest total force against its sides? - The three tanks shown below are all 6 feet tall and the cross-sectional area of each tank is 16 ft\(^2\):

Which tank has the greatest total force against its sides? - Calculate the total force against the bottom 2 feet of the sides of a tank with a square 40-foot by 40-foot base that is filled with water:
- to a depth of 30 feet.
- to a depth of 35 feet.
- Calculate the total force against the bottom 2 feet of the side of a cylindrical tank with a radius of 20 feet that is filled with water:
- to a depth of 30 feet.
- to a depth of 35 feet.
- Calculate the total force against the side and bottom of a cylindrical aluminum soda can with diameter 6 cm and height 12 cm if it is filled with 385 g of soda. (Assume the can has been opened so carbonization is not a factor.)
- Find the kinetic energy of a 20-gram object rotating at 3 revolutions per second at the end of:
- a 15-cm (massless) string and
- a 20-cm string.
- Each centimeter of a metal bar has a mass of 3 grams. Calculate the kinetic energy of the 50-centimeter bar if it is rotating at a rate of 2 revolutions per second about one of its ends.
- Each centimeter of a metal bar has a mass of 3 grams. Calculate the kinetic energy of the 50-centimeter bar if it is rotating at a rate of 2 revolutions per second at the end of a 10-cm cable.
- Calculate the kinetic energy of a 20-gram meter stick if it is rotating at a rate of 1 revolution per second about one of its ends.
- Calculate the kinetic energy of a 20-gram meter stick if it is rotating at a rate of 1 revolution per second about its center point.
- A flat, circular plate is made from material that has a density of 2 grams per cubic centimeter. The plate is 5 centimeters thick, has a radius of 30 centimeters and is rotating about its center at a rate of 2 revolutions per second.
- Calculate its kinetic energy.
- Find the radius of a plate that would have twice the kinetic energy of the first plate, assuming the density, thickness and rotation rate are the same.
- Each “washer” in the figure below is made from material with density of 1 gram per cm\(^3\), and each is rotating about its center at a rate of 3 revolutions per second:

Calculate the kinetic energy of each washer (dimensions are in cm). - The rectangular plate shown below is 1 cm thick, 10 cm long and 6 cm wide and is made of a material with a density of 3 grams per cm\(^3\):
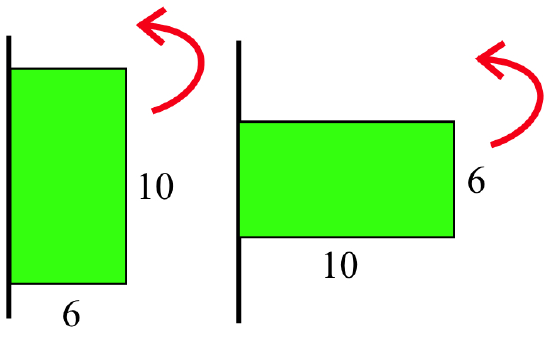
Calculate the kinetic energy of of the plate if it is rotating at a rate of 2 revolutions per second:- about its 10-cm side and
- about its 6-cm side.
- Calculate the kinetic energy of the plate in Problem 18 if it is rotating at a rate of 2 revolutions per second about a vertical line through the center of the plate, as shown below left:

- Calculate the kinetic energy of the plate in Problem 18 if it is rotating at a rate of 2 revolutions per second about a vertical line through the center of the plate, as shown above right.
- For the voter distribution shown below:

which candidates would the voters at positions \(a\), \(b\) and \(c\) vote for? - For the voter distribution shown below:

which candidates would the voters at positions \(a\), \(b\) and \(c\) vote for? - Shade the region representing votes for candidate \(A\) in the distribution shown below:

Which candidate wins? - Shade the region representing votes for candidate \(A\) in the distribution shown below:

Which candidate wins? - Refer to the voter distribution shown below:

- Which candidate wins?
- If candidate \(B\) withdraws before the election, which candidate will win?
- If candidate \(B\) stays in the election but \(C\) withdraws, then who wins?
- Refer to the voter distribution shown below:

- Which candidate wins?
- If candidate \(B\) withdraws before the election, which candidate will win?
- If candidate \(B\) stays in the election but \(C\) withdraws, then who wins?
- Refer to the voter distribution shown below:

- If the election is between \(A\) and \(B\), who wins?
- If the election is between \(A\) and \(C\), who wins?
- If the election is among \(A\), \(B\) and \(C\), who wins?
- Refer to the voter distribution shown below:

- If the election is between \(A\) and \(B\), who wins?
- If the election is between \(A\) and \(C\), who wins?
- If the election is among \(A\), \(B\) and \(C\), who wins?
- Sketch a distribution for a two-issue election.