
6.5: Solving Quadratic Inequalities
- Page ID
- 6272
\( \newcommand{\vecs}[1]{\overset { \scriptstyle \rightharpoonup} {\mathbf{#1}} } \)
\( \newcommand{\vecd}[1]{\overset{-\!-\!\rightharpoonup}{\vphantom{a}\smash {#1}}} \)
\( \newcommand{\dsum}{\displaystyle\sum\limits} \)
\( \newcommand{\dint}{\displaystyle\int\limits} \)
\( \newcommand{\dlim}{\displaystyle\lim\limits} \)
\( \newcommand{\id}{\mathrm{id}}\) \( \newcommand{\Span}{\mathrm{span}}\)
( \newcommand{\kernel}{\mathrm{null}\,}\) \( \newcommand{\range}{\mathrm{range}\,}\)
\( \newcommand{\RealPart}{\mathrm{Re}}\) \( \newcommand{\ImaginaryPart}{\mathrm{Im}}\)
\( \newcommand{\Argument}{\mathrm{Arg}}\) \( \newcommand{\norm}[1]{\| #1 \|}\)
\( \newcommand{\inner}[2]{\langle #1, #2 \rangle}\)
\( \newcommand{\Span}{\mathrm{span}}\)
\( \newcommand{\id}{\mathrm{id}}\)
\( \newcommand{\Span}{\mathrm{span}}\)
\( \newcommand{\kernel}{\mathrm{null}\,}\)
\( \newcommand{\range}{\mathrm{range}\,}\)
\( \newcommand{\RealPart}{\mathrm{Re}}\)
\( \newcommand{\ImaginaryPart}{\mathrm{Im}}\)
\( \newcommand{\Argument}{\mathrm{Arg}}\)
\( \newcommand{\norm}[1]{\| #1 \|}\)
\( \newcommand{\inner}[2]{\langle #1, #2 \rangle}\)
\( \newcommand{\Span}{\mathrm{span}}\) \( \newcommand{\AA}{\unicode[.8,0]{x212B}}\)
\( \newcommand{\vectorA}[1]{\vec{#1}} % arrow\)
\( \newcommand{\vectorAt}[1]{\vec{\text{#1}}} % arrow\)
\( \newcommand{\vectorB}[1]{\overset { \scriptstyle \rightharpoonup} {\mathbf{#1}} } \)
\( \newcommand{\vectorC}[1]{\textbf{#1}} \)
\( \newcommand{\vectorD}[1]{\overrightarrow{#1}} \)
\( \newcommand{\vectorDt}[1]{\overrightarrow{\text{#1}}} \)
\( \newcommand{\vectE}[1]{\overset{-\!-\!\rightharpoonup}{\vphantom{a}\smash{\mathbf {#1}}}} \)
\( \newcommand{\vecs}[1]{\overset { \scriptstyle \rightharpoonup} {\mathbf{#1}} } \)
\(\newcommand{\longvect}{\overrightarrow}\)
\( \newcommand{\vecd}[1]{\overset{-\!-\!\rightharpoonup}{\vphantom{a}\smash {#1}}} \)
\(\newcommand{\avec}{\mathbf a}\) \(\newcommand{\bvec}{\mathbf b}\) \(\newcommand{\cvec}{\mathbf c}\) \(\newcommand{\dvec}{\mathbf d}\) \(\newcommand{\dtil}{\widetilde{\mathbf d}}\) \(\newcommand{\evec}{\mathbf e}\) \(\newcommand{\fvec}{\mathbf f}\) \(\newcommand{\nvec}{\mathbf n}\) \(\newcommand{\pvec}{\mathbf p}\) \(\newcommand{\qvec}{\mathbf q}\) \(\newcommand{\svec}{\mathbf s}\) \(\newcommand{\tvec}{\mathbf t}\) \(\newcommand{\uvec}{\mathbf u}\) \(\newcommand{\vvec}{\mathbf v}\) \(\newcommand{\wvec}{\mathbf w}\) \(\newcommand{\xvec}{\mathbf x}\) \(\newcommand{\yvec}{\mathbf y}\) \(\newcommand{\zvec}{\mathbf z}\) \(\newcommand{\rvec}{\mathbf r}\) \(\newcommand{\mvec}{\mathbf m}\) \(\newcommand{\zerovec}{\mathbf 0}\) \(\newcommand{\onevec}{\mathbf 1}\) \(\newcommand{\real}{\mathbb R}\) \(\newcommand{\twovec}[2]{\left[\begin{array}{r}#1 \\ #2 \end{array}\right]}\) \(\newcommand{\ctwovec}[2]{\left[\begin{array}{c}#1 \\ #2 \end{array}\right]}\) \(\newcommand{\threevec}[3]{\left[\begin{array}{r}#1 \\ #2 \\ #3 \end{array}\right]}\) \(\newcommand{\cthreevec}[3]{\left[\begin{array}{c}#1 \\ #2 \\ #3 \end{array}\right]}\) \(\newcommand{\fourvec}[4]{\left[\begin{array}{r}#1 \\ #2 \\ #3 \\ #4 \end{array}\right]}\) \(\newcommand{\cfourvec}[4]{\left[\begin{array}{c}#1 \\ #2 \\ #3 \\ #4 \end{array}\right]}\) \(\newcommand{\fivevec}[5]{\left[\begin{array}{r}#1 \\ #2 \\ #3 \\ #4 \\ #5 \\ \end{array}\right]}\) \(\newcommand{\cfivevec}[5]{\left[\begin{array}{c}#1 \\ #2 \\ #3 \\ #4 \\ #5 \\ \end{array}\right]}\) \(\newcommand{\mattwo}[4]{\left[\begin{array}{rr}#1 \amp #2 \\ #3 \amp #4 \\ \end{array}\right]}\) \(\newcommand{\laspan}[1]{\text{Span}\{#1\}}\) \(\newcommand{\bcal}{\cal B}\) \(\newcommand{\ccal}{\cal C}\) \(\newcommand{\scal}{\cal S}\) \(\newcommand{\wcal}{\cal W}\) \(\newcommand{\ecal}{\cal E}\) \(\newcommand{\coords}[2]{\left\{#1\right\}_{#2}}\) \(\newcommand{\gray}[1]{\color{gray}{#1}}\) \(\newcommand{\lgray}[1]{\color{lightgray}{#1}}\) \(\newcommand{\rank}{\operatorname{rank}}\) \(\newcommand{\row}{\text{Row}}\) \(\newcommand{\col}{\text{Col}}\) \(\renewcommand{\row}{\text{Row}}\) \(\newcommand{\nul}{\text{Nul}}\) \(\newcommand{\var}{\text{Var}}\) \(\newcommand{\corr}{\text{corr}}\) \(\newcommand{\len}[1]{\left|#1\right|}\) \(\newcommand{\bbar}{\overline{\bvec}}\) \(\newcommand{\bhat}{\widehat{\bvec}}\) \(\newcommand{\bperp}{\bvec^\perp}\) \(\newcommand{\xhat}{\widehat{\xvec}}\) \(\newcommand{\vhat}{\widehat{\vvec}}\) \(\newcommand{\uhat}{\widehat{\uvec}}\) \(\newcommand{\what}{\widehat{\wvec}}\) \(\newcommand{\Sighat}{\widehat{\Sigma}}\) \(\newcommand{\lt}{<}\) \(\newcommand{\gt}{>}\) \(\newcommand{\amp}{&}\) \(\definecolor{fillinmathshade}{gray}{0.9}\)Learning Objectives
- Check solutions to quadratic inequalities with one variable.
- Understand the geometric relationship between solutions to quadratic inequalities and their graphs.
- Solve quadratic inequalities.
Solutions to Quadratic Inequalities
A quadratic inequality15 is a mathematical statement that relates a quadratic expression as either less than or greater than another. Some examples of quadratic inequalities solved in this section follow.
| \(x^{2}-2 x-11 \leq 0\) | \(2 x^{2}-7 x+3>0\) | \(9-x^{2}>0\) |
A solution to a quadratic inequality is a real number that will produce a true statement when substituted for the variable.
Example \(\PageIndex{1}\):
Are \(-3\), \(-2\), and \(-1\) solutions to \(x^{2}-x-6 \leq 0 \)?
Solution
Substitute the given value in for \(x\) and simplify.
\(\begin{array} {r | r | r} {x^{2}-x-6\leq0}&{x^{2}-x-6\leq0}&{x^{2}-x-6\leq0} \\ {(\color{OliveGreen}{-3}\color{black}{)}^{2}-(\color{OliveGreen}{-3}\color{black}{)}-6\leq0}&{(\color{OliveGreen}{-2}\color{black}{)}^{2}-(\color{OliveGreen}{-2}\color{black}{)}-6\leq0}&{(\color{OliveGreen}{-1}\color{black}{)}^{2}-(\color{OliveGreen}{-1}\color{black}{)}-6\leq0} \\ {9+3-6\leq0}&{4+2-6\leq0}&{1+1-6\leq0} \\ {6\leq0\:\:\color{red}{✗}}&{0\leq0\:\:\color{Cerulean}{✓}}&{-4\leq0\:\:\color{Cerulean}{✓}} \end{array}\)
Answer:
\(-2\) and \(-1\) are solutions and \(-3\) is not.
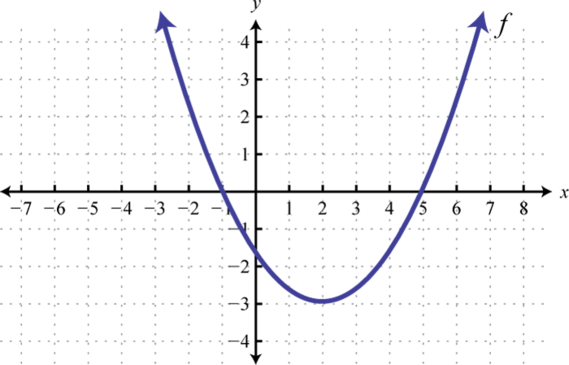
Quadratic inequalities can have infinitely many solutions, one solution, or no solution. If there are infinitely many solutions, graph the solution set on a number line and/or express the solution using interval notation. Graphing the function defined by \(f (x) = x^{2} − x − 6\) found in the previous example we have
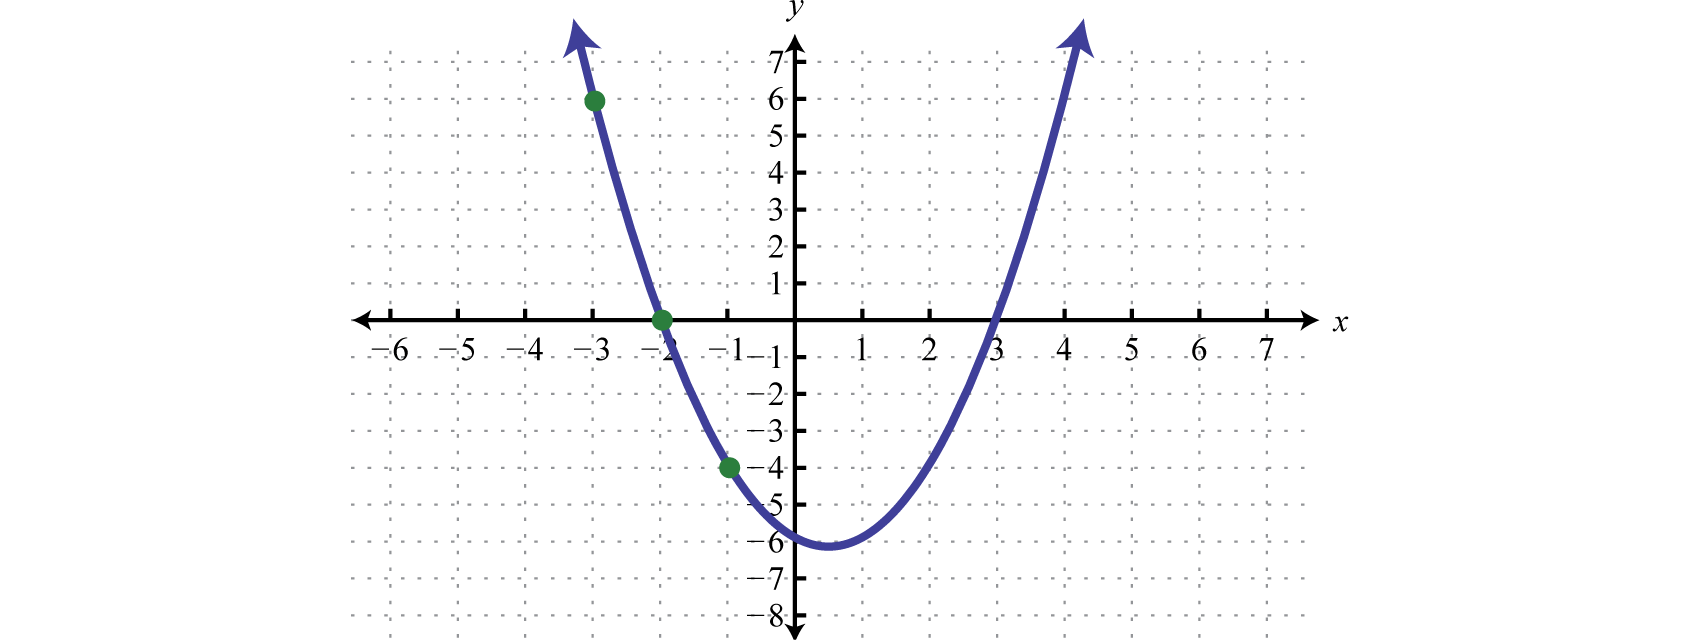
The result of evaluating for any \(x\)-value will be negative, zero, or positive.
\(\begin{aligned} f(-3)&=6 &\color{Cerulean}{Positive \:f(x)>0} \\ f(-2)&=0 &\color{Cerulean}{Zero \:f(x)\:=0} \\f(-1)&=-4 &\color{Cerulean}{Negative \:f(x)<0} \end{aligned}\)
The values in the domain of a function that separate regions that produce positive or negative results are called critical numbers16. In the case of a quadratic function, the critical numbers are the roots, sometimes called the zeros. For example, \(f (x) = x^{2} − x − 6 = (x + 2) (x − 3)\) has roots \(−2\) and \(3\). These values bound the regions where the function is positive (above the \(x\)-axis) or negative (below the \(x\)-axis).
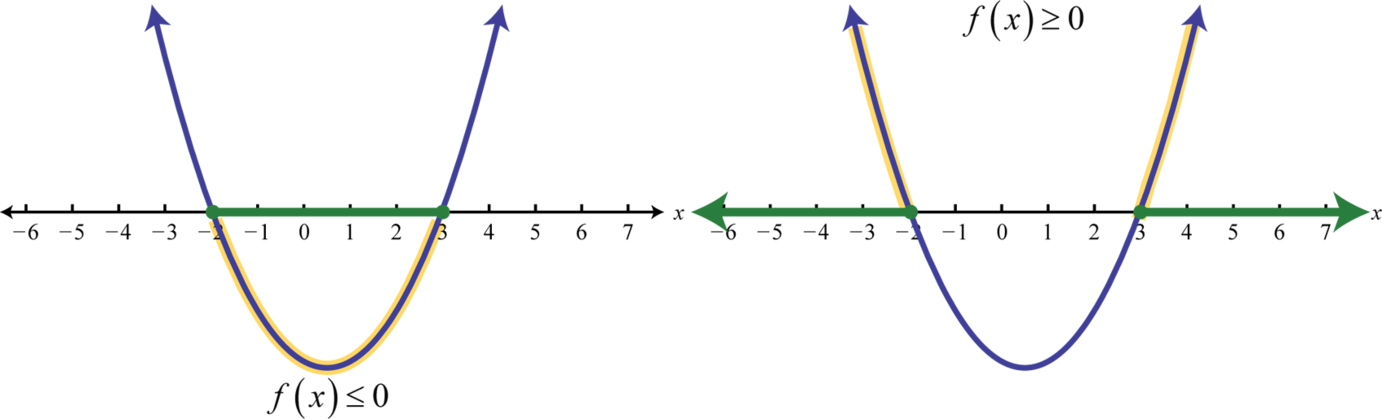
Therefore \(x^{2} − x − 6 ≤ 0\) has solutions where \(−2 ≤ x ≤ 3\), using interval notation \([−2, 3]\). Furthermore, \(x^{2} − x − 6 ≥ 0\) has solutions where \(x ≤ −2\) or \(x ≥ 3\), using interval notation \((−∞, −2] ∪ [−3, ∞)\).
Example \(\PageIndex{2}\):
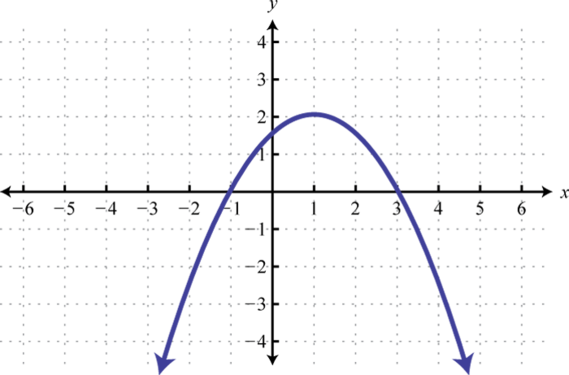
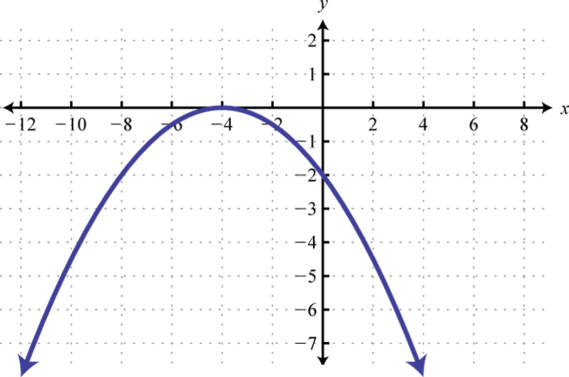
Given the graph of \(f\) determine the solutions to \(f(x)>0\):
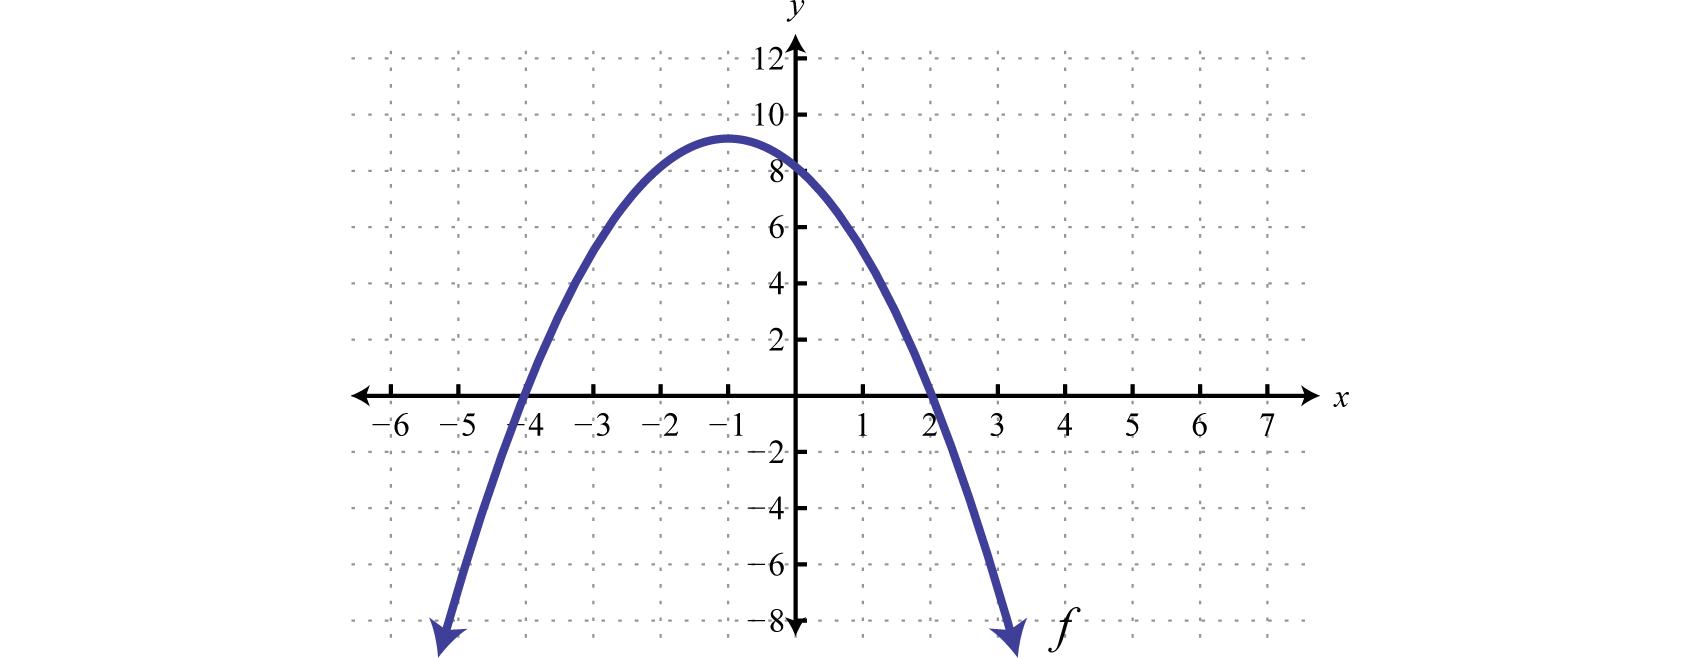
Because of the strict inequality, the solution set is shaded with an open dot on each of the boundaries. This indicates that these critical numbers are not actually included in the solution set. This solution set can be expressed two ways,
\(\begin{aligned}\{x |-4<&x<2\} &\color{Cerulean} { Set\: Notation } \\ (-4,&2) &\color{Cerulean} { Interval\: Notation }\end{aligned}\)
In this textbook, we will continue to present answers in interval notation.
Answer:
\((-4,2)\)
Exercise \(\PageIndex{1}\)
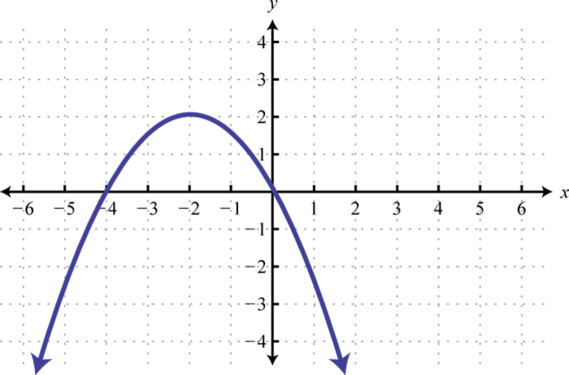
Given the graph of \(f\) determine the solutions to \(f (x) < 0\):
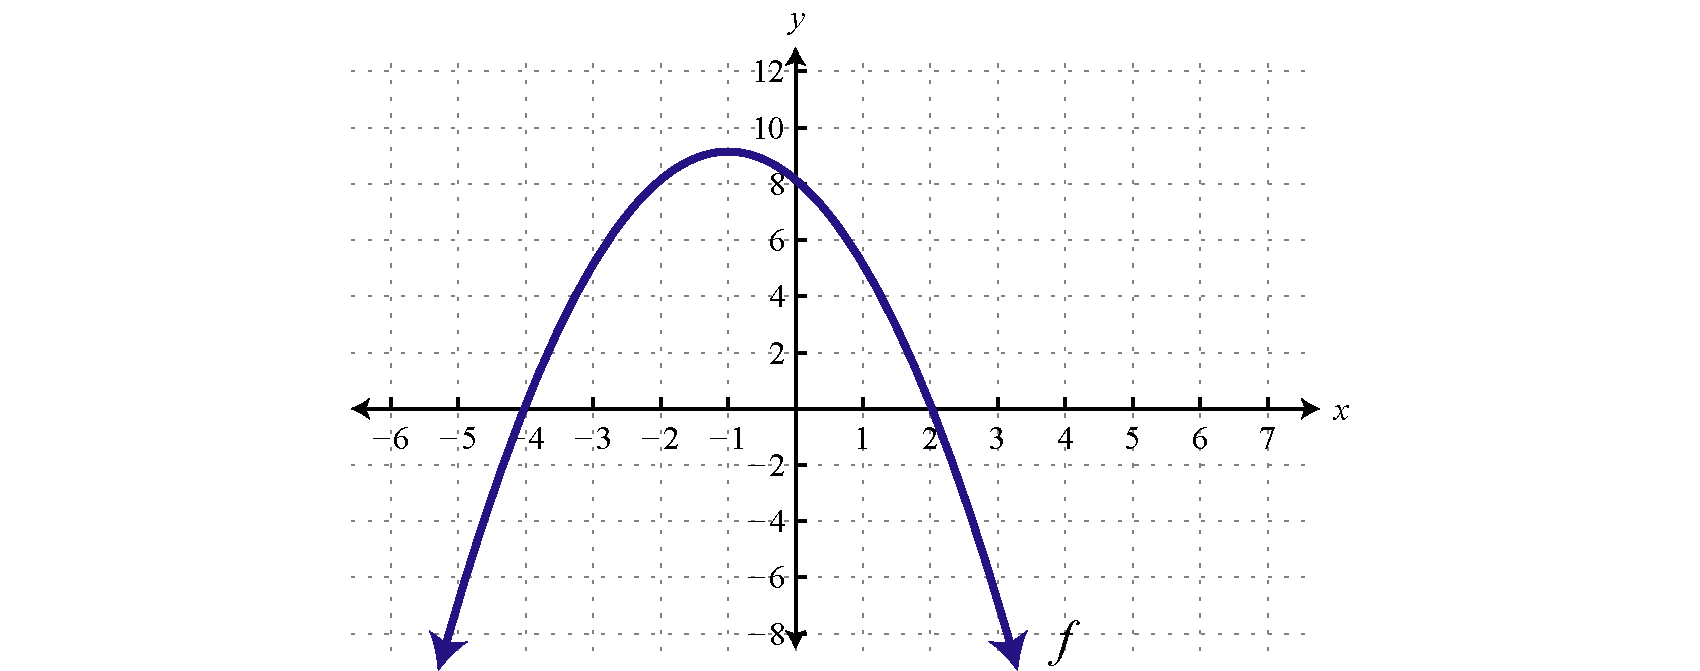
- Answer
-
\((-\infty,-4) \cup(2, \infty)\)
www.youtube.com/v/kkBaoM8buBo
Solving Quadratic Inequalities
Next we outline a technique used to solve quadratic inequalities without graphing the parabola. To do this we make use of a sign chart17 which models a function using a number line that represents the \(x\)-axis and signs \((+\) or \(−)\) to indicate where the function is positive or negative. For example,
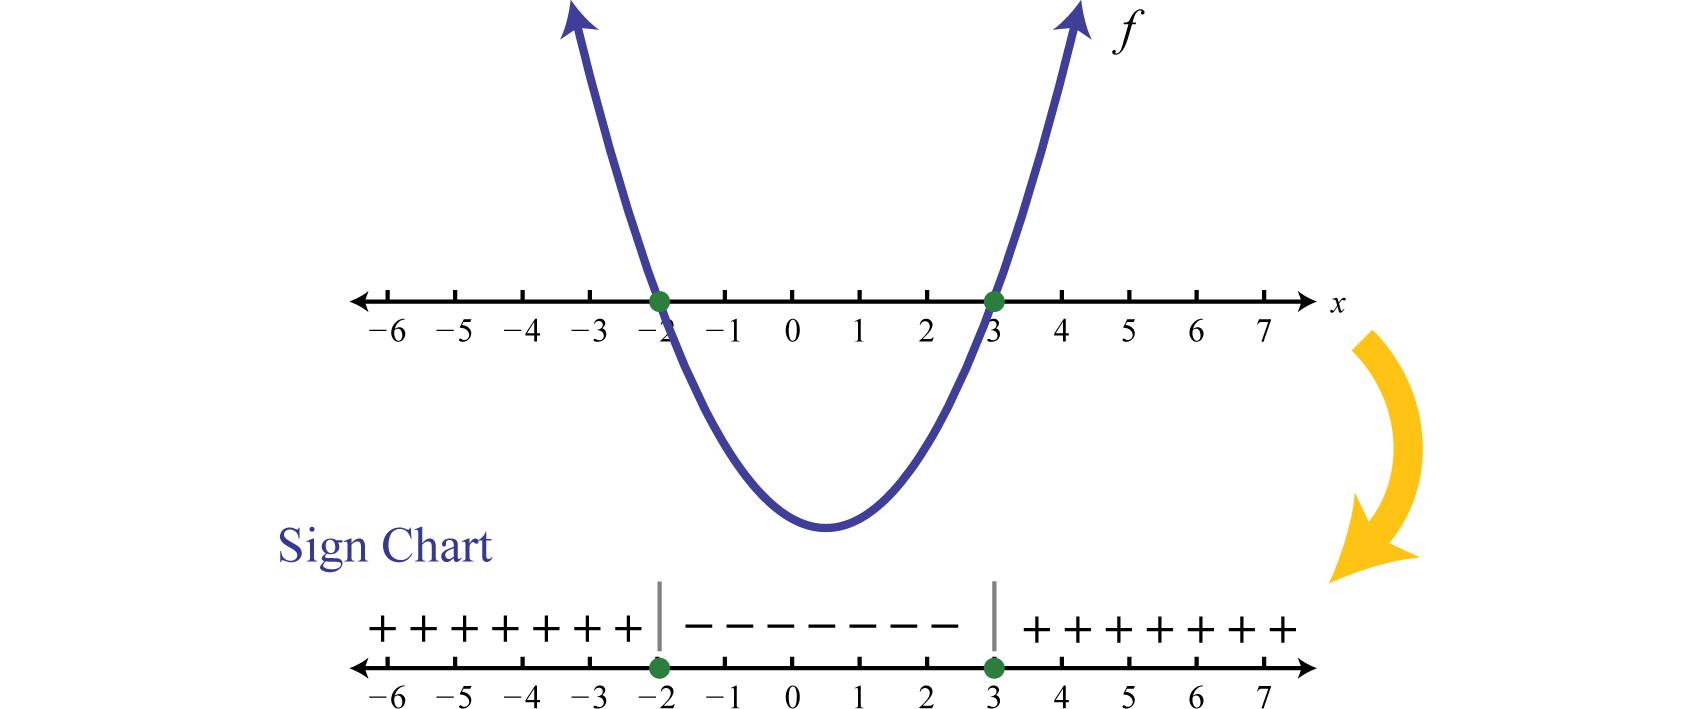
The plus signs indicate that the function is positive on the region. The negative signs indicate that the function is negative on the region. The boundaries are the critical numbers, \(−2\) and \(3\) in this case. Sign charts are useful when a detailed picture of the graph is not needed and are used extensively in higher level mathematics. The steps for solving a quadratic inequality with one variable are outlined in the following example.
Example \(\PageIndex{3}\):
Solve: \(-x^{2}+6 x+7 \geq 0\).
Solution
It is important to note that this quadratic inequality is in standard form, with zero on one side of the inequality.
Step 1: Determine the critical numbers. For a quadratic inequality in standard form, the critical numbers are the roots. Therefore, set the function equal to zero and solve.
\(-x^{2}+6 x+7=0 \)
\(-\left(x^{2}-6 x-7\right)=0 \)
\(-(x+1)(x-7)=0 \)
\(\begin{aligned}x+1&=0 \:\:\:\:\text { or } &x-7=0 \\ x&=-1 &x=7\end{aligned}\)
The critical numbers are \(-1\) and \(7\).
Step 2: Create a sign chart. Since the critical numbers bound the regions where the function is positive or negative, we need only test a single value in each region. In this case the critical numbers partition the number line into three regions and we choose test values \(x = −3, x = 0\), and \(x = 10\).

Test values may vary. In fact, we need only determine the sign \((+\) or \(−)\) of the result when evaluating \(f (x) = −x^{2} + 6x + 7 = − (x + 1) (x − 7)\). Here we evaluate using the factored form.
\(\begin{aligned} f(\color{OliveGreen}{-3}\color{black}{)}&=-(\color{OliveGreen}{-3}\color{black}{+}1)(\color{OliveGreen}{-3}\color{black}{-}7) =-(-2)(-10)&=-\color{Cerulean} {Negative} \\ f(\color{OliveGreen}{0}\color{black}{)}&=-(\color{OliveGreen}{0}\color{black}{+}1)(\color{OliveGreen}{0}\color{black}{-}7) =-(1)(-7)&=+\color{Cerulean} { Positive } \\ f(\color{OliveGreen}{10}\color{black}{)}&=-(\color{OliveGreen}{10}\color{black}{+}1)(\color{OliveGreen}{10}\color{black}{-}7) =-(11)(3)&=-\color{Cerulean} {Negative} \end{aligned}\)
Since the result of evaluating for \(−3\) was negative, we place negative signs above the first region. The result of evaluating for \(0\) was positive, so we place positive signs above the middle region. Finally, the result of evaluating for \(10\) was negative, so we place negative signs above the last region, and the sign chart is complete.

Step 3: Use the sign chart to answer the question. In this case, we are asked to determine where \(f (x) ≥ 0\), or where the function is positive or zero. From the sign chart we see this occurs when \(x\)-values are inclusively between \(−1\) and \(7\).

Using interval notation, the shaded region is expressed as \([−1, 7]\). The graph is not required; however, for the sake of completeness it is provided below.
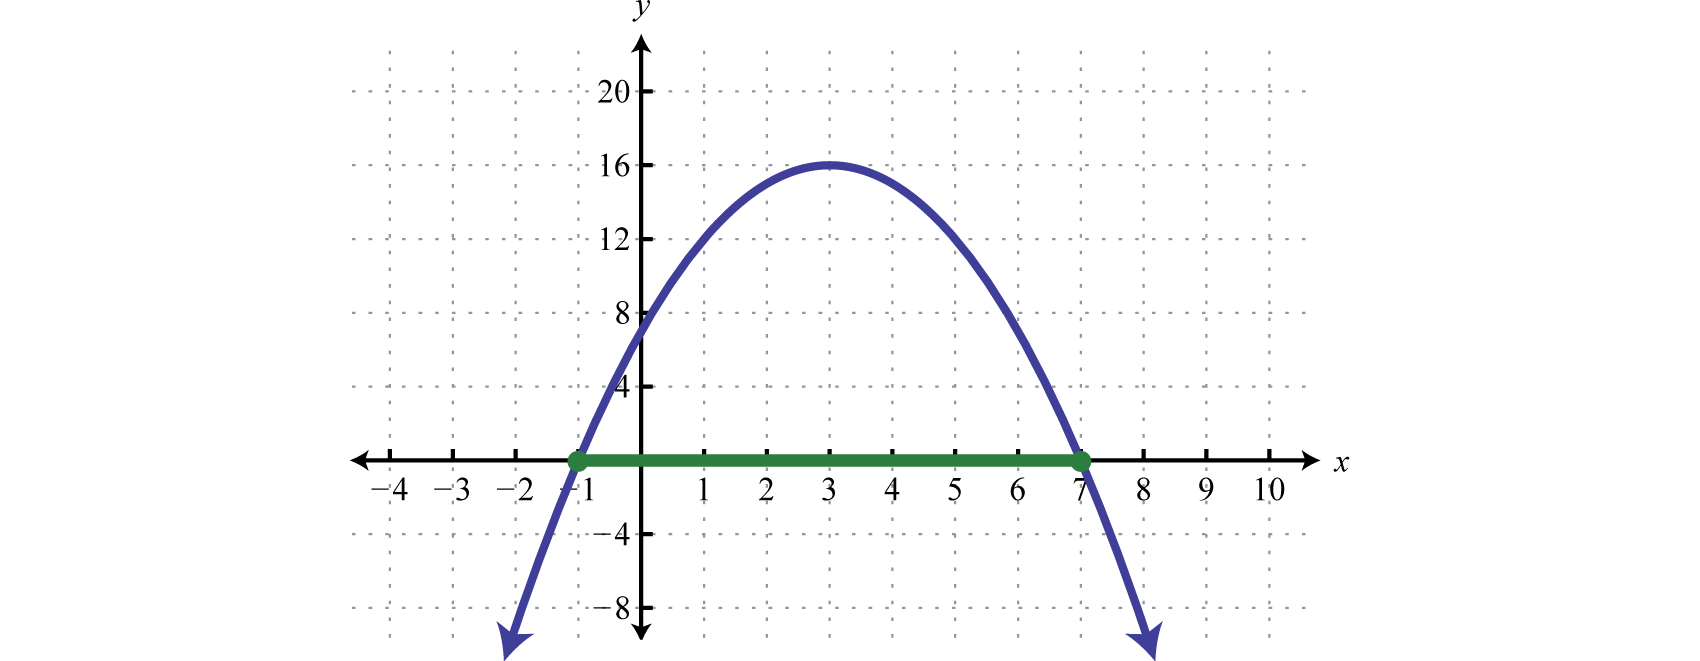
Indeed the function is greater than or equal to zero, above or on the \(x\)-axis, for \(x\)-values in the specified interval.
Answer:
\([-1,7]\)
Example \(\PageIndex{4}\):
Solve: \(2 x^{2}-7 x+3>0\).
Solution
Begin by finding the critical numbers, in this case, the roots of \(f(x)=2 x^{2}-7 x+3\).
\(\begin{aligned}2 x^{2}-7 x+3&=0 \\ (2 x-1)(x-3)&=0\end{aligned}\)
\(\begin{aligned} 2 x-1 &=0 \:\:\:\:\:\text { or }& x-3=0 \\ 2 x &=1 \quad &x=3 \\ x &=\frac{1}{2} \end{aligned}\)
The critical numbers are \(\frac{1}{2}\) and \(3\). Because of the strict inequality > we will use open dots.

Next choose a test value in each region and determine the sign after evaluating \(f (x) = 2x^{2} − 7x + 3 = (2x − 1) (x − 3)\). Here we choose test values \(−1, 2\), and \(5\).
\(\begin{aligned} f(\color{OliveGreen}{-1}\color{black}{)} &=[2(\color{OliveGreen}{-1}\color{black}{)}-1](\color{OliveGreen}{-1}\color{black}{-}3)&=(-)(-)=+\\ f(\color{OliveGreen}{2}\color{black}{)} &=[2(\color{OliveGreen}{2}\color{black}{)}-1](\color{OliveGreen}{2}\color{black}{-}3)&=(+)(-)=-\\ f(\color{OliveGreen}{5}\color{black}{)} &=[2(\color{OliveGreen}{5}\color{black}{)}-1](\color{OliveGreen}{5}\color{black}{-}3)&=(+)(+)=+\end{aligned}\)
And we can complete the sign chart.

The question asks us to find the \(x\)-values that produce positive results (greater than zero). Therefore, shade in the regions with a \(+\) over them. This is the solution set.

Answer:
\(\left(-\infty, \frac{1}{2}\right) \cup(3, \infty)\)
Sometimes the quadratic function does not factor. In this case we can make use of the quadratic formula.
Example \(\PageIndex{5}\):
Solve: \(x^{2}-2 x-11 \leq 0\)
Solution
Find the critical numbers.
\(x^{2}-2 x-11=0\)
Identify \(a, b\), and \(c\) for use in the quadratic formula. Here \(a = 1, b = −2\), and \(c = −11\). Substitute the appropriate values into the quadratic formula and then simplify.
\(\begin{aligned} x &=\frac{-b \pm \sqrt{b^{2}-4 a c}}{2 a} \\ &=\frac{-(\color{OliveGreen}{-2}\color{black}{)} \pm \sqrt{(\color{OliveGreen}{-2}\color{black}{)}^{2}-4(\color{OliveGreen}{1}\color{black}{)}(\color{OliveGreen}{-11}\color{black}{)}}}{2(\color{OliveGreen}{1}\color{black}{)}} \\ &=\frac{2 \pm \sqrt{48}}{2} \\ &=\frac{2 \pm 4 \sqrt{3}}{2} \\ &=1 \pm 2 \sqrt{3} \end{aligned}\)
Therefore the critical numbers are \(1-2 \sqrt{3} \approx-2.5\) and \(1+2 \sqrt{3} \approx 4.5\). Use a closed dot on the number to indicate that these values will be included in the solution set.

Here we will use test values \(−5, 0\), and \(7\).
\(\begin{aligned} f(\color{OliveGreen}{-5}\color{black}{)}&=(\color{OliveGreen}{-5}\color{black}{)}^{2}-2(\color{OliveGreen}{-5}\color{black}{)}-11 =25+10-11&=+\\ f(\color{OliveGreen}{0}\color{black}{)}&=(\color{OliveGreen}{0}\color{black}{)}^{2}-2(\color{OliveGreen}{0}\color{black}{)}-11 =0+0-11&=-\\ f(\color{OliveGreen}{7}\color{black}{)}&=(\color{OliveGreen}{7}\color{black}{)}^{2}-2(\color{OliveGreen}{7}\color{black}{)}-11 =49-14-11&=+\end{aligned}\)
After completing the sign chart shade in the values where the function is negative as indicated by the question \((f (x) ≤ 0)\).

Answer:
\([1-2 \sqrt{3}, 1+2 \sqrt{3}]\)
Exercise \(\PageIndex{2}\)
Solve: \(9-x^{2}>0\).
- Answer
-
\((-3,3)\)
www.youtube.com/v/7gMJ8gUvASw
It may be the case that there are no critical numbers.
Example \(\PageIndex{6}\):
Solve: \(x^{2}-2 x+3>0\).
Solution
To find the critical numbers solve,
\(x^{2}-2 x+3=0\)
Substitute \(a = 1, b = −2\), and \(c = 3\) into the quadratic formula and then simplify.
\(\begin{aligned} x &=\frac{-b \pm \sqrt{b^{2}-4 a c}}{2 a} \\ &=\frac{-(\color{OliveGreen}{-2}\color{black}{)} \pm \sqrt{(\color{OliveGreen}{-2}\color{black}{)}^{2}-4(\color{OliveGreen}{1}\color{black}{)}(\color{OliveGreen}{3}\color{black}{)}}}{2(\color{OliveGreen}{1}\color{black}{)}} \\ &=\frac{2 \pm \sqrt{-8}}{2} \\ &=\frac{2 \pm 2 i \sqrt{2}}{2} \\ &=1+i \sqrt{2} \end{aligned}\)
Because the solutions are not real, we conclude there are no real roots; hence there are no critical numbers. When this is the case, the graph has no \(x\)-intercepts and is completely above or below the \(x\)-axis. We can test any value to create a sign chart. Here we choose \(x = 0\).
\(f(0)=(0)^{2}-2(0)+3=+\)
Because the test value produced a positive result the sign chart looks as follows:

We are looking for the values where \(f (x) > 0\); the sign chart implies that any real number for \(x\) will satisfy this condition.

Answer:
\((-\infty, \infty)\)
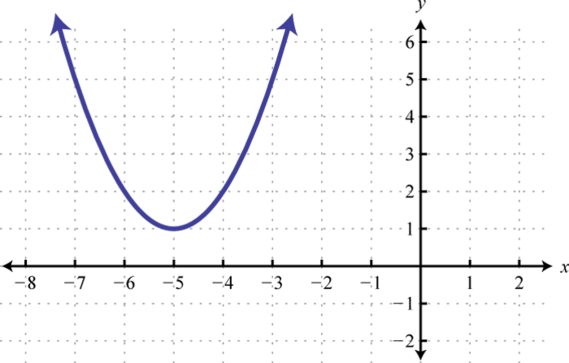
The function in the previous example is graphed below.
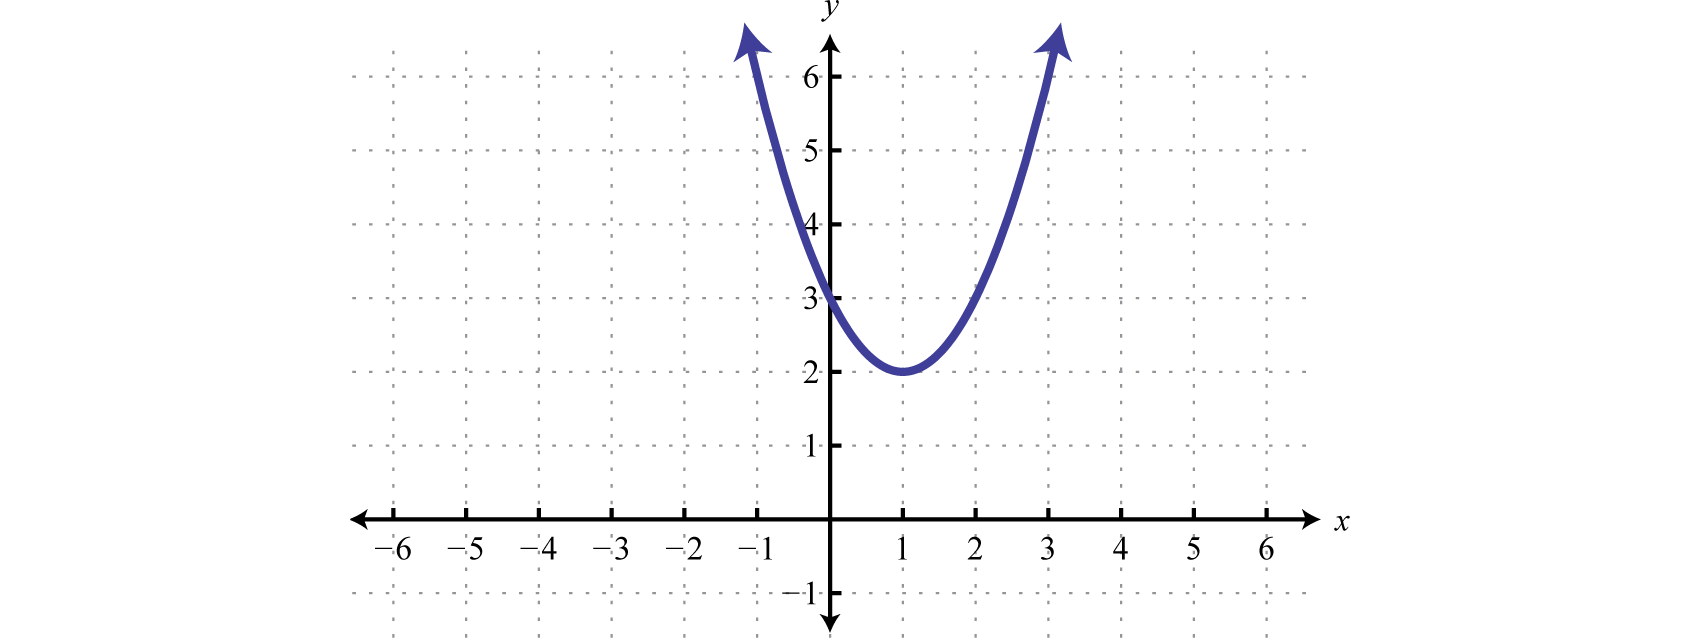
We can see that it has no \(x\)-intercepts and is always above the \(x\)-axis (positive). If the question was to solve \(x^{2} − 2x + 3 < 0\), then the answer would have been no solution. The function is never negative.
Exercise \(\PageIndex{3}\)
Solve: \(9 x^{2}-12 x+4 \leq 0\)
- Answer
-
One solution, \(\frac{2}{3}\).
www.youtube.com/v/E7VcOYVV_Ds
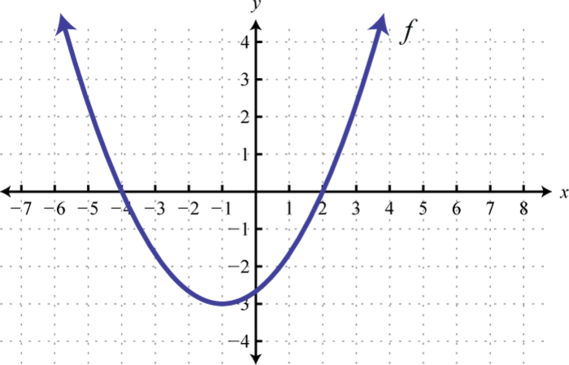
Example \(\PageIndex{7}\):
Find the domain: \(f(x)=\sqrt{x^{2}-4}\).
Solution
Recall that the argument of a square root function must be nonnegative. Therefore, the domain consists of all real numbers for \(x\) such that \(x^{2} − 4\) is greater than or equal to zero.
\(x^{2}-4 \geq 0\)
It should be clear that \(x^{2} − 4 = 0\) has two solutions \(x = ±2\); these are the critical values. Choose test values in each interval and evaluate \(f (x) = x^{2} − 4\).
\(\begin{aligned} f(-3) &=(-3)^{2}-4=9-4=+\\ f(0) &=(0)^{2}-4=0-4=-\\ f(3) &=(3)^{2}-4=9-4=+\end{aligned}\)
Shade in the \(x\)-values that produce positive results.

Answer:
Domain: \((-\infty,-2] \cup[2, \infty)\)
Key Takeaways
- Quadratic inequalities can have infinitely many solutions, one solution or no solution.
- We can solve quadratic inequalities graphically by first rewriting the inequality in standard form, with zero on one side. Graph the quadratic function and determine where it is above or below the \(x\)-axis. If the inequality involves “less than,” then determine the \(x\)-values where the function is below the \(x\)-axis. If the inequality involves “greater than,” then determine the \(x\)-values where the function is above the \(x\)-axis.
- We can streamline the process of solving quadratic inequalities by making use of a sign chart. A sign chart gives us a visual reference that indicates where the function is above the \(x\)-axis using positive signs or below the \(x\)-axis using negative signs. Shade in the appropriate x-values depending on the original inequality.
- To make a sign chart, use the function and test values in each region bounded by the roots. We are only concerned if the function is positive or negative and thus a complete calculation is not necessary.
Exercise \(\PageIndex{4}\)
Determine whether or not the given value is a solution.
- \(x^{2}-x+1<0 ; x=-1\)
- \(x^{2}+x-1>0 ; x=-2\)
- \(4 x^{2}-12 x+9 \leq 0 ; x=\frac{3}{2}\)
- \(5 x^{2}-8 x-4<0 ; x=-\frac{2}{5}\)
- \(3 x^{2}-x-2 \geq 0 ; x=0\)
- \(4 x^{2}-x+3 \leq 0 ; x=-1\)
- \(2-4 x-x^{2}<0 ; x=\frac{1}{2}\)
- \(5-2 x-x^{2}>0 ; x=0\)
- \(-x^{2}-x-9<0 ; x=-3\)
- \(-x^{2}+x-6 \geq 0 ; x=6\)
- Answer
-
1. No
3. Yes
5. No
7. Yes
9. Yes
Exercise \(\PageIndex{5}\)
Given the graph of \(f\) determine the solution set.
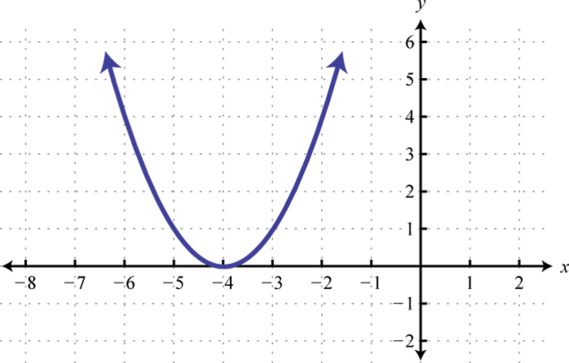
1. \(f(x) \leq 0\);
2. \(f(x) \geq 0\);
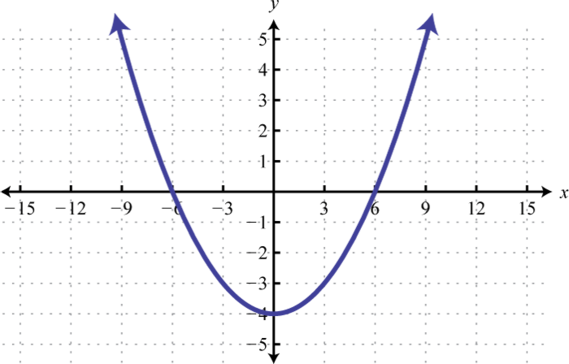
3. \(f(x) \geq 0\);
4. \(f(x) \leq 0\);
5. \(f(x)>0\);
6. \(f(x)<0\);
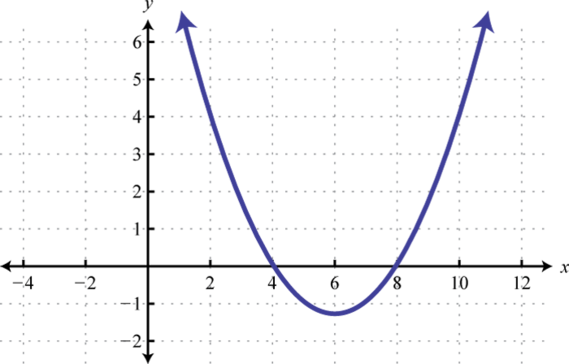
7. \(f(x)>0\);
8. \(f(x)<0\);
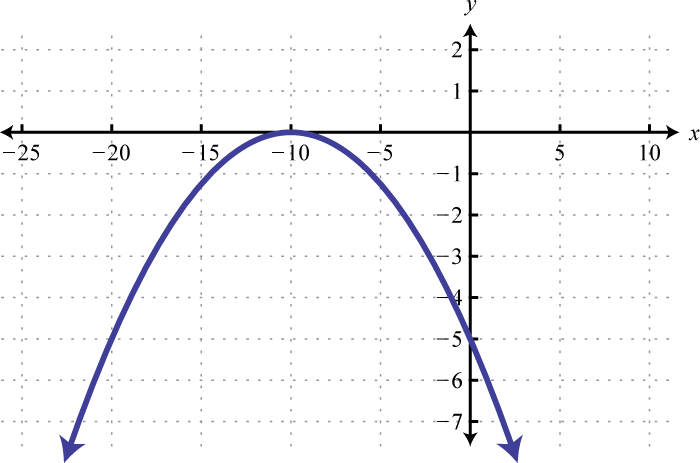
9. \(f(x) \geq 0\);
10. \(f(x)<0\);
- Answer
-
1. \([-4,2]\)
3. \([-1,3]\)
5. \((-\infty, \infty)\)
7. \((-\infty, 4) \cup(8, \infty)\)
9. \(\{-10\}\)
Exercise \(\PageIndex{6}\)
Use the transformations to graph the following and then determine the solution set.
- \(x^{2}-1>0\)
- \(x^{2}+2>0\)
- \((x-1)^{2}>0\)
- \((x+2)^{2} \leq 0\)
- \((x+2)^{2}-1 \leq 0\)
- \((x+3)^{2}-4>0\)
- \(-x^{2}+4 \geq 0\)
- \(-(x+2)^{2}>0\)
- \(-(x+3)^{2}+1<0\)
- \(-(x-4)^{2}+9>0\)
- Answer
-
1. \((-\infty,-1) \cup(1, \infty)\)
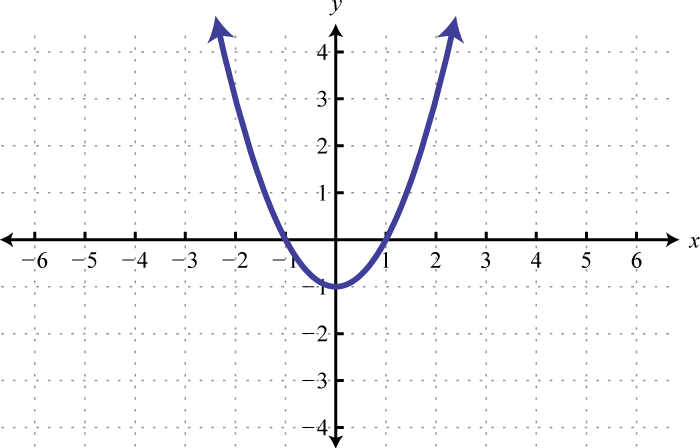
Figure \(\PageIndex{30}\) 3. \((-\infty, 1) \cup(1, \infty)\)
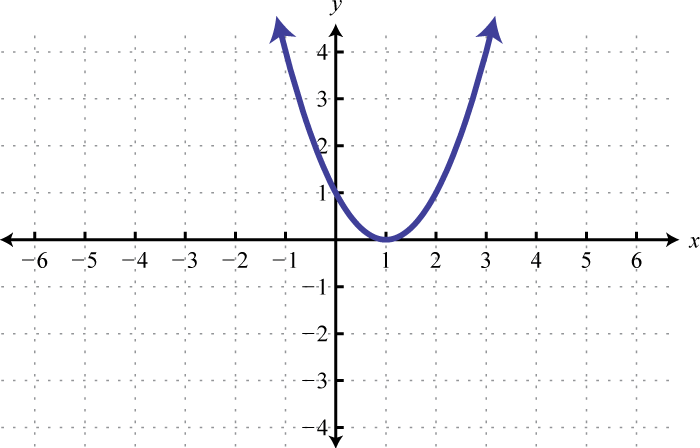
Figure \(\PageIndex{31}\) 5. \([-3,-1]\)
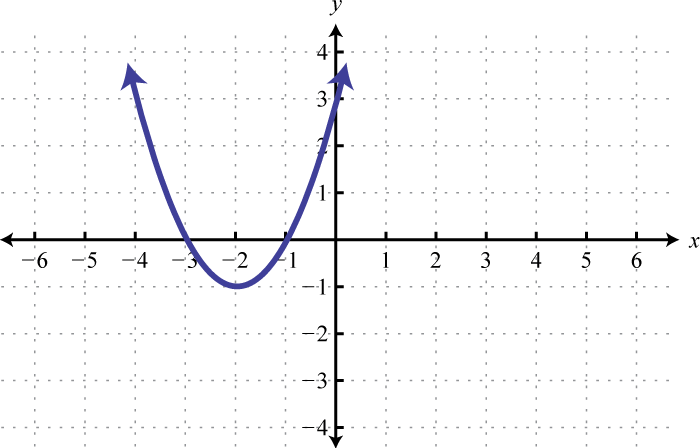
Figure \(\PageIndex{32}\) 7. \([-2,2]\)
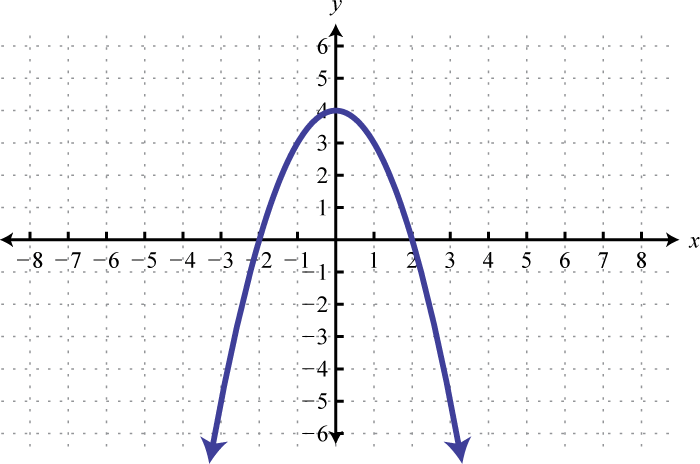
Figure \(\PageIndex{33}\) 9. \((-\infty,-4) \cup(-2, \infty)\)

Figure \(\PageIndex{34}\)
Exercise \(\PageIndex{7}\)
Use a sign chart to solve and graph the solution set. Present answers using interval notation.
- \(x^{2}-x-12>0\)
- \(x^{2}-10 x+16>0\)
- \(x^{2}+2 x-24<0\)
- \(x^{2}+15 x+54<0\)
- \(x^{2}-23 x-24 \leq 0\)
- \(x^{2}-12 x+20 \leq 0\)
- \(2 x^{2}-11 x-6 \geq 0\)
- \(3 x^{2}+17 x-6 \geq 0\)
- \(8 x^{2}-18 x-5<0\)
- \(10 x^{2}+17 x+6>0\)
- \(9 x^{2}+30 x+25 \leq 0\)
- \(16 x^{2}-40 x+25 \leq 0\)
- \(4 x^{2}-4 x+1>0\)
- \(9 x^{2}+12 x+4>0\)
- \(-x^{2}-x+30 \geq 0\)
- \(-x^{2}-6 x+27 \leq 0\)
- \(x^{2}-64<0\)
- \(x^{2}-81 \geq 0\)
- \(4 x^{2}-9 \geq 0\)
- \(16 x^{2}-25<0\)
- \(25-4 x^{2} \geq 0\)
- \(1-49 x^{2}<0\)
- \(x^{2}-8>0\)
- \(x^{2}-75 \leq 0\)
- \(2 x^{2}+1>0\)
- \(4 x^{2}+3<0\)
- \(x-x^{2}>0\)
- \(3 x-x^{2} \leq 0\)
- \(x^{2}-x+1<0\)
- \(x^{2}+x-1>0\)
- \(4 x^{2}-12 x+9 \leq 0\)
- \(5 x^{2}-8 x-4<0\)
- \(3 x^{2}-x-2 \geq 0\)
- \(4 x^{2}-x+3 \leq 0\)
- \(2-4 x-x^{2}<0\)
- \(5-2 x-x^{2}>0\)
- \(-x^{2}-x-9<0\)
- \(-x^{2}+x-6 \geq 0\)
- \(-2 x^{2}+4 x-1 \geq 0\)
- \(-3 x^{2}-x+1 \leq 0\)
- Answer
-
1. \((-\infty,-3) \cup(4, \infty)\)
3. \((-6,4)\)
5. \([-1,24]\)
7. \(\left(-\infty,-\frac{1}{2}\right] \cup[6, \infty)\)
9. \(\left(-\frac{1}{4}, \frac{5}{2}\right)\)
11. \(-\frac{5}{3}\)
13. \(\left(-\infty, \frac{1}{2}\right) \cup\left(\frac{1}{2}, \infty\right)\)
15. \([-6,5]\)
17. \((-8,8)\)
19. \(\left(-\infty,-\frac{3}{2}\right] \cup\left[\frac{3}{2}, \infty\right)\)
21. \(\left[-\frac{5}{2}, \frac{5}{2}\right]\)
23. \((-\infty,-2 \sqrt{2}) \cup(2 \sqrt{2}, \infty)\)
25. \((-\infty, \infty)\)
27. \((0,1)\)
29. \(\emptyset\)
31. \(\frac{3}{2}\)
33. \(\left(-\infty,-\frac{2}{3}\right] \cup[1, \infty)\)
35. \((-\infty,-2-\sqrt{6}) \cup(-2+\sqrt{6}, \infty)\)
37. \((-\infty, \infty)\)
39. \(\left[\frac{2-\sqrt{2}}{2}, \frac{2+\sqrt{2}}{2}\right]\)
Exercise \(\PageIndex{8}\)
Find the domain of the function.
- \(f(x)=\sqrt{x^{2}-25}\)
- \(f(x)=\sqrt{x^{2}+3 x}\)
- \(g(x)=\sqrt{3 x^{2}-x-2}\)
- \(g(x)=\sqrt{12 x^{2}-9 x-3}\)
- \(h(x)=\sqrt{16-x^{2}}\)
- \(h(x)=\sqrt{3-2 x-x^{2}}\)
- \(f(x)=\sqrt{x^{2}+10}\)
- \(f(x)=\sqrt{9+x^{2}}\)
- A robotics manufacturing company has determined that its weekly profit in thousands of dollars is modeled by \(P (n) = −n^{2} + 30n − 200\) where \(n\) represents the number of units it produces and sells. How many units must the company produce and sell to maintain profitability. (Hint: Profitability occurs when profit is greater than zero.)
- The height in feet of a projectile shot straight into the air is given by \(h (t) = −16t^{2} + 400t\) where \(t\) represents the time in seconds after it is fired. In what time intervals is the projectile under \(1,000\) feet? Round to the nearest tenth of a second.
- Answer
-
1. \((-\infty,-5] \cup[5, \infty)\)
3. \(\left(-\infty,-\frac{2}{3}\right] \cup[1, \infty)\)
5. \([-4,4]\)
7. \((-\infty, \infty)\)
9. The company must produce and sell more than \(10\) units and fewer than \(20\) units each week.
Exercise \(\PageIndex{9}\)
- Does the sign chart for any given quadratic function always alternate? Explain and illustrate your answer with some examples.
- Research and discuss other methods for solving a quadratic inequality.
- Explain the difference between a quadratic equation and a quadratic inequality. How can we identify and solve each? What is the geometric interpretation of each?
- Answer
-
1. Answer may vary
3. Answer may vary
Footnotes
15A mathematical statement that relates a quadratic expression as either less than or greater than another.
16The values in the domain of a function that separate regions that produce positive or negative results.
17A model of a function using a number line and signs \((+\) or \(−)\) to indicate regions in the domain where the function is positive or negative.