
4.3E: Fitting Linear Models to Data (Exercises)


- Last updated
- Dec 26, 2024
- Save as PDF

( \newcommand{\kernel}{\mathrm{null}\,}\)
Draw a scatter plot for the data in Table 2. Then determine whether the data appears to be linearly related.
| 0 | -105 |
| 2 | -50 |
| 4 | 1 |
| 6 | 55 |
| 8 | 105 |
| 10 | 160 |
35.
Draw a scatter plot for the data in Table 3. If we wanted to know when the population would reach 15,000, would the answer involve interpolation or extrapolation?
| Year | Population |
|---|---|
| 1990 | 5,600 |
| 1995 | 5,950 |
| 2000 | 6,300 |
| 2005 | 6,600 |
| 2010 | 6,900 |
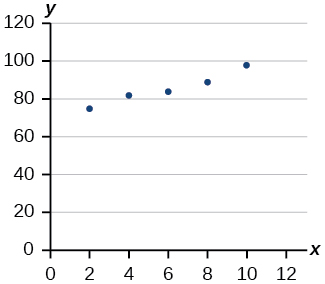
Eight students were asked to estimate their score on a 10-point quiz. Their estimated and actual scores are given in Table 4. Plot the points, then sketch a line that fits the data.
| Predicted | Actual |
|---|---|
| 6 | 6 |
| 7 | 7 |
| 7 | 8 |
| 8 | 8 |
| 7 | 9 |
| 9 | 10 |
| 10 | 10 |
| 10 | 9 |
37. Draw a best-fit line for the plotted data.
For the following exercises, consider the data in Table 5, which shows the percent of unemployed in a city of people 25 years or older who are college graduates is given below, by year.
| Year | 2000 | 2002 | 2005 | 2007 | 2010 |
| Percent Graduates | 6.5 | 7.0 | 7.4 | 8.2 | 9.0 |
Determine whether the trend appears to be linear. If so, and assuming the trend continues, find a linear regression model to predict the percent of unemployed in a given year to three decimal places.
39.In what year will the percentage exceed 12%?
40.Based on the set of data given in Table 6, calculate the regression line using a calculator or other technology tool, and determine the correlation coefficient to three decimal places.
| xx | 17 | 20 | 23 | 26 | 29 |
| yy | 15 | 25 | 31 | 37 | 40 |
Based on the set of data given in Table 7, calculate the regression line using a calculator or other technology tool, and determine the correlation coefficient to three decimal places.
| xx | 10 | 12 | 15 | 18 | 20 |
| yy | 36 | 34 | 30 | 28 | 22 |
For the following exercises, consider this scenario: The population of a city increased steadily over a ten-year span. The following ordered pairs show the population and the year over the ten-year span (population, year) for specific recorded years:
(3,600,2000);(4,000,2001);(4,700,2003);(6,000,2006)
42. Use linear regression to determine a function y, where the year depends on the population, to three decimal places of accuracy.
43. Predict when the population will hit 12,000.
44. What is the correlation coefficient for this model to three decimal places of accuracy?
45. According to the model, what is the population in 2014?