
7.8: Graphing Linear Inequalities in Two Variables
- Page ID
- 60039

\( \newcommand{\vecs}[1]{\overset { \scriptstyle \rightharpoonup} {\mathbf{#1}} } \)
\( \newcommand{\vecd}[1]{\overset{-\!-\!\rightharpoonup}{\vphantom{a}\smash {#1}}} \)
\( \newcommand{\dsum}{\displaystyle\sum\limits} \)
\( \newcommand{\dint}{\displaystyle\int\limits} \)
\( \newcommand{\dlim}{\displaystyle\lim\limits} \)
\( \newcommand{\id}{\mathrm{id}}\) \( \newcommand{\Span}{\mathrm{span}}\)
( \newcommand{\kernel}{\mathrm{null}\,}\) \( \newcommand{\range}{\mathrm{range}\,}\)
\( \newcommand{\RealPart}{\mathrm{Re}}\) \( \newcommand{\ImaginaryPart}{\mathrm{Im}}\)
\( \newcommand{\Argument}{\mathrm{Arg}}\) \( \newcommand{\norm}[1]{\| #1 \|}\)
\( \newcommand{\inner}[2]{\langle #1, #2 \rangle}\)
\( \newcommand{\Span}{\mathrm{span}}\)
\( \newcommand{\id}{\mathrm{id}}\)
\( \newcommand{\Span}{\mathrm{span}}\)
\( \newcommand{\kernel}{\mathrm{null}\,}\)
\( \newcommand{\range}{\mathrm{range}\,}\)
\( \newcommand{\RealPart}{\mathrm{Re}}\)
\( \newcommand{\ImaginaryPart}{\mathrm{Im}}\)
\( \newcommand{\Argument}{\mathrm{Arg}}\)
\( \newcommand{\norm}[1]{\| #1 \|}\)
\( \newcommand{\inner}[2]{\langle #1, #2 \rangle}\)
\( \newcommand{\Span}{\mathrm{span}}\) \( \newcommand{\AA}{\unicode[.8,0]{x212B}}\)
\( \newcommand{\vectorA}[1]{\vec{#1}} % arrow\)
\( \newcommand{\vectorAt}[1]{\vec{\text{#1}}} % arrow\)
\( \newcommand{\vectorB}[1]{\overset { \scriptstyle \rightharpoonup} {\mathbf{#1}} } \)
\( \newcommand{\vectorC}[1]{\textbf{#1}} \)
\( \newcommand{\vectorD}[1]{\overrightarrow{#1}} \)
\( \newcommand{\vectorDt}[1]{\overrightarrow{\text{#1}}} \)
\( \newcommand{\vectE}[1]{\overset{-\!-\!\rightharpoonup}{\vphantom{a}\smash{\mathbf {#1}}}} \)
\( \newcommand{\vecs}[1]{\overset { \scriptstyle \rightharpoonup} {\mathbf{#1}} } \)
\(\newcommand{\longvect}{\overrightarrow}\)
\( \newcommand{\vecd}[1]{\overset{-\!-\!\rightharpoonup}{\vphantom{a}\smash {#1}}} \)
\(\newcommand{\avec}{\mathbf a}\) \(\newcommand{\bvec}{\mathbf b}\) \(\newcommand{\cvec}{\mathbf c}\) \(\newcommand{\dvec}{\mathbf d}\) \(\newcommand{\dtil}{\widetilde{\mathbf d}}\) \(\newcommand{\evec}{\mathbf e}\) \(\newcommand{\fvec}{\mathbf f}\) \(\newcommand{\nvec}{\mathbf n}\) \(\newcommand{\pvec}{\mathbf p}\) \(\newcommand{\qvec}{\mathbf q}\) \(\newcommand{\svec}{\mathbf s}\) \(\newcommand{\tvec}{\mathbf t}\) \(\newcommand{\uvec}{\mathbf u}\) \(\newcommand{\vvec}{\mathbf v}\) \(\newcommand{\wvec}{\mathbf w}\) \(\newcommand{\xvec}{\mathbf x}\) \(\newcommand{\yvec}{\mathbf y}\) \(\newcommand{\zvec}{\mathbf z}\) \(\newcommand{\rvec}{\mathbf r}\) \(\newcommand{\mvec}{\mathbf m}\) \(\newcommand{\zerovec}{\mathbf 0}\) \(\newcommand{\onevec}{\mathbf 1}\) \(\newcommand{\real}{\mathbb R}\) \(\newcommand{\twovec}[2]{\left[\begin{array}{r}#1 \\ #2 \end{array}\right]}\) \(\newcommand{\ctwovec}[2]{\left[\begin{array}{c}#1 \\ #2 \end{array}\right]}\) \(\newcommand{\threevec}[3]{\left[\begin{array}{r}#1 \\ #2 \\ #3 \end{array}\right]}\) \(\newcommand{\cthreevec}[3]{\left[\begin{array}{c}#1 \\ #2 \\ #3 \end{array}\right]}\) \(\newcommand{\fourvec}[4]{\left[\begin{array}{r}#1 \\ #2 \\ #3 \\ #4 \end{array}\right]}\) \(\newcommand{\cfourvec}[4]{\left[\begin{array}{c}#1 \\ #2 \\ #3 \\ #4 \end{array}\right]}\) \(\newcommand{\fivevec}[5]{\left[\begin{array}{r}#1 \\ #2 \\ #3 \\ #4 \\ #5 \\ \end{array}\right]}\) \(\newcommand{\cfivevec}[5]{\left[\begin{array}{c}#1 \\ #2 \\ #3 \\ #4 \\ #5 \\ \end{array}\right]}\) \(\newcommand{\mattwo}[4]{\left[\begin{array}{rr}#1 \amp #2 \\ #3 \amp #4 \\ \end{array}\right]}\) \(\newcommand{\laspan}[1]{\text{Span}\{#1\}}\) \(\newcommand{\bcal}{\cal B}\) \(\newcommand{\ccal}{\cal C}\) \(\newcommand{\scal}{\cal S}\) \(\newcommand{\wcal}{\cal W}\) \(\newcommand{\ecal}{\cal E}\) \(\newcommand{\coords}[2]{\left\{#1\right\}_{#2}}\) \(\newcommand{\gray}[1]{\color{gray}{#1}}\) \(\newcommand{\lgray}[1]{\color{lightgray}{#1}}\) \(\newcommand{\rank}{\operatorname{rank}}\) \(\newcommand{\row}{\text{Row}}\) \(\newcommand{\col}{\text{Col}}\) \(\renewcommand{\row}{\text{Row}}\) \(\newcommand{\nul}{\text{Nul}}\) \(\newcommand{\var}{\text{Var}}\) \(\newcommand{\corr}{\text{corr}}\) \(\newcommand{\len}[1]{\left|#1\right|}\) \(\newcommand{\bbar}{\overline{\bvec}}\) \(\newcommand{\bhat}{\widehat{\bvec}}\) \(\newcommand{\bperp}{\bvec^\perp}\) \(\newcommand{\xhat}{\widehat{\xvec}}\) \(\newcommand{\vhat}{\widehat{\vvec}}\) \(\newcommand{\uhat}{\widehat{\uvec}}\) \(\newcommand{\what}{\widehat{\wvec}}\) \(\newcommand{\Sighat}{\widehat{\Sigma}}\) \(\newcommand{\lt}{<}\) \(\newcommand{\gt}{>}\) \(\newcommand{\amp}{&}\) \(\definecolor{fillinmathshade}{gray}{0.9}\)Location of Solutions
In our study of linear equations in two variables, we observed that all the solutions to the equation, and only the solutions to the equation, were located on the graph of the equation. We now wish to determine the location of the solutions to linear inequalities in two variables. Linear inequalities in two variables are inequalities of the forms:
\(\begin{aligned}
ax + by \le c & ax + by \ge c\\
ax + by < c & ax + by > c
\end{aligned}\)
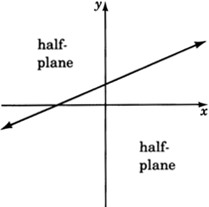
A straight line drawn through the plane divides the plan into two half-planes
The straight line is called the boundary line.
Solution to an Inequality in Two Variables
Recall that when working with linear equations in two variables, we observed that ordered pairs that produced true statements when substituted into an equation were called solutions to that equation. We can make a similar statement for inequalities in two variables. We say that an inequality in two variables has a solution when a pair of values has been found such that when these values are substituted into the inequality a true statement results.
The Location of Solutions in the Plane
As with equations, solutions to linear inequalities have particular locations in the plane. All solutions to a linear inequality in two variables are located in one and only in one entire half-plane. For example, consider the inequality
\(2x + 3y \le 6\)
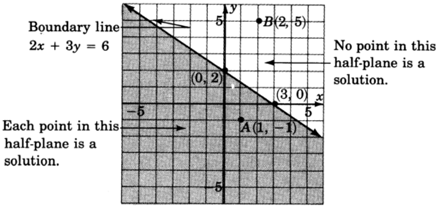
All solutions to the inequality \(2x + 3y \le 6\) lie in the shaded half-plane.
Point \(A(1, -1)\) is a solution since:
\(\begin{aligned}
2x + 3y \le 6\\
2(1) + 3(-1) \le 6?\\
2 - 3 \le 6?
-1 \le 6. \text{True.}
\end{aligned}\)
Point \(B(2, 5)\) is not a solution since:
\(\begin{aligned}
2x + 3y \le 6\\
2(2) + 3(5) \le 6?\\
4 + 15 \le 6?
19 \le 6. \text{False}
\end{aligned}\)
Method of Graphing
The method of graphing linear inequalities in two variables is as follows:
- Graph the boundary line (consider the inequality as an equation, that is, replace the inequality sign with an equal sign).
- If the inequality is \(≤\) or \(≥\), draw the boundary line solid. This means that points on the line are solutions and are part of the graph.
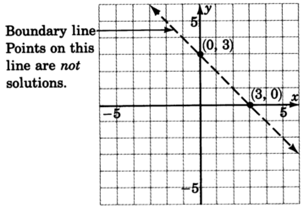
- If the inequality is \(<\) or \(>\), draw the boundary line dotted. This means that points on the line are not solutions and are not part of the graph.
- Determine which half-plane to shade by choosing a test point.
- If, when substituted, the test point yields a true statement, shade the half-plane containing it.
- If, when substituted, the test point yields a false statement, shade the half-plane on the opposite side of the boundary line.
Sample Set A
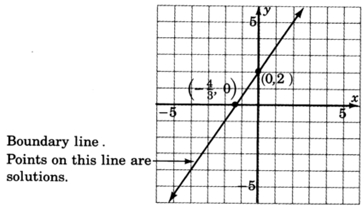
Graph \(3x - 2y \ge -4\).
1. Graph the boundary line. The inequality is \(\ge\) so we'll draw the line solid. Consider the inequality as an equation.
\(3x - 2y = -4\)
| \(x\) | \(y\) | \((x, y)\) |
|
\(0\) \(\dfrac{-4}{3}\) |
\(2\) \(0\) |
\((0, 2)\) (\(frac{-4}{3}, 0)\) |
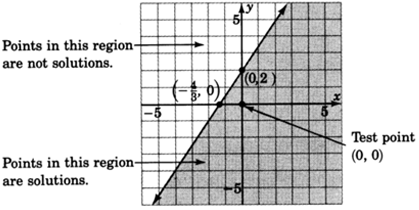
2. Choose a test point. The easiest one is \((0, 0)\). Substitute \((0, 0)\) into the original inequality.
\(\begin{array}{flushleft}
3x - 2y \ge -4\\
3(0) - 2(0) \ge -4?\\
0 - 0 \ge -4?
0 \ge -4. \text{ True}
\end{array}\)
Shade the half-plane containing \((0, 0)\).
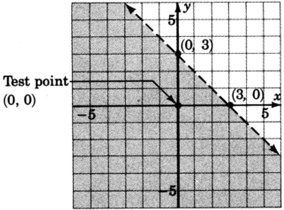
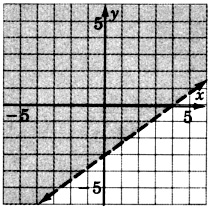
Graph \(x + y - 3 < 0\)
1. Graph the boundary line: \(x + y - 3 = 0\). The inequality is \( < \) so we'll draw the line dotted.
2. Choose a test point, say \((0, 0)\).
\(\begin{array}{flushleft}
x + y - 3 < 0\\
0 + 0 - 3 < 0?\\
-3 < 0. \text{ True}
\end{array}\)
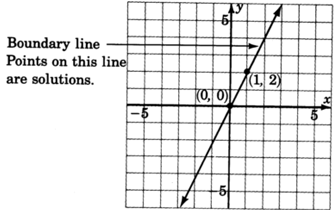
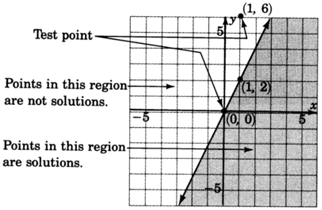
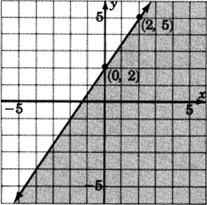
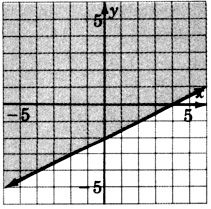
Graph \(y \le 2x\).
1. Graph the boundary line \(y = 2x\). The inequality is \(\le\), so we'll draw the line solid.
2. Choose a test point, say \((0, 0)\).
\(\begin{array}{flushleft}
y \le 2x\\
0 \le 2(0)?\\
0 \le 0. \text{ True}
\end{array}\)
Shade the half-plane containing \((0, 0)\). We can't! \((0, 0)\) is right on the line! Pick another test point, say \((1, 6)\).
\(\begin{array}{flushleft}
y \le 2x\\
6 \le 2(1)\\
6 \le 2. \text{ False}
\end{array}\)
Shade the half-plane on the opposite side of the boundary line.
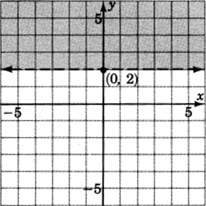
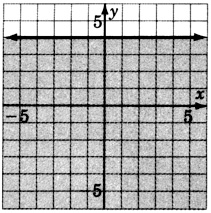
Graph \(y > 2\).
1. Graph the boundary line \(y = 2\). The inequality is \( >\) so we'll draw the line dotted.
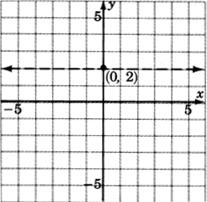
2. We don't really need a test point. Where is \(y > 2\)? Above the line \(y = 2\)! Any point above the line clearly has a \(y\)-coordinate greater than \(2\)
Practice Set A
Solve the following inequalities by graphing.
\(-3x + 2y \le 4\)
- Answer
-
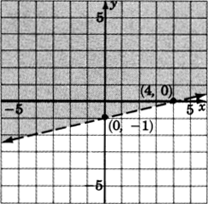
\(x−4y<4\)
- Answer
-
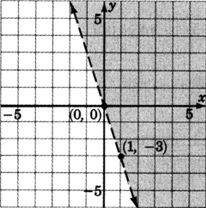
\(3x+y>0\)
- Answer
-
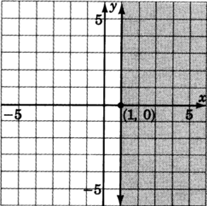
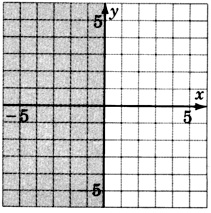
\(x≥1\)
- Answer
-
Exercises
Solve the inequalities by graphing.
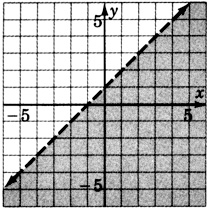
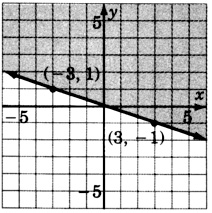
\(y<x+1\)
- Answer
-
\(x+y≤1\)
\(−x+2y+4≥0\)
- Answer
-
\(−x+5y−10<0\)
\(−3x+4y>−12\)
- Answer
-
\(2x+5y−15≥0\)
\(y≤4\)
- Answer
-
\(x≥2\)
\(x≤0\)
- Answer
-
\(x−y<0\)
\(x+3y≥0\)
- Answer
-
\(−2x+4y>0\)
Exercises for Review
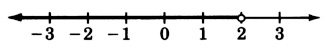
Graph the inequality \(−3x+5≥−1\).

- Answer
-
Supply the missing word. The geometric representation (picture) of the solutions to an equation is called the of the equation.
Supply the denominator: \(m = \dfrac{y_2-y_1}{?}\)
- Answer
-
\(m = \dfrac{y_2-y_1}{x_2-x_1}\)
Graph the equation \(y=−3x+2\).
Write the equation of the line that has slope \(4\) and passes through the point \((−1, 2)\).
- Answer
-
\(y=4x+6\)