
1.1: Graphing a Linear Equation
- Page ID
- 37805

In this section, you will learn to:
- Graph a line when you know its equation
- Graph a line when you are given its equation in parametric form
- Graph and find equations of vertical and horizontal lines
Graphing a Line from it Equation
Equations whose graphs are straight lines are called linear equations. The following are some examples of linear equations:
\(2 x-3 y=6, \quad 3 x=4 y-7, \quad y=2 x-5, \quad 2 y=3, \quad \text { and } \quad x-2=0\)
A line is completely determined by two points. Therefore, to graph a linear equation we need to find the coordinates of two points. This can be accomplished by choosing an arbitrary value for x or y and then solving for the other variable.
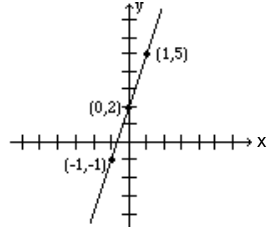
Graph the line: \(y = 3x + 2\)
Solution
We need to find the coordinates of at least two points. We arbitrarily choose x = - 1, x = 0, and x = 1.
- If x = -1, then y = 3(-1) + 2 or -1. Therefore, (-1, -1) is a point on this line.
- If x = 0, then y = 3(0) + 2 or y = 2. Hence the point (0, 2).
- If x = 1, then y = 5, and we get the point (1, 5).
Below, the results are summarized, and the line is graphed.
| x | -1 | 0 | 1 |
| y | -1 | 2 | 5 |
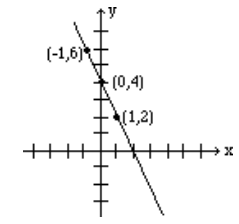
Graph the line: \(2x + y = 4\)
Solution
Again, we need to find coordinates of at least two points.
We arbitrarily choose x = -1, x = 0, and y = 2.
- If x = -1, then 2(-1) + y = 4 which results in y = 6. Therefore, (-1, 6) is a point on this line.
- If x = 0, then 2(0) + y = 4, which results in y = 4. Hence the point (0, 4).
- If y = 2, then 2x + 2 = 4, which yields x = 1, and gives the point (1, 2).
The table below shows the points, and the line is graphed.
| x | -1 | 0 | 1 |
| y | 6 | 4 | 2 |
Intercepts
The points at which a line crosses the coordinate axes are called the intercepts.
When graphing a line by plotting two points, using the intercepts is often preferred because they are easy to find.
- To find the value of the x-intercept, we let y = 0
- To find the value of the y-intercept, we let x = 0.
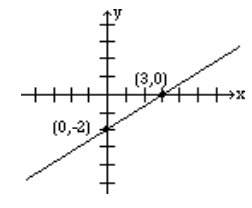
Find the intercepts of the line: \(2x - 3y = 6\), and graph.
Solution
To find the x-intercept, let y = 0 in the equation, and solve for x.
\[\begin{align*} 2x - 3(0) &= 6 \\[4pt] 2x - 0 &= 6 \\[4pt] 2x &= 6 \\[4pt] x &= 3 \end{align*} \nonumber \]
Therefore, the x-intercept is the point (3,0).
To find the y-intercept, let x = 0 in the equation, and solve for y.
\[\begin{align*} 2(0) - 3y &= 6 \\[4pt] 0 - 3y &= 6 \\[4pt] -3y &= 6 \\[4pt] y &= -2 \end{align*} \nonumber \]
Therefore, the y-intercept is the point (0, -2).
To graph the line, plot the points for the x-intercept (3,0) and the y-intercept (0, -2), and use them to draw the line.
Graphing a Line from its Equation in Parametric Form
In higher math, equations of lines are sometimes written in parametric form. For example, \(x = 3 + 2t\), \(y = 1 + t\). The letter \(t\) is called the parameter, or the dummy variable.
Parametric lines can be graphed by finding values for x and y by substituting numerical values for t. Plot the points using their (x,y) coordinates and use the points to draw the line.
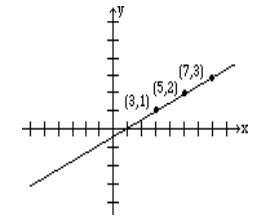
Graph the line given by the parametric equations: \(x = 3 + 2t\), \(y = 1 + t\)
Solution
Let t = 0, 1 and 2; for each value of t find the corresponding values for x and y.
The results are given in the table below.
| t | x | y | Point on Line |
|---|---|---|---|
| 0 | 3 | 1 | (3, 1) |
| 1 | 5 | 2 | (5, 2) |
| 2 | 7 | 3 | (7, 3) |
Horizontal and Vertical Lines
When an equation of a line has only one variable, the resulting graph is a horizontal or a vertical line.
- The graph of the line \(x = a\), where \(a\) is a constant, is a vertical line that passes through the point \((a, 0)\). Every point on this line has the x-coordinate equal to a, regardless of the y-coordinate.
- The graph of the line \(y = b\), where \(b\) is a constant, is a horizontal line that passes through the point \((0, b)\). Every point on this line has the y-coordinate equal to b, regardless of the x-coordinate.
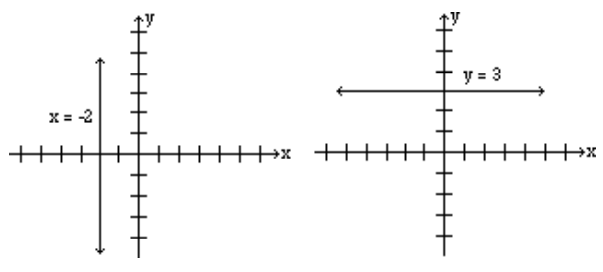
Graph the lines: x = -2 , and y = 3.
Solution
The graph of the line x = -2 is a vertical line that has the x-coordinate -2 no matter what the y-coordinate is. The graph is a vertical line passing through point (-2, 0).
The graph of the line y = 3, is a horizontal line that has the y-coordinate 3 regardless of what the x-coordinate is. Therefore, the graph is a horizontal line that passes through point (0, 3).
Note: Most students feel that the coordinates of points must always be integers. This is not true, and in real life situations, not always possible. Do not be intimidated if your points include numbers that are fractions or decimals.