
6.2: Graphs
- Page ID
- 34205

\( \newcommand{\vecs}[1]{\overset { \scriptstyle \rightharpoonup} {\mathbf{#1}} } \)
\( \newcommand{\vecd}[1]{\overset{-\!-\!\rightharpoonup}{\vphantom{a}\smash {#1}}} \)
\( \newcommand{\dsum}{\displaystyle\sum\limits} \)
\( \newcommand{\dint}{\displaystyle\int\limits} \)
\( \newcommand{\dlim}{\displaystyle\lim\limits} \)
\( \newcommand{\id}{\mathrm{id}}\) \( \newcommand{\Span}{\mathrm{span}}\)
( \newcommand{\kernel}{\mathrm{null}\,}\) \( \newcommand{\range}{\mathrm{range}\,}\)
\( \newcommand{\RealPart}{\mathrm{Re}}\) \( \newcommand{\ImaginaryPart}{\mathrm{Im}}\)
\( \newcommand{\Argument}{\mathrm{Arg}}\) \( \newcommand{\norm}[1]{\| #1 \|}\)
\( \newcommand{\inner}[2]{\langle #1, #2 \rangle}\)
\( \newcommand{\Span}{\mathrm{span}}\)
\( \newcommand{\id}{\mathrm{id}}\)
\( \newcommand{\Span}{\mathrm{span}}\)
\( \newcommand{\kernel}{\mathrm{null}\,}\)
\( \newcommand{\range}{\mathrm{range}\,}\)
\( \newcommand{\RealPart}{\mathrm{Re}}\)
\( \newcommand{\ImaginaryPart}{\mathrm{Im}}\)
\( \newcommand{\Argument}{\mathrm{Arg}}\)
\( \newcommand{\norm}[1]{\| #1 \|}\)
\( \newcommand{\inner}[2]{\langle #1, #2 \rangle}\)
\( \newcommand{\Span}{\mathrm{span}}\) \( \newcommand{\AA}{\unicode[.8,0]{x212B}}\)
\( \newcommand{\vectorA}[1]{\vec{#1}} % arrow\)
\( \newcommand{\vectorAt}[1]{\vec{\text{#1}}} % arrow\)
\( \newcommand{\vectorB}[1]{\overset { \scriptstyle \rightharpoonup} {\mathbf{#1}} } \)
\( \newcommand{\vectorC}[1]{\textbf{#1}} \)
\( \newcommand{\vectorD}[1]{\overrightarrow{#1}} \)
\( \newcommand{\vectorDt}[1]{\overrightarrow{\text{#1}}} \)
\( \newcommand{\vectE}[1]{\overset{-\!-\!\rightharpoonup}{\vphantom{a}\smash{\mathbf {#1}}}} \)
\( \newcommand{\vecs}[1]{\overset { \scriptstyle \rightharpoonup} {\mathbf{#1}} } \)
\(\newcommand{\longvect}{\overrightarrow}\)
\( \newcommand{\vecd}[1]{\overset{-\!-\!\rightharpoonup}{\vphantom{a}\smash {#1}}} \)
\(\newcommand{\avec}{\mathbf a}\) \(\newcommand{\bvec}{\mathbf b}\) \(\newcommand{\cvec}{\mathbf c}\) \(\newcommand{\dvec}{\mathbf d}\) \(\newcommand{\dtil}{\widetilde{\mathbf d}}\) \(\newcommand{\evec}{\mathbf e}\) \(\newcommand{\fvec}{\mathbf f}\) \(\newcommand{\nvec}{\mathbf n}\) \(\newcommand{\pvec}{\mathbf p}\) \(\newcommand{\qvec}{\mathbf q}\) \(\newcommand{\svec}{\mathbf s}\) \(\newcommand{\tvec}{\mathbf t}\) \(\newcommand{\uvec}{\mathbf u}\) \(\newcommand{\vvec}{\mathbf v}\) \(\newcommand{\wvec}{\mathbf w}\) \(\newcommand{\xvec}{\mathbf x}\) \(\newcommand{\yvec}{\mathbf y}\) \(\newcommand{\zvec}{\mathbf z}\) \(\newcommand{\rvec}{\mathbf r}\) \(\newcommand{\mvec}{\mathbf m}\) \(\newcommand{\zerovec}{\mathbf 0}\) \(\newcommand{\onevec}{\mathbf 1}\) \(\newcommand{\real}{\mathbb R}\) \(\newcommand{\twovec}[2]{\left[\begin{array}{r}#1 \\ #2 \end{array}\right]}\) \(\newcommand{\ctwovec}[2]{\left[\begin{array}{c}#1 \\ #2 \end{array}\right]}\) \(\newcommand{\threevec}[3]{\left[\begin{array}{r}#1 \\ #2 \\ #3 \end{array}\right]}\) \(\newcommand{\cthreevec}[3]{\left[\begin{array}{c}#1 \\ #2 \\ #3 \end{array}\right]}\) \(\newcommand{\fourvec}[4]{\left[\begin{array}{r}#1 \\ #2 \\ #3 \\ #4 \end{array}\right]}\) \(\newcommand{\cfourvec}[4]{\left[\begin{array}{c}#1 \\ #2 \\ #3 \\ #4 \end{array}\right]}\) \(\newcommand{\fivevec}[5]{\left[\begin{array}{r}#1 \\ #2 \\ #3 \\ #4 \\ #5 \\ \end{array}\right]}\) \(\newcommand{\cfivevec}[5]{\left[\begin{array}{c}#1 \\ #2 \\ #3 \\ #4 \\ #5 \\ \end{array}\right]}\) \(\newcommand{\mattwo}[4]{\left[\begin{array}{rr}#1 \amp #2 \\ #3 \amp #4 \\ \end{array}\right]}\) \(\newcommand{\laspan}[1]{\text{Span}\{#1\}}\) \(\newcommand{\bcal}{\cal B}\) \(\newcommand{\ccal}{\cal C}\) \(\newcommand{\scal}{\cal S}\) \(\newcommand{\wcal}{\cal W}\) \(\newcommand{\ecal}{\cal E}\) \(\newcommand{\coords}[2]{\left\{#1\right\}_{#2}}\) \(\newcommand{\gray}[1]{\color{gray}{#1}}\) \(\newcommand{\lgray}[1]{\color{lightgray}{#1}}\) \(\newcommand{\rank}{\operatorname{rank}}\) \(\newcommand{\row}{\text{Row}}\) \(\newcommand{\col}{\text{Col}}\) \(\renewcommand{\row}{\text{Row}}\) \(\newcommand{\nul}{\text{Nul}}\) \(\newcommand{\var}{\text{Var}}\) \(\newcommand{\corr}{\text{corr}}\) \(\newcommand{\len}[1]{\left|#1\right|}\) \(\newcommand{\bbar}{\overline{\bvec}}\) \(\newcommand{\bhat}{\widehat{\bvec}}\) \(\newcommand{\bperp}{\bvec^\perp}\) \(\newcommand{\xhat}{\widehat{\xvec}}\) \(\newcommand{\vhat}{\widehat{\vvec}}\) \(\newcommand{\uhat}{\widehat{\uvec}}\) \(\newcommand{\what}{\widehat{\wvec}}\) \(\newcommand{\Sighat}{\widehat{\Sigma}}\) \(\newcommand{\lt}{<}\) \(\newcommand{\gt}{>}\) \(\newcommand{\amp}{&}\) \(\definecolor{fillinmathshade}{gray}{0.9}\)Drawing Graphs
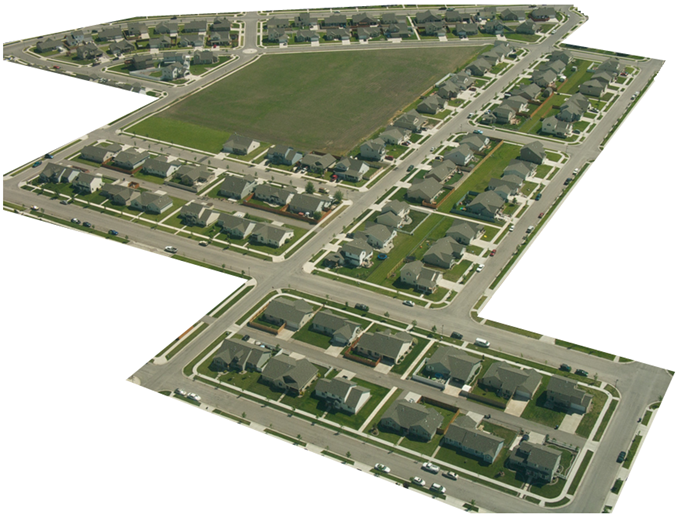
Here is a portion of a housing development from Missoula, Montana[1]. As part of her job, the development’s lawn inspector has to walk down every street in the development making sure homeowners’ landscaping conforms to the community requirements.
Solution
Naturally, she wants to minimize the amount of walking she has to do. Is it possible for her to walk down every street in this development without having to do any backtracking? While you might be able to answer that question just by looking at the picture for a while, it would be ideal to be able to answer the question for any picture regardless of its complexity.
To do that, we first need to simplify the picture into a form that is easier to work with. We can do that by drawing a simple line for each street. Where streets intersect, we will place a dot.
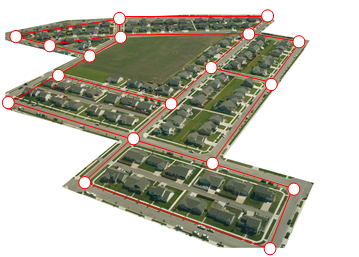

This type of simplified picture is called a graph.
A graph consists of a set of dots, called vertices, and a set of edges connecting pairs of vertices.
While we drew our original graph to correspond with the picture we had, there is nothing particularly important about the layout when we analyze a graph. Both of the graphs below are equivalent to the one drawn above since they show the same edge connections between the same vertices as the original graph.

You probably already noticed that we are using the term graph differently than you may have used the term in the past to describe the graph of a mathematical function.
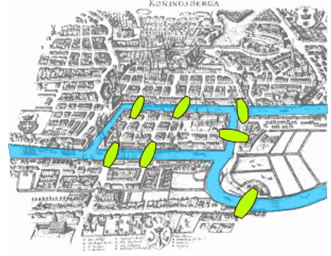 Back in the 18th century in the Prussian city of Königsberg, a river ran through the city and seven bridges crossed the forks of the river. The river and the bridges are highlighted in the picture to the right[2].
As a weekend amusement, townsfolk would see if they could find a route that would take them across every bridge once and return them to where they started.
Solution
Leonard Euler (pronounced OY-lur), one of the most prolific mathematicians ever, looked at this problem in 1735, laying the foundation for graph theory as a field in mathematics. To analyze this problem, Euler introduced edges representing the bridges:

Since the size of each land mass it is not relevant to the question of bridge crossings, each can be shrunk down to a vertex representing the location:

Notice that in this graph there are two edges connecting the north bank and island, corresponding to the two bridges in the original drawing. Depending upon the interpretation of edges and vertices appropriate to a scenario, it is entirely possible and reasonable to have more than one edge connecting two vertices.
While we haven’t answered the actual question yet of whether or not there is a route which crosses every bridge once and returns to the starting location, the graph provides the foundation for exploring this question.
Definitions
While we loosely defined some terminology earlier, we now will try to be more specific.
A vertex is a dot in the graph that could represent an intersection of streets, a land mass, or a general location, like “work” or “school”. Vertices are often connected by edges. Note that vertices only occur when a dot is explicitly placed, not whenever two edges cross. Imagine a freeway overpass – the freeway and side street cross, but it is not possible to change from the side street to the freeway at that point, so there is no intersection and no vertex would be placed.
Edges connect pairs of vertices. An edge can represent a physical connection between locations, like a street, or simply that a route connecting the two locations exists, like an airline flight.
An alternate way to represent a graph is with an adjacency table. This lists the vertices on the row and column headers of a table, and has a value in each cell if the vertices are connected with an edge. Later the value might represent something like the length or cost of the edge, but for now we will just put a 1 where there is an edge.
For example, this graph

could be represented with the adjacency table
| A | B | C | D | |
|---|---|---|---|---|
| A | 1 | 1 | ||
| B | 1 | 1 | 1 | |
| C | 1 | 1 | 1 | |
| D | 1 | 1 |
A loop is a special type of edge that connects a vertex to itself. Loops are not used much in street network graphs.

The degree of a vertex is the number of edges meeting at that vertex. It is possible for a vertex to have a degree of zero or larger.

A path is a sequence of vertices using the edges. Usually we are interested in a path between two vertices. For example, a path from vertex A to vertex M is shown below. It is one of many possible paths in this graph.

A circuit is a path that begins and ends at the same vertex. A circuit starting and ending at vertex A is shown below.

A graph is connected if there is a path from any vertex to any other vertex. Every graph drawn so far has been connected. The graph below is disconnected; there is no way to get from the vertices on the left to the vertices on the right.

Depending upon the problem being solved, sometimes weights are assigned to the edges. The weights could represent the distance between two locations, the travel time, or the travel cost. It is important to note that the distance between vertices in a graph does not necessarily correspond to the weight of an edge.
The graph below shows 5 cities. The weights on the edges represent the airfare for a one-way flight between the cities.
- How many vertices and edges does the graph have?
- Is the graph connected?
- What is the degree of the vertex representing LA?
- If you fly from Seattle to Dallas to Atlanta, is that a path or a circuit?
- If you fly from LA to Chicago to Dallas to LA, is that a path or a circuit?

Adjacency Table
| Seattle | Dallas | Atlanta | Chicago | LA | |
|---|---|---|---|---|---|
| Seattle | * | $120 | $140 | $145 | $70 |
| Dallas | $120 | * | $85 | $165 | $150 |
| Atlanta | $140 | $85 | * | $75 | $170 |
| Chicago | $145 | $165 | $75 | * | $100 |
| LA | $70 | $150 | $170 | $100 | * |
- Answer
-
a. 5 vertices, 10 edges
b. Yes, it is connected
c. The vertex is degree 4
d. A path
e. A circuit
[1] Sam Beebe. http://www.flickr.com/photos/sbeebe/2850476641/, CC-BY
[2] Bogdan Giuşcă. http://en.Wikipedia.org/wiki/File:Ko...rg_bridges.png