
11.2: Creating Double Number Line Diagrams
- Page ID
- 39928
Lesson
Let's draw double number line diagrams like a pro.
Exercise \(\PageIndex{1}\): Orderling on a Number Line
- Locate and label the following numbers on the number line.
\(\frac{1}{2}\qquad\frac{1}{4}1\frac{3}{4}\qquad 1.5\qquad 1.75\)

- Based on where you placed the numbers, locate and label four more fractions or decimals on the number line.
Exercise \(\PageIndex{2}\): Just a Little Green
The other day, we made green water by mixing 5 ml of blue water with 15 ml of yellow water. We want to make a very small batch of the same shade of green water. We need to know how much yellow water to mix with only 1 ml of blue water.
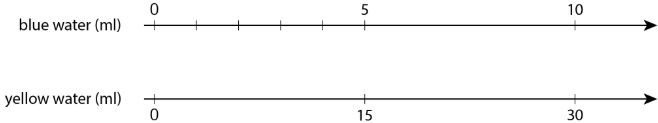
- On the number line for blue water, label the four tick marks shown.
- On the number line for yellow water, draw and label tick marks to show the amount of yellow water needed for each amount of blue water.
- How much yellow water should be used for 1 ml of blue water? Circle where you can see this on the double number line.
- How much yellow water should be used for 11 ml of blue water?
- How much yellow water should be used for 8 ml of blue water?
- Why is it useful to know how much yellow water should be used with 1 ml of blue water?
Exercise \(\PageIndex{3}\): Art Paste on a Double Number Line
A recipe for art paste says “For every 2 pints of water, mix in 8 cups of flour.”
- Follow the instructions to draw a double number line diagram representing the recipe for art paste.
- Use a ruler to draw two parallel lines.
- Label the first line “pints of water.” Label the second line “cups of flour.”
- Draw at least 6 equally spaced tick marks that line up on both lines.
- Along the water line, label the tick marks with the amount of water in 0, 1, 2, 3, 4, and 5 batches of art paste.
- Along the flour line, label the tick marks with the amount of flour in 0, 1, 2, 3, 4, and 5 batches of art paste.
- Compare your double number line diagram with your partner’s. Discuss your thinking. If needed, revise your diagram.
- Next, use your double number line to answer these questions:
- How much flour should be used with 10 pints of water?
- How much water should be used with 24 cups of flour?
- How much flour per pint of water does this recipe use?
Are you ready for more?
A square with side of 10 units overlaps a square with side of 8 units in such a way that its corner \(B\) is placed exactly at the center of the smaller square. As a result of the overlapping, the two sides of the large square intersect the two sides of the small square exactly at points \(C\) and \(E\), as shown. The length of \(CD\) is 6 units.
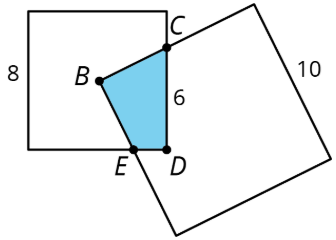
What is the area of the overlapping region \(CDEB\)?
Exercise \(\PageIndex{4}\): Revisiting Tuna Casserole
The other day, we looked at a recipe for tuna casserole that called for 10 ounces of cream of chicken soup for every 3 cups of elbow-shaped pasta.
- Draw a double number line diagram that represents the amounts of soup and pasta in different-sized batches of this recipe.
- If you made a large amount of tuna casserole by mixing 40 ounces of soup with 15 cups of pasta, would it taste the same as the original recipe? Explain or show your reasoning.
- The original recipe called for 6 ounces of tuna for every 3 cups of pasta. Add a line to your diagram to represent the amount of tuna in different batches of casserole.
- How many ounces of soup should you mix with 30 ounces of tuna to make a casserole that tastes the same as the original recipe?
Summary
Here are some guidelines to keep in mind when drawing a double number line diagram:
- The two parallel lines should have labels that describe what the numbers represent.
- The tick marks and numbers should be spaced at equal intervals.
- Numbers that line up vertically make equivalent ratios.
For example, the ratio of the number of eggs to cups of milk in a recipe is \(4:1\). Here is a double number line that represents the situation:
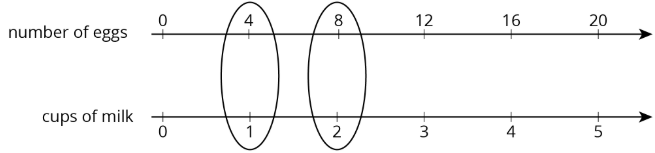
We can also say that this recipe uses “4 eggs per cup of milk” because the word per means “for each.”
Glossary Entries
Definition: Double Number Line Diagram
A double number line diagram uses a pair of parallel number lines to represent equivalent ratios. The locations of the tick marks match on both number lines. The tick marks labeled 0 line up, but the other numbers are usually different.
Definition: Per
The word per means “for each.” For example, if the price is $5 per ticket, that means you will pay $5 for each ticket. Buying 4 tickets would cost $20, because \(4\cdot 5=20\)
Practice
Exercise \(\PageIndex{5}\)
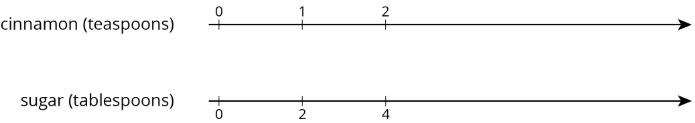
A recipe for cinnamon rolls uses 2 tablespoons of sugar per teaspoon of cinnamon for the filling. Complete the double number line diagram to show the amount of cinnamon and sugar in 3, 4, and 5 batches.
Exercise \(\PageIndex{6}\)
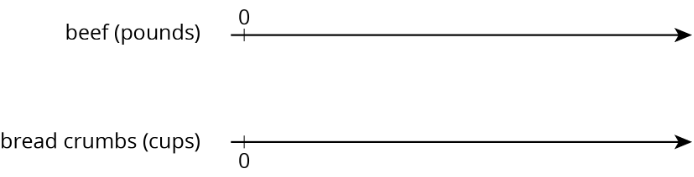
One batch of meatloaf contains 2 pounds of beef and \(\frac{1}{2}\) cup of bread crumbs. Complete the double number line diagram to show the amounts of beef and bread crumbs needed for 1, 2, 3, and 4 batches of meatloaf.
Exercise \(\PageIndex{7}\)
A recipe for tropical fruit punch says, “Combine 4 cups of pineapple juice with 5 cups of orange juice.”
- Create a double number showing the amount of each type of juice in 1, 2, 3, 4, and 5 batches of the recipe.
- If 12 cups of pineapple juice are used with 20 cups of orange juice, will the recipe taste the same? Explain your reasoning.
- The recipe also calls for \(\frac{1}{3}\) cup of lime juice for every 5 cups of orange juice. Add a line to your diagram to represent the amount of lime juice in different batches of tropical fruit punch.
Exercise \(\PageIndex{8}\)
One batch of pink paint uses 2 cups of red paint and 7 cups of white paint. Mai made a large amount of pink paint using 14 cups of red paint.
- How many batches of pink paint did she make?
- How many cups of white paint did she use?
(From Unit 2.2.2)
Exercise \(\PageIndex{9}\)
- Find three different ratios that are equivalent to the ratio \(3:11\).
- Explain why your ratios are equivalent.
(From Unit 2.2.3)
Exercise \(\PageIndex{10}\)
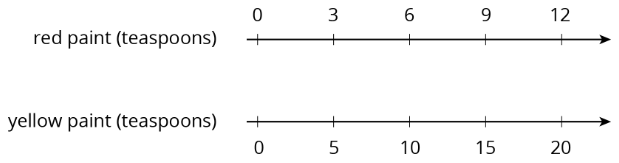
Here is a diagram that represents the pints of red and yellow paint in a mixture.
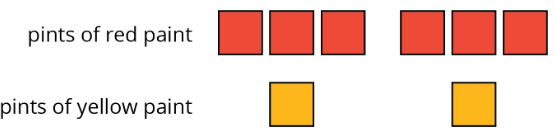
Select all statements that accurately describe the diagram.
- The ratio of yellow paint to red paint is 2 to 6.
- For every 3 pints of red paint, there is 1 pint of yellow paint.
- For every pint of yellow paint, there are 3 pints of red paint.
- For every pint of yellow paint there are 6 pints of red paint.
- The ratio of red paint to yellow paint is \(6:2\).
(From Unit 2.1.2)