
12.1: Representing Ratios with Tables
- Page ID
- 39933
Lesson
Let's use tables to represent equivalent ratios.
Exercise \(\PageIndex{1}\): How Is It Growing?
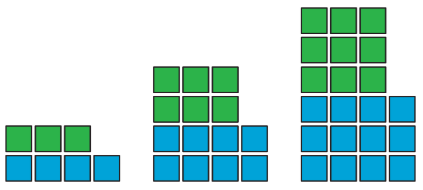
Look for a pattern in the figures.
- How many total tiles will be in:
- the 4th figure?
- the 5th figure?
- the 10th figure?
- How do you see it growing?
Exercise \(\PageIndex{2}\): A Huge Amount of Sparkling Orange Juice
Noah’s recipe for one batch of sparkling orange juice uses 4 liters of orange juice and 5 liters of soda water.
- Use the double number line to show how many liters of each ingredient to use for different-sized batches of sparkling orange juice.
- If someone mixes 36 liters of orange juice and 45 liters of soda water, how many batches would they make?
- If someone uses 400 liters of orange juice, how much soda water would they need?
- If someone uses 455 liters of soda water, how much orange juice would they need?
- Explain the trouble with using a double number line diagram to answer the last two questions.
Exercise \(\PageIndex{3}\): Bacthes of Trail Mix
A recipe for trail mix says: “Mix 7 ounces of almonds with 5 ounces of raisins.” Here is a table that has been started to show how many ounces of almonds and raisins would be in different-sized batches of this trail mix.
| almonds (oz) | raisins (oz) |
|---|---|
| \(7\) | \(5\) |
| \(28\) | |
| \(10\) | |
| \(3.5\) | |
| \(250\) | |
| \(56\) |
- Complete the table so that ratios represented by each row are equivalent.
- What methods did you use to fill in the table?
- How do you know that each row shows a ratio that is equivalent to \(7:5\)? Explain your reasoning.
Are you ready for more?
You have created a best-selling recipe for chocolate chip cookies. The ratio of sugar to flour is \(2:5\).
Create a table in which each entry represents amounts of sugar and flour that might be used at the same time in your recipe.
- One entry should have amounts where you have fewer than 25 cups of flour.
- One entry should have amounts where you have between 20–30 cups of sugar.
- One entry can have any amounts using more than 500 units of flour.
Summary
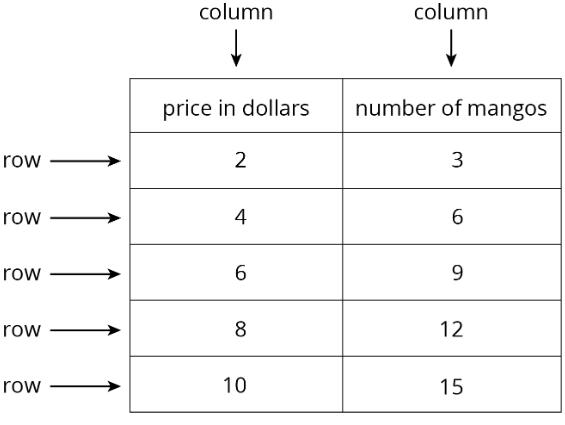
A table is a way to organize information. Each horizontal set of entries is called a row, and each vertical set of entries is called a column. (The table shown has 2 columns and 5 rows.) A table can be used to represent a collection of equivalent ratios.
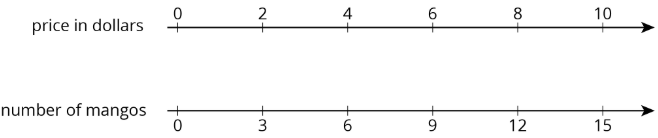
Here is a double number line diagram and a table that both represent the situation: “The price is $2 for every 3 mangos.”
Glossary Entries
Definition: Table
A table organizes information into horizontal rows and vertical columns. The first row or column usually tells what the numbers represent.
For example, here is a table showing the tail lengths of three different pets. This table has four rows and two columns.
| pet | tail length (inches) |
|---|---|
| dog | \(22\) |
| cat | \(12\) |
| mouse | \(2\) |
Practice
Exercise \(\PageIndex{4}\)
Complete the table to show the amounts of yellow and red paint needed for different-sized batches of the same shade of orange paint.
| yellow paint (quarts) | red paint (quarts) |
|---|---|
| \(5\) | \(6\) |
Explain how you know that these amounts of yellow paint and red paint will make the same shade of orange as the mixture in the first row of the table.
Exercise \(\PageIndex{5}\)
A car travels at a constant speed, as shown on the double number line.
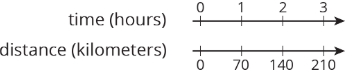
How far does the car travel in 14 hours? Explain or show your reasoning.
Exercise \(\PageIndex{6}\)
The olive trees in an orchard produce 3,000 pounds of olives a year. It takes 20 pounds of olives to make 3 liters of olive oil. How many liters of olive oil can this orchard produce in a year? If you get stuck, consider using the table.
| olives (pounds) | olive oil (liters) |
|---|---|
| \(20\) | \(3\) |
| \(100\) | |
| \(3,000\) |
Exercise \(\PageIndex{7}\)
At a school recess, there needs to be a ratio of 2 adults for every 24 children on the playground. The double number line represents the number of adults and children on the playground at recess.
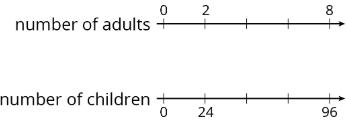
- Label each remaining tick mark with its value.
- How many adults are needed if there are 72 children? Circle your answer on the double number line.
(From Unit 2.3.1)
Exercise \(\PageIndex{8}\)
While playing basketball, Jada’s heart rate goes up to 160 beats per minute. While jogging, her heart beats 25 times in 10 seconds. Assuming her heart beats at a constant rate while jogging, which of these activities resulted in a higher heart rate? Explain your reasoning.
(From Unit 2.3.5)
Exercise \(\PageIndex{9}\)
A shopper bought the following items at the farmer’s market:
- 6 ears of corn for $1.80. What was the cost per ear?
- 12 apples for $2.88. What was the cost per apple?
- 5 tomatoes for $3.10. What was the cost per tomato?
(From Unit 2.3.3)