
13.2: Solving More Ratio Problems


- Last updated
- Mar 27, 2022
- Save as PDF
( \newcommand{\kernel}{\mathrm{null}\,}\)
Lesson
Let's compare all our strategies for solving ratio problems.
Exercise \PageIndex{1}: You Tell the Story
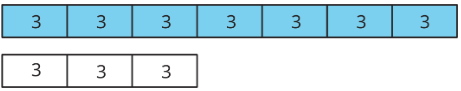
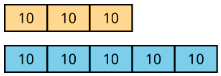
Describe a situation with two quantities that this tape diagram could represent.
Exercise \PageIndex{2}: A Trip to the Aquarium
Consider the problem: A teacher is planning a class trip to the aquarium. The aquarium requires 2 chaperones for every 15 students. The teacher plans accordingly and orders a total of 85 tickets. How many tickets are for chaperones, and how many are for students?
- Solve this problem in one of three ways:
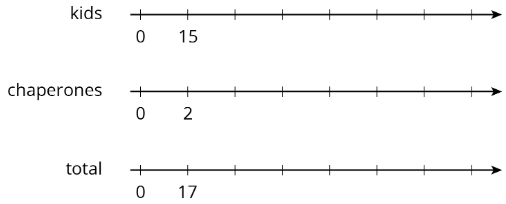
Use a triple number line.
Use a table.
(Fill rows as needed.)
| kids | chaperones | total |
|---|---|---|
| 15 | 2 | 17 |
Use a tape diagram.

- After your class discusses all three strategies, which do you prefer for this problem and why?
Are you ready for more?
Use the digits 1 through 9 to create three equivalent ratios. Use each digit only one time.
 is equivalent to
  and
and 
Exercise \PageIndex{3}: Salad Dressing and Moving Boxes
Solve each problem, and show your thinking. Organize it so it can be followed by others. If you get stuck, consider drawing a double number line, table, or tape diagram.
- A recipe for salad dressing calls for 4 parts oil for every 3 parts vinegar. How much oil should you use to make a total of 28 teaspoons of dressing?
- Andre and Han are moving boxes. Andre can move 4 boxes every half hour. Han can move 5 boxes every half hour. How long will it take Andre and Han to move all 72 boxes?
Summary
When solving a problem involving equivalent ratios, it is often helpful to use a diagram. Any diagram is fine as long as it correctly shows the mathematics and you can explain it.
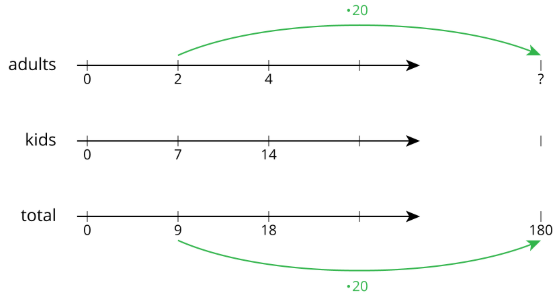
Let’s compare three different ways to solve the same problem: The ratio of adults to kids in a school is 2:7. If there is a total of 180 people, how many of them are adults?
- Tape diagrams are especially useful for this type of problem because both parts of the ratio have the same units (“number of people") and we can see the total number of parts.

This tape diagram has 9 equal parts, and they need to represent 180 people total. That means each part represents 180\div 9, or 20 people.

Two parts of the tape diagram represent adults. There are 40 adults in the school because 2\cdot 20=40.
- Double or triple number lines are useful when we want to see how far apart the numbers are from one another. They are harder to use with very big or very small numbers, but they could support our reasoning.
- Tables are especially useful when the problem has very large or very small numbers.
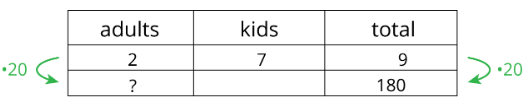
We ask ourselves, “9 times what is 180?” The answer is 20. Next, we multiply 2 by 20 to get the total number of adults in the school.
Another reason to make diagrams is to communicate our thinking to others. Here are some good habits when making diagrams:
- Label each part of the diagram with what it represents.
- Label important amounts.
- Make sure you read what the question is asking and answer it.
- Make sure you make the answer easy to find.
- Include units in your answer. For example, write “4 cups” instead of just “4.”
- Double check that your ratio language is correct and matches your diagram.
Glossary Entries
Definition: Tape Diagram
A tape diagram is a group of rectangles put together to represent a relationship between quantities.
For example, this tape diagram shows a ratio of 30 gallons of yellow paint to 50 gallons of blue paint.
If each rectangle were labeled 5, instead of 10, then the same picture could represent the equivalent ratio of 15 gallons of yellow paint to 25 gallons of blue paint.
Practice
Exercise \PageIndex{4}
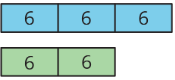
Describe a situation that could be represented with this tape diagram.
Exercise \PageIndex{5}
There are some nickels, dimes, and quarters in a large piggy bank. For every 2 nickels there are 3 dimes. For every 2 dimes there are 5 quarters. There are 500 coins total.
- How many nickels, dimes, and quarters are in the piggy bank? Explain your reasoning.
- How much are the coins in the piggy bank worth?
Exercise \PageIndex{6}
Two horses start a race at the same time. Horse A gallops at a steady rate of 32 feet per second and Horse B gallops at a steady rate of 28 feet per second. After 5 seconds, how much farther will Horse A have traveled? Explain or show your reasoning.
Exercise \PageIndex{7}
Andre paid $13 for 3 books. Diego bought 12 books priced at the same rate. How much did Diego pay for the 12 books? Explain your reasoning.
(From Unit 2.3.5)
Exercise \PageIndex{8}
Which polyhedron can be assembled from this net?

- A triangular pyramid
- A trapezoidal prism
- A rectangular pyramid
- A triangular prism
(From Unit 1.5.4)
Exercise \PageIndex{9}
Find the area of the triangle. Show your reasoning. If you get stuck, consider drawing a rectangle around the triangle.
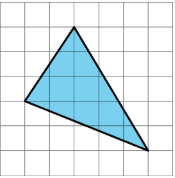
(From Unit 1.3.4)