
41.2: Statistical Questions
- Page ID
- 40868
\( \newcommand{\vecs}[1]{\overset { \scriptstyle \rightharpoonup} {\mathbf{#1}} } \)
\( \newcommand{\vecd}[1]{\overset{-\!-\!\rightharpoonup}{\vphantom{a}\smash {#1}}} \)
\( \newcommand{\dsum}{\displaystyle\sum\limits} \)
\( \newcommand{\dint}{\displaystyle\int\limits} \)
\( \newcommand{\dlim}{\displaystyle\lim\limits} \)
\( \newcommand{\id}{\mathrm{id}}\) \( \newcommand{\Span}{\mathrm{span}}\)
( \newcommand{\kernel}{\mathrm{null}\,}\) \( \newcommand{\range}{\mathrm{range}\,}\)
\( \newcommand{\RealPart}{\mathrm{Re}}\) \( \newcommand{\ImaginaryPart}{\mathrm{Im}}\)
\( \newcommand{\Argument}{\mathrm{Arg}}\) \( \newcommand{\norm}[1]{\| #1 \|}\)
\( \newcommand{\inner}[2]{\langle #1, #2 \rangle}\)
\( \newcommand{\Span}{\mathrm{span}}\)
\( \newcommand{\id}{\mathrm{id}}\)
\( \newcommand{\Span}{\mathrm{span}}\)
\( \newcommand{\kernel}{\mathrm{null}\,}\)
\( \newcommand{\range}{\mathrm{range}\,}\)
\( \newcommand{\RealPart}{\mathrm{Re}}\)
\( \newcommand{\ImaginaryPart}{\mathrm{Im}}\)
\( \newcommand{\Argument}{\mathrm{Arg}}\)
\( \newcommand{\norm}[1]{\| #1 \|}\)
\( \newcommand{\inner}[2]{\langle #1, #2 \rangle}\)
\( \newcommand{\Span}{\mathrm{span}}\) \( \newcommand{\AA}{\unicode[.8,0]{x212B}}\)
\( \newcommand{\vectorA}[1]{\vec{#1}} % arrow\)
\( \newcommand{\vectorAt}[1]{\vec{\text{#1}}} % arrow\)
\( \newcommand{\vectorB}[1]{\overset { \scriptstyle \rightharpoonup} {\mathbf{#1}} } \)
\( \newcommand{\vectorC}[1]{\textbf{#1}} \)
\( \newcommand{\vectorD}[1]{\overrightarrow{#1}} \)
\( \newcommand{\vectorDt}[1]{\overrightarrow{\text{#1}}} \)
\( \newcommand{\vectE}[1]{\overset{-\!-\!\rightharpoonup}{\vphantom{a}\smash{\mathbf {#1}}}} \)
\( \newcommand{\vecs}[1]{\overset { \scriptstyle \rightharpoonup} {\mathbf{#1}} } \)
\(\newcommand{\longvect}{\overrightarrow}\)
\( \newcommand{\vecd}[1]{\overset{-\!-\!\rightharpoonup}{\vphantom{a}\smash {#1}}} \)
\(\newcommand{\avec}{\mathbf a}\) \(\newcommand{\bvec}{\mathbf b}\) \(\newcommand{\cvec}{\mathbf c}\) \(\newcommand{\dvec}{\mathbf d}\) \(\newcommand{\dtil}{\widetilde{\mathbf d}}\) \(\newcommand{\evec}{\mathbf e}\) \(\newcommand{\fvec}{\mathbf f}\) \(\newcommand{\nvec}{\mathbf n}\) \(\newcommand{\pvec}{\mathbf p}\) \(\newcommand{\qvec}{\mathbf q}\) \(\newcommand{\svec}{\mathbf s}\) \(\newcommand{\tvec}{\mathbf t}\) \(\newcommand{\uvec}{\mathbf u}\) \(\newcommand{\vvec}{\mathbf v}\) \(\newcommand{\wvec}{\mathbf w}\) \(\newcommand{\xvec}{\mathbf x}\) \(\newcommand{\yvec}{\mathbf y}\) \(\newcommand{\zvec}{\mathbf z}\) \(\newcommand{\rvec}{\mathbf r}\) \(\newcommand{\mvec}{\mathbf m}\) \(\newcommand{\zerovec}{\mathbf 0}\) \(\newcommand{\onevec}{\mathbf 1}\) \(\newcommand{\real}{\mathbb R}\) \(\newcommand{\twovec}[2]{\left[\begin{array}{r}#1 \\ #2 \end{array}\right]}\) \(\newcommand{\ctwovec}[2]{\left[\begin{array}{c}#1 \\ #2 \end{array}\right]}\) \(\newcommand{\threevec}[3]{\left[\begin{array}{r}#1 \\ #2 \\ #3 \end{array}\right]}\) \(\newcommand{\cthreevec}[3]{\left[\begin{array}{c}#1 \\ #2 \\ #3 \end{array}\right]}\) \(\newcommand{\fourvec}[4]{\left[\begin{array}{r}#1 \\ #2 \\ #3 \\ #4 \end{array}\right]}\) \(\newcommand{\cfourvec}[4]{\left[\begin{array}{c}#1 \\ #2 \\ #3 \\ #4 \end{array}\right]}\) \(\newcommand{\fivevec}[5]{\left[\begin{array}{r}#1 \\ #2 \\ #3 \\ #4 \\ #5 \\ \end{array}\right]}\) \(\newcommand{\cfivevec}[5]{\left[\begin{array}{c}#1 \\ #2 \\ #3 \\ #4 \\ #5 \\ \end{array}\right]}\) \(\newcommand{\mattwo}[4]{\left[\begin{array}{rr}#1 \amp #2 \\ #3 \amp #4 \\ \end{array}\right]}\) \(\newcommand{\laspan}[1]{\text{Span}\{#1\}}\) \(\newcommand{\bcal}{\cal B}\) \(\newcommand{\ccal}{\cal C}\) \(\newcommand{\scal}{\cal S}\) \(\newcommand{\wcal}{\cal W}\) \(\newcommand{\ecal}{\cal E}\) \(\newcommand{\coords}[2]{\left\{#1\right\}_{#2}}\) \(\newcommand{\gray}[1]{\color{gray}{#1}}\) \(\newcommand{\lgray}[1]{\color{lightgray}{#1}}\) \(\newcommand{\rank}{\operatorname{rank}}\) \(\newcommand{\row}{\text{Row}}\) \(\newcommand{\col}{\text{Col}}\) \(\renewcommand{\row}{\text{Row}}\) \(\newcommand{\nul}{\text{Nul}}\) \(\newcommand{\var}{\text{Var}}\) \(\newcommand{\corr}{\text{corr}}\) \(\newcommand{\len}[1]{\left|#1\right|}\) \(\newcommand{\bbar}{\overline{\bvec}}\) \(\newcommand{\bhat}{\widehat{\bvec}}\) \(\newcommand{\bperp}{\bvec^\perp}\) \(\newcommand{\xhat}{\widehat{\xvec}}\) \(\newcommand{\vhat}{\widehat{\vvec}}\) \(\newcommand{\uhat}{\widehat{\uvec}}\) \(\newcommand{\what}{\widehat{\wvec}}\) \(\newcommand{\Sighat}{\widehat{\Sigma}}\) \(\newcommand{\lt}{<}\) \(\newcommand{\gt}{>}\) \(\newcommand{\amp}{&}\) \(\definecolor{fillinmathshade}{gray}{0.9}\)Lesson
Let's look more closely at data and the questions they can help to answer.
Exercise \(\PageIndex{1}\): Pencils on A Plot
- Measure your pencil to the nearest \(\frac{1}{4}\)-inch. Then, plot your measurement on the class dot plot.
- What is the difference between the longest and shortest pencil lengths in the class?
- What is the most common pencil length?
- Find the difference in lengths between the most common length and the shortest pencil.
Exercise \(\PageIndex{2}\): What's in the Data?
Ten sixth-grade students at a school were each asked five survey questions. Their answers to each question are shown here.
\(\begin{array}{lllllllllll}{\text{data set A}}&{0}&{1}&{1}&{3}&{0}&{0}&{0}&{2}&{1}&{1}\\{\text{data set B}}&{12}&{12}&{12}&{12}&{12}&{12}&{12}&{12}&{12}&{12}\\{\text{data set C}}&{6}&{5}&{7}&{6}&{4}&{5}&{3}&{4}&{6}&{8}\\{\text{data set D}}&{6}&{6}&{6}&{6}&{6}&{6}&{6}&{6}&{6}&{6}\\{\text{data set E}}&{3}&{7}&{9}&{11}&{6}&{4}&{2}&{16}&{6}&{10}\end{array}\)
- Here are the five survey questions. Match each question to a data set that could represent the students’ answers. Explain your reasoning.
- Question 1: Flip a coin 10 times. How many heads did you get?
- Question 2: How many books did you read in the last year?
- Question 3: What grade are you in?
- Question 4: How many dogs and cats do you have?
- Question 5: How many inches are in 1 foot?
- How are survey questions 3 and 5 different from the other questions?
Exercise \(\PageIndex{3}\): What Makes a Statistical Question?
These three questions are examples of statistical questions:
- What is the most common color of the cars in the school parking lot?
- What percentage of students in the school have a cell phone?
- Which kind of literature—fiction or nonfiction—is more popular among students in the school?
These three questions are not examples of statistical questions:
- What color is the principal’s car?
- Does Elena have a cell phone?
- What kind of literature—fiction or nonfiction—does Diego prefer?
- Study the examples and non-examples. Discuss with your partner:
- How are the three statistical questions alike? What do they have in common?
- How are the three non-statistical questions alike? What do they have in common?
- How can you find answers to the statistical questions? How about answers to non-statistical questions?
- What makes a question a statistical question?
Pause here for a class discussion.
- Read each question. Think about the data you might collect to answer it and whether you expect to see variability in the data. Complete each blank with “Yes” or “No.”
- How many cups of water do my classmates drink each day?
- Is variability expected in the data? ______
- Is the question statistical? _____
- Where in town does our math teacher live?
- Is variability expected in the data? ______
- Is the question statistical? _____
- How many minutes does it take students in my class to get ready for school in the morning?
- Is variability expected in the data? ______
- Is the question statistical? _____
- How many minutes of recess do sixth-grade students have each day?
- Is variability expected in the data? ______
- Is the question statistical? _____
- Do all students in my class know what month it is?
- Is variability expected in the data? ______
- Is the question statistical? _____
- How many cups of water do my classmates drink each day?
Exercise \(\PageIndex{4}\): Sifting for Statistical Questions
- Your teacher will give you and your partner a set of cards with questions. Sort them into three piles: Statistical Questions, Not Statistical Questions, and Unsure.
- Compare your sorting decisions with another group of students. Start by discussing the two piles that your group sorted into the Statistical Questions and Not Statistical Questions piles. Then, review the cards in the Unsure pile. Discuss the questions until both groups reach an agreement and have no cards left in the Unsure pile. If you get stuck, think about whether the question could be answered by collecting data and if there would be variability in that data.
- Record the letter names of the questions in each pile.
- Statistical questions:
- Non-statistical questions:
Are you ready for more?
Tyler and Han are discussing the question, “Which sixth-grade student lives the farthest from school?”
- Tyler says, “I don’t think the question is a statistical question. There is only one person who lives the farthest from school, so there would not be variability in the data we collect.”
- Han says: “I think it is a statistical question. To answer the question, we wouldn’t actually be asking everyone, 'Which student lives the farthest from school?' We would have to ask each student how far away from school they live, and we can expect their responses to have variability.”
Do you agree with either one of them? Explain your reasoning.
Summary
We often collect data to answer questions about something. The data we collect may show variability, which means the data values are not all the same.
Some data sets have more variability than others. Here are two sets of figures.
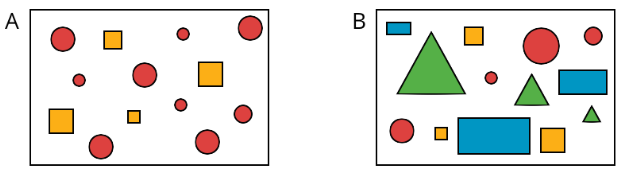
Set A has more figures with the same shape, color, or size. Set B shows more figures with different shapes, colors, or sizes, so set B has greater variability than set A.
Both numerical and categorical data can show variability. Numerical sets can contain different numbers, and categorical sets can contain different categories or types.
When a question can only be answered by using data and we expect that data to have variability, we call it a statistical question. Here are some examples.
- Who is the most popular musical artist at your school?
- When do students in your class typically eat dinner?
- Which classroom in your school has the most books?
To answer the question about books, we may need to count all of the books in each classroom of a school. The data we collect would likely show variability because we would expect each classroom to have a different number of books.
In contrast, the question “How many books are in your classroom?” is not a statistical question. If we collect data to answer the question (for example, by asking everyone in the class to count books), the data can be expected to show the same value. Likewise, if we ask all of the students at a school where they go to school, that question is not a statistical question because the responses will all be the same.
Glossary Entries
Definition: Categorical Data
A set of categorical data has values that are words instead of numbers.
For example, Han asks 5 friends to name their favorite color. Their answers are: blue, blue, green, blue, orange.
Definition: Dot Plot
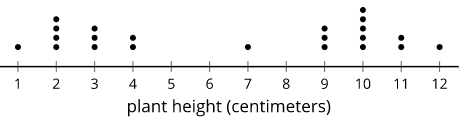
A dot plot is a way to represent data on a number line. Each time a value appears in the data set, we put another dot above that number on the number line.
For example, in this dot plot there are three dots above the 9. This means that three different plants had a height of 9 cm.
Definition: Numerical Data
A set of numerical data has values that are numbers.
For example, Han lists the ages of people in his family: 7, 10, 12, 36, 40, 67.
Definition: Statistical Question
A statistical question can be answered by collecting data that has variability. Here are some examples of statistical questions:
- Who is the most popular musical artist at your school?
- When do students in your class typically eat dinner?
- Which classroom in your school has the most books?
Definition: Variability
Variability means having different values.
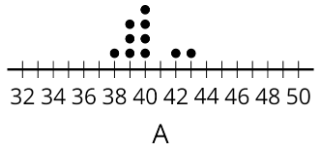
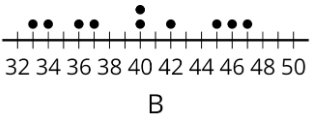
For example, data set B has more variability than data set A. Data set B has many different values, while data set A has more of the same values.
Practice
Exercise \(\PageIndex{5}\)
Sixth-grade students were asked, “What grade are you in?” Explain why this is not a statistical question.
Exercise \(\PageIndex{6}\)
Lin and her friends went out for ice cream after school. The following questions came up during their trip. Select all the questions that are statistical questions.
- How far are we from the ice cream shop?
- What is the most popular ice cream flavor this week?
- What does a group of 4 people typically spend on ice cream at this shop?
- Do kids usually prefer to get a cup or a cone?
- How many toppings are there to choose from?
Exercise \(\PageIndex{7}\)
Here is a list of questions about the students and teachers at a school. Select all the questions that are statistical questions.
- What is the most popular lunch choice?
- What school do these students attend?
- How many math teachers are in the school?
- What is a common age for the teachers at the school?
- About how many hours of sleep do students generally get on a school night?
- How do students usually travel from home to school?
Exercise \(\PageIndex{8}\)
Here is a list of statistical questions. What data would you collect and analyze to answer each question? For numerical data, include the unit of measurement that you would use.
- What is a typical height of female athletes on a team in the most recent international sporting event?
- Are most adults in the school football fans?
- How long do drivers generally need to wait at a red light in Washington, DC?
Exercise \(\PageIndex{9}\)
Describe the scale you would use on the coordinate plane to plot each set of points. What value would you assign to each unit of the grid?
- \((1,-6), (-7,-8), (-3,7), (0,9)\)
- \((-20,-30), (-40,10), (20,-10), (5,-20)\)
- \((\frac{-1}{3},-1), (\frac{2}{3},-1\frac{1}{3}),(\frac{-4}{3},\frac{2}{3}),(\frac{1}{6},0)\)
(From Unit 7.3.3)
Exercise \(\PageIndex{10}\)
Noah’s water bottle contains more than 1 quart of water but less than \(1\frac{1}{2}\) quarts. Let \(w\) be the amount of water in Noah’s bottle, in quarts. Select all the true statements.
- \(w\) could be \(\frac{3}{4}\).
- \(w\) could be \(1\).
- \(w>1\)
- \(w\) could be \(\frac{4}{3}\).
- \(w\) could be \(\frac{5}{4}\).
- \(w\) could be \(\frac{5}{3}\).
- \(w>1.5\)
(From Unit 7.2.2)
Exercise \(\PageIndex{11}\)
Order these numbers from least to greatest:
\(|-17|\qquad |-18|\qquad -18\qquad |19|\qquad 20\)
(From Unit 7.1.7)