
43.4: Using Mean and MAD to Make Comparisons
- Page ID
- 40875
\( \newcommand{\vecs}[1]{\overset { \scriptstyle \rightharpoonup} {\mathbf{#1}} } \)
\( \newcommand{\vecd}[1]{\overset{-\!-\!\rightharpoonup}{\vphantom{a}\smash {#1}}} \)
\( \newcommand{\dsum}{\displaystyle\sum\limits} \)
\( \newcommand{\dint}{\displaystyle\int\limits} \)
\( \newcommand{\dlim}{\displaystyle\lim\limits} \)
\( \newcommand{\id}{\mathrm{id}}\) \( \newcommand{\Span}{\mathrm{span}}\)
( \newcommand{\kernel}{\mathrm{null}\,}\) \( \newcommand{\range}{\mathrm{range}\,}\)
\( \newcommand{\RealPart}{\mathrm{Re}}\) \( \newcommand{\ImaginaryPart}{\mathrm{Im}}\)
\( \newcommand{\Argument}{\mathrm{Arg}}\) \( \newcommand{\norm}[1]{\| #1 \|}\)
\( \newcommand{\inner}[2]{\langle #1, #2 \rangle}\)
\( \newcommand{\Span}{\mathrm{span}}\)
\( \newcommand{\id}{\mathrm{id}}\)
\( \newcommand{\Span}{\mathrm{span}}\)
\( \newcommand{\kernel}{\mathrm{null}\,}\)
\( \newcommand{\range}{\mathrm{range}\,}\)
\( \newcommand{\RealPart}{\mathrm{Re}}\)
\( \newcommand{\ImaginaryPart}{\mathrm{Im}}\)
\( \newcommand{\Argument}{\mathrm{Arg}}\)
\( \newcommand{\norm}[1]{\| #1 \|}\)
\( \newcommand{\inner}[2]{\langle #1, #2 \rangle}\)
\( \newcommand{\Span}{\mathrm{span}}\) \( \newcommand{\AA}{\unicode[.8,0]{x212B}}\)
\( \newcommand{\vectorA}[1]{\vec{#1}} % arrow\)
\( \newcommand{\vectorAt}[1]{\vec{\text{#1}}} % arrow\)
\( \newcommand{\vectorB}[1]{\overset { \scriptstyle \rightharpoonup} {\mathbf{#1}} } \)
\( \newcommand{\vectorC}[1]{\textbf{#1}} \)
\( \newcommand{\vectorD}[1]{\overrightarrow{#1}} \)
\( \newcommand{\vectorDt}[1]{\overrightarrow{\text{#1}}} \)
\( \newcommand{\vectE}[1]{\overset{-\!-\!\rightharpoonup}{\vphantom{a}\smash{\mathbf {#1}}}} \)
\( \newcommand{\vecs}[1]{\overset { \scriptstyle \rightharpoonup} {\mathbf{#1}} } \)
\(\newcommand{\longvect}{\overrightarrow}\)
\( \newcommand{\vecd}[1]{\overset{-\!-\!\rightharpoonup}{\vphantom{a}\smash {#1}}} \)
\(\newcommand{\avec}{\mathbf a}\) \(\newcommand{\bvec}{\mathbf b}\) \(\newcommand{\cvec}{\mathbf c}\) \(\newcommand{\dvec}{\mathbf d}\) \(\newcommand{\dtil}{\widetilde{\mathbf d}}\) \(\newcommand{\evec}{\mathbf e}\) \(\newcommand{\fvec}{\mathbf f}\) \(\newcommand{\nvec}{\mathbf n}\) \(\newcommand{\pvec}{\mathbf p}\) \(\newcommand{\qvec}{\mathbf q}\) \(\newcommand{\svec}{\mathbf s}\) \(\newcommand{\tvec}{\mathbf t}\) \(\newcommand{\uvec}{\mathbf u}\) \(\newcommand{\vvec}{\mathbf v}\) \(\newcommand{\wvec}{\mathbf w}\) \(\newcommand{\xvec}{\mathbf x}\) \(\newcommand{\yvec}{\mathbf y}\) \(\newcommand{\zvec}{\mathbf z}\) \(\newcommand{\rvec}{\mathbf r}\) \(\newcommand{\mvec}{\mathbf m}\) \(\newcommand{\zerovec}{\mathbf 0}\) \(\newcommand{\onevec}{\mathbf 1}\) \(\newcommand{\real}{\mathbb R}\) \(\newcommand{\twovec}[2]{\left[\begin{array}{r}#1 \\ #2 \end{array}\right]}\) \(\newcommand{\ctwovec}[2]{\left[\begin{array}{c}#1 \\ #2 \end{array}\right]}\) \(\newcommand{\threevec}[3]{\left[\begin{array}{r}#1 \\ #2 \\ #3 \end{array}\right]}\) \(\newcommand{\cthreevec}[3]{\left[\begin{array}{c}#1 \\ #2 \\ #3 \end{array}\right]}\) \(\newcommand{\fourvec}[4]{\left[\begin{array}{r}#1 \\ #2 \\ #3 \\ #4 \end{array}\right]}\) \(\newcommand{\cfourvec}[4]{\left[\begin{array}{c}#1 \\ #2 \\ #3 \\ #4 \end{array}\right]}\) \(\newcommand{\fivevec}[5]{\left[\begin{array}{r}#1 \\ #2 \\ #3 \\ #4 \\ #5 \\ \end{array}\right]}\) \(\newcommand{\cfivevec}[5]{\left[\begin{array}{c}#1 \\ #2 \\ #3 \\ #4 \\ #5 \\ \end{array}\right]}\) \(\newcommand{\mattwo}[4]{\left[\begin{array}{rr}#1 \amp #2 \\ #3 \amp #4 \\ \end{array}\right]}\) \(\newcommand{\laspan}[1]{\text{Span}\{#1\}}\) \(\newcommand{\bcal}{\cal B}\) \(\newcommand{\ccal}{\cal C}\) \(\newcommand{\scal}{\cal S}\) \(\newcommand{\wcal}{\cal W}\) \(\newcommand{\ecal}{\cal E}\) \(\newcommand{\coords}[2]{\left\{#1\right\}_{#2}}\) \(\newcommand{\gray}[1]{\color{gray}{#1}}\) \(\newcommand{\lgray}[1]{\color{lightgray}{#1}}\) \(\newcommand{\rank}{\operatorname{rank}}\) \(\newcommand{\row}{\text{Row}}\) \(\newcommand{\col}{\text{Col}}\) \(\renewcommand{\row}{\text{Row}}\) \(\newcommand{\nul}{\text{Nul}}\) \(\newcommand{\var}{\text{Var}}\) \(\newcommand{\corr}{\text{corr}}\) \(\newcommand{\len}[1]{\left|#1\right|}\) \(\newcommand{\bbar}{\overline{\bvec}}\) \(\newcommand{\bhat}{\widehat{\bvec}}\) \(\newcommand{\bperp}{\bvec^\perp}\) \(\newcommand{\xhat}{\widehat{\xvec}}\) \(\newcommand{\vhat}{\widehat{\vvec}}\) \(\newcommand{\uhat}{\widehat{\uvec}}\) \(\newcommand{\what}{\widehat{\wvec}}\) \(\newcommand{\Sighat}{\widehat{\Sigma}}\) \(\newcommand{\lt}{<}\) \(\newcommand{\gt}{>}\) \(\newcommand{\amp}{&}\) \(\definecolor{fillinmathshade}{gray}{0.9}\)Lesson
Let's use mean and MAD to describe and compare distributions.
Exercise \(\PageIndex{1}\): Number Talk: Decimal Division
Find the value of each expression mentally.
\(42\div 12\)
\(2.4\div 12\)
\(44.4\div 12\)
\(46.8\div 12\)
Exercise \(\PageIndex{2}\): Which Player Would You Choose?
- Andre and Noah joined Elena, Jada, and Lin in recording their basketball scores. They all recorded their scores in the same way: the number of baskets made out of 10 attempts. Each collected 12 data points.
- Andre’s mean number of baskets was 5.25, and his MAD was 2.6.
- Noah’s mean number of baskets was also 5.25, but his MAD was 1.
Here are two dot plots that represent the two data sets. The triangle indicates the location of the mean.

- Without calculating, decide which dot plot represents Andre’s data and which represents Noah’s. Explain how you know.
- If you were the captain of a basketball team and could use one more player on your team, would you choose Andre or Noah? Explain your reasoning.
- An eighth-grade student decided to join Andre and Noah and kept track of his scores. His data set is shown here. The mean number of baskets he made is 6.
| eighth-grade student | \(6\) | \(5\) | \(4\) | \(7\) | \(6\) | \(5\) | \(7\) | \(8\) | \(5\) | \(6\) | \(5\) | \(8\) |
|---|---|---|---|---|---|---|---|---|---|---|---|---|
| distance from \(6\) |
- Calculate the MAD. Show your reasoning.
- Draw a dot plot to represent his data and mark the location of the mean with a triangle (\(\Delta\)).
- Compare the eighth-grade student’s mean and MAD to Noah’s mean and MAD. What do you notice?
- Compare their dot plots. What do you notice about the distributions?
- What can you say about the two players’ shooting accuracy and consistency?
Are you ready for more?
Invent a data set with a mean of 7 and a MAD of 1.
Exercise \(\PageIndex{3}\): Swimmers Over the Years
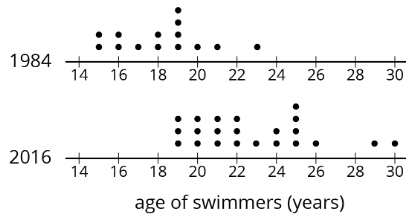
In 1984, the mean age of swimmers on the U.S. women’s swimming team was 18.2 years and the MAD was 2.2 years. In 2016, the mean age of the swimmers was 22.8 years, and the MAD was 3 years.
- How has the average age of the women on the U.S. swimming team changed from 1984 to 2016? Explain your reasoning.
- Are the swimmers on the 1984 team closer in age to one another than the swimmers on the 2016 team are to one another? Explain your reasoning.
- Here are dot plots showing the ages of the women on the U.S. swimming team in 1984 and in 2016. Use them to make two other comments about how the women’s swimming team has changed over the years.
Summary
Sometimes two distributions have different means but the same MAD.
Pugs and beagles are two different dog breeds. The dot plot shows two sets of weight data—one for pugs and the other for beagles.
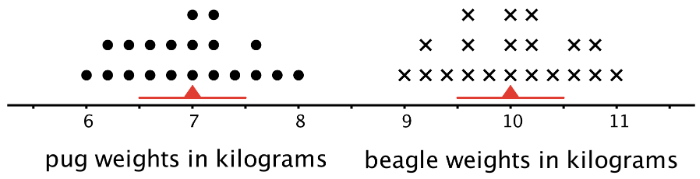
- The mean weight for pugs is 7 kilograms, and the MAD is 0.5 kilogram.
- The mean weight for beagles is 10 kilograms, and the MAD is 0.5 kilogram.
We can say that, in general, the beagles are heavier than the pugs. A typical weight for the beagles in this group is about 3 kilograms heavier than a typical weight for the pugs.
The variability of pug weights, however, is about the same as the variability of beagle weights. In other words, the weights of pugs and the weights of beagles are equally spread out.
Glossary Entries
Definition: Average
The average is another name for the mean of a data set.
For the data set 3, 5, 6, 8, 11, 12, the average is 7.5.
\(3+5+6+8+11+12=45\)
\(45\div 6=7.5\)
Definition: Mean
The mean is one way to measure the center of a data set. We can think of it as a balance point. For example, for the data set 7, 9, 12, 13, 14, the mean is 11.
To find the mean, add up all the numbers in the data set. Then, divide by how many numbers there are. \(7+9+12+13+14=55\) and \(55\div 5=11\).
Definition: Mean Absolute Deviation (MAD)
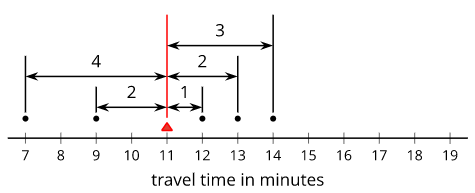
The mean absolute deviation is one way to measure how spread out a data set is. Sometimes we call this the MAD. For example, for the data set 7, 9, 12, 13, 14, the MAD is 2.4. This tells us that these travel times are typically 2.4 minutes away from the mean, which is 11.
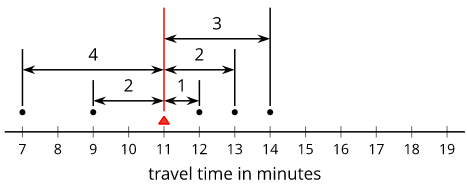
To find the MAD, add up the distance between each data point and the mean. Then, divide by how many numbers there are.
\(4+2+1+2+3=12\) and \(12\div 5=2.4\)
Definition: Measure of Center
A measure of center is a value that seems typical for a data distribution.
Mean and median are both measures of center.
Practice
Exercise \(\PageIndex{4}\)
The dot plots show the amounts of time that ten U.S. students and ten Australian students took to get to school.
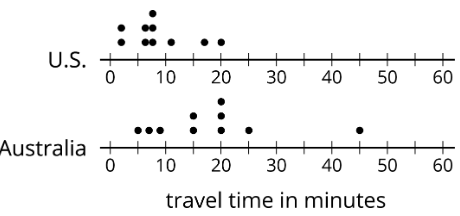
Which statement is true about the MAD of the Australian data set?
- It is significantly less than the MAD of the U.S. data set.
- It is exactly equal to the MAD of the U.S. data set.
- It is approximately equal to the MAD of the U.S. data set.
- It is significantly greater than the MAD of the U.S. data set.
Exercise \(\PageIndex{5}\)
The dot plots show the amounts of time that ten South African students and ten Australian students took to get to school. Without calculating, answer the questions.
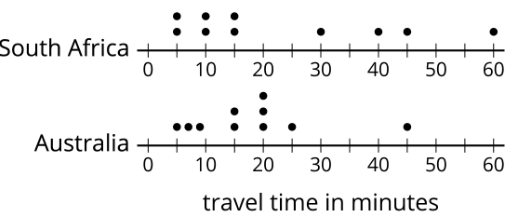
- Which data set has the smaller mean? Explain your reasoning.
- Which data set has the smaller MAD? Explain your reasoning.
- What does a smaller mean tell us in this context?
- What does a smaller MAD tell us in this context?
Exercise \(\PageIndex{6}\)
Two high school basketball teams have identical records of 15 wins and 2 losses. Sunnyside High School's mean score is 50 points and its MAD is 4 points. Shadyside High School's mean score is 60 points and its MAD is 15 points.
Lin read the records of each team’s score. She likes the team that had nearly the same score for every game it played. Which team do you think Lin likes? Explain your reasoning.
Exercise \(\PageIndex{7}\)
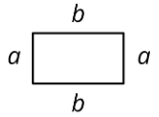
Jada thinks the perimeter of this rectangle can be represented with the expression \(a+a+b+b\). Andre thinks it can be represented with \(2a+2b\). Do you agree with either of them? Explain your reasoning.
(From Unit 6.2.3)
Exercise \(\PageIndex{8}\)
Draw a number line.
- Plot and label three numbers between -2 and -8 (not including -2 and -8).
- Use the numbers you plotted and the symbols \(<\) and \(>\) to write three inequality statements.
(From Unit 7.1.3)
Exercise \(\PageIndex{9}\)
Adult elephant seals generally weigh about 5,500 pounds. If you weighed 5 elephant seals, would you expect each seal to weigh exactly 5,500 pounds? Explain your reasoning.
(From Unit 8.1.2)