
28.3: Using Diagrams to Represent Multiplication
- Page ID
- 40303
Lesson
Let's use area diagrams to find products.
Exercise \(\PageIndex{1}\): Estimate the Product
For each of the following products, choose the best estimate of its value. Be prepared to explain your reasoning.
- \((6.8)\cdot (2.3)\)
- \(1.40\)
- \(14\)
- \(140\)
- \(74\cdot (8.1)\)
- \(5.6\)
- \(56\)
- \(560\)
- \(166\cdot (0.09)\)
- \(1.66\)
- \(16.6\)
- \(166\)
- \((3.4)\cdot (1.9)\)
- \(6.5\)
- \(65\)
- \(650\)
Exercise \(\PageIndex{2}\): Connecting Area Diagrams to Calculations with Whole Numbers
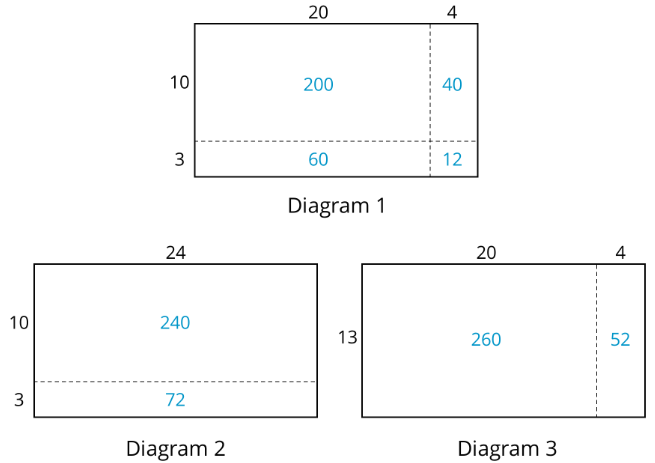
- Here are three ways of finding the area of a rectangle that is \(24\) units by \(13\) units.
Discuss with your partner:
- What do the diagrams have in common? How are they alike?
- How are they different?
- If you were to find the area of a rectangle that is 37 units by 19 units, which of the three ways of decomposing the rectangle would you use? Why?
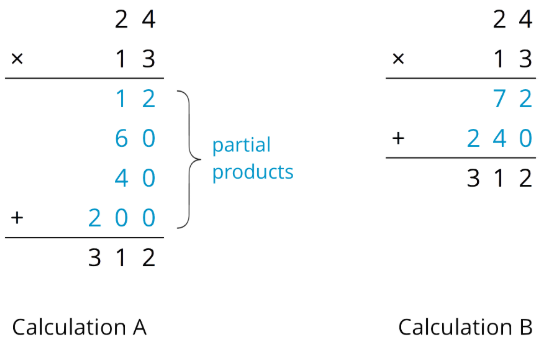
- You may be familiar with different ways to write multiplication calculations. Here are two ways to calculate 24 times 13.
Discuss with your partner:
- In Calculation A, how are each of the partial products obtained? For instance, where does the 12 come from?
- In Calculation B, how are the 72 and 240 obtained?
- Look at the diagrams in the first question. Which diagram corresponds to Calculation A? Which one corresponds to Calculation B?
- How are the partial products in Calculation A and the 72 and 240 in Calculation B related to the numbers in the diagrams?
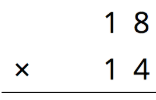
- Use the two following methods to find the product of 18 and 14, then compare the values obtained.
- Calculate numerically.
- Here is a rectangle that is 18 units by 14 units. Find its area, in square units by decomposing it. Show your reasoning.
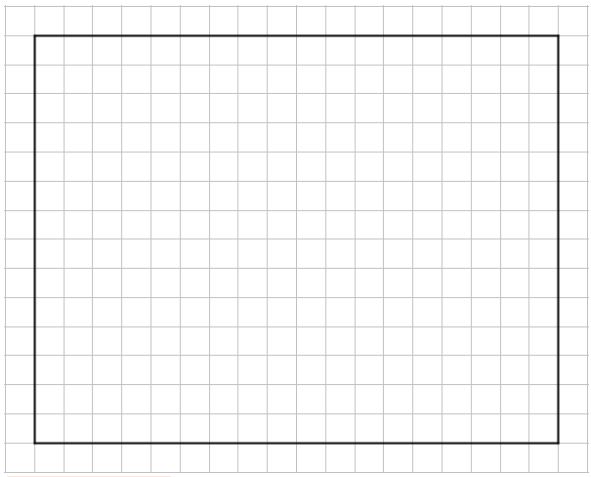
- Compare the values of \(18\cdot 14\) that you obtained using the two methods. If they are not the same, check your work.
- Use the applet to verify your answers and explore your own scenarios. To adjust the values, move the dots on the ends of the segments.
Exercise \(\PageIndex{3}\): Connecting Area Diagrams to Calculations with Decimals
- You can use area diagrams to represent products of decimals. Here is an area diagram that represents \((2.4)\cdot (1.3)\).
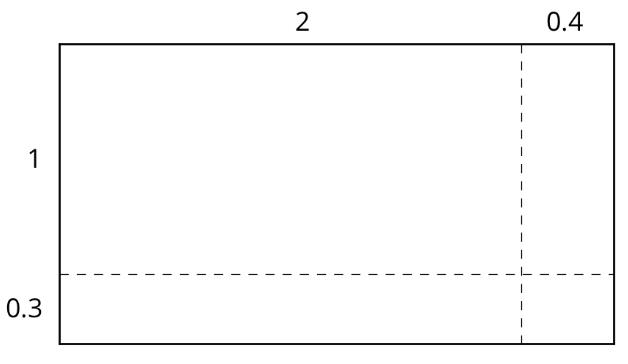
- Find the region that represents \((0.4)\cdot (0.3)\)? Label that region with its area of \(0.12\).
- Label each of the other regions with their respective areas.
- Find the value of \((2.4)\cdot (1.3)\). Show your reasoning.
- Here are two ways of calculating \(2.4\) times \(1.3\).
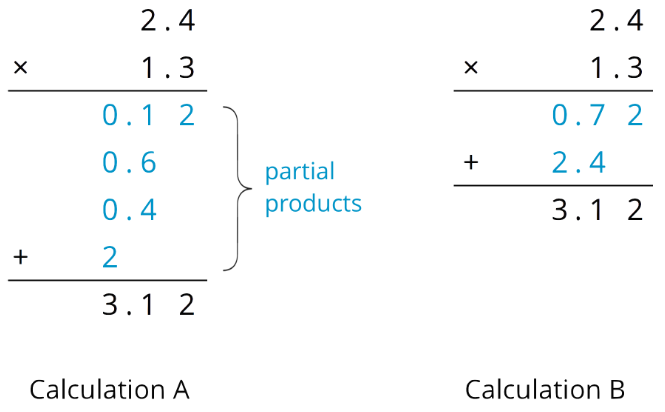
Analyze the calculations and discuss with a partner:
- In Calculation A, where does the 0.12 and other partial products come from? In Calculation B, where do the 0.72 and 2.4 come from? How are the other numbers in blue calculated?
- In each calculation, why are the numbers in blue lined up vertically the way they are?
- Find the product of \((3.1)\cdot (1.5)\) by drawing and labeling an area diagram. Show your reasoning.
- Show how to calculate \((3.1)\cdot (1.5)\) using numbers without a diagram. Be prepared to explain your reasoning. If you are stuck, use the examples in a previous question to help you.
- Use the applet to verify your answers and explore your own scenarios. To adjust the values, move the dots on the ends of the segments.
Are you ready for more?
How many hectares is the property of your school? How many morgens is that?
Exercise \(\PageIndex{4}\): Using the Partial Products Method
- Label the area diagram to represent \((2.5)\cdot (1.2)\) and to find that product.
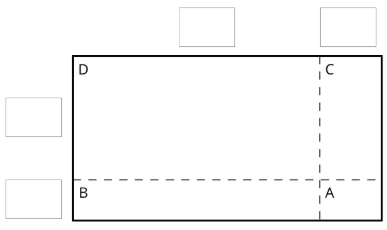
- Decompose each number into its base-ten units (ones, tenths, etc.) and write them in the boxes on each side of the rectangle.
- Label Regions A, B, C, and D with their areas. Show your reasoning.
- Find the product that the area diagram represents. Show your reasoning.
- Here are two ways to calculate \((2.5)\cdot (1.2)\). Each number with a box gives the area of one or more regions in the area diagram.
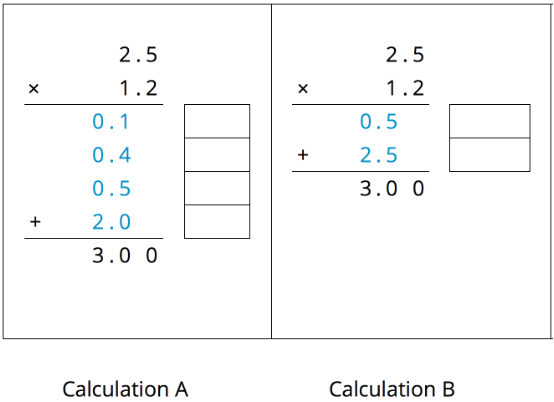
- In the boxes next to each number, write the letter(s) of the corresponding region(s).
- In Calculation B, which two numbers are being multiplied to obtain 0.5?
Which numbers are being multiplied to obtain 2.5?
Summary
Suppose that we want to calculate the product of two numbers that are written in base ten. To explain how, we can use what we know about base-ten numbers and areas of rectangles.
Here is a diagram of a rectangle with side lengths 3.4 units and 1.2 units.
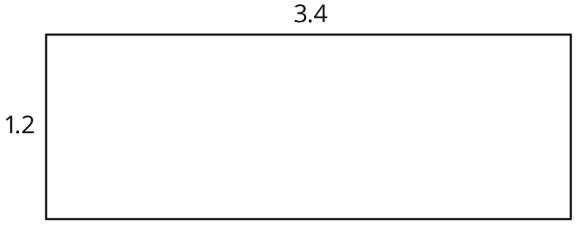
Its area, in square units, is the product
\((3.4)\cdot (1.2)\)
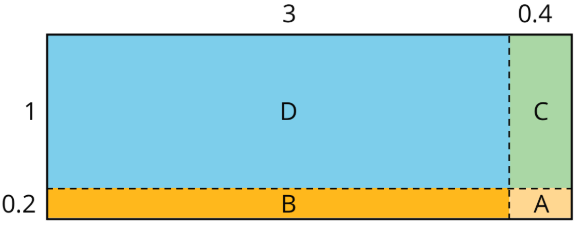
To calculate this product and find the area of the rectangle, we can decompose each side length into its base-ten units, \(3.4=3+0.4\) and \(1.2=1+0.2\), decomposing the rectangle into four smaller sub-rectangles.
We can rewrite the product and expand it twice:
\(\begin{aligned} (3.4)\cdot (1.2)&=(3+0.4)\cdot (1+0.2) \\ &= (3+0.4)\cdot 1+(3+0.4)\cdot 0.2 \\ &=3\cdot 1+3\cdot (0.2)+(0.4)\cdot 1+(0.4)\cdot (0.2)\end{aligned}\)
In the last expression, each of the four terms is called a partial product. Each partial product gives the area of a sub-rectangle in the diagram. The sum of the four partial products gives the area of the entire rectangle.
We can show the horizontal calculations above as two vertical calculations.
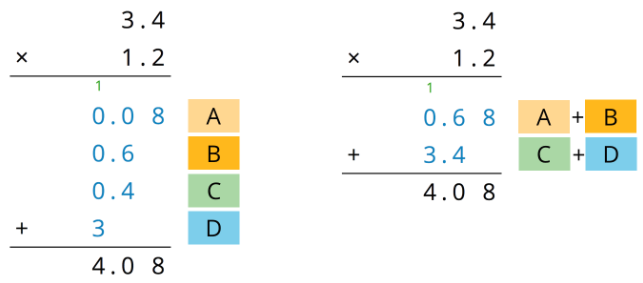
The calculation on the left is an example of the partial products method. It shows the values of each partial product and the letter of the corresponding sub-rectangle. Each partial product gives an area:
- A is 0.2 unit by 0.4 unit, so its area is 0.08 square unit.
- B is 3 unit by 0.2 unit, so its area is 0.6 square unit.
- C is 0.4 unit by 1 unit, so its area is 0.4 square unit.
- D is 3 units by 1 unit, so its area is 3 square units.
- The sum of the partial products is \(0.08+0.6+0.4+3\), so the area of the rectangle is 4.08 square units.
The calculation on the right shows the values of two products. Each value gives a combined area of two sub-rectangles:
- The combined regions of A and B have an area of 0.68 square units; 0.68 is the value of \((3+0.4)\cdot 0.2\).
- The combined regions of C and D have an area of 3.4 square units; 3.4 is the value of \((3+0.4)\cdot 1\).
- The sum of the values of two products is \(0.68+3.4\), so the area of the rectangle is 4.08 square units.
Practice
Exercise \(\PageIndex{5}\)
Here is a rectangle that has been partitioned into four smaller rectangles.
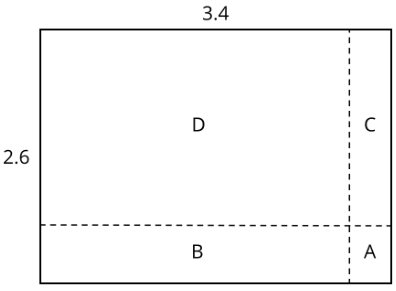
For each expression, choose the sub-rectangle whose area, in square units, matches the expression.
- \(3\cdot (0.6)\)
- \((0.4)\cdot 2\)
- \((0.4)\cdot (0.6)\)
- \(3\cdot 2\)
Exercise \(\PageIndex{6}\)
Here is an area diagram that represents \((3.1)\cdot (1.4)\).
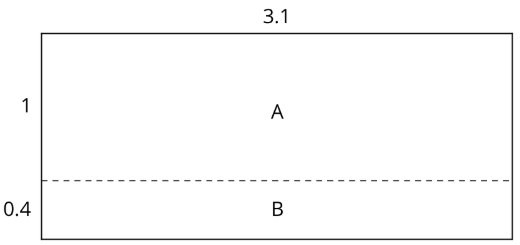
- Find the areas of sub-rectangles A and B.
- What is the area of the 3.1 by 1.4 rectangle?
Exercise \(\PageIndex{7}\)
Draw an area diagram to find \((0.36)\cdot (0.53)\). Label and organize your work so that it can be followed by others.
Exercise \(\PageIndex{8}\)
Find each product. Show your reasoning.
- \((2.5)\cdot (1.4)\)
- \((0.64)\cdot (0.81)\)
Exercise \(\PageIndex{9}\)
Complete the calculations so that each shows the correct sum.
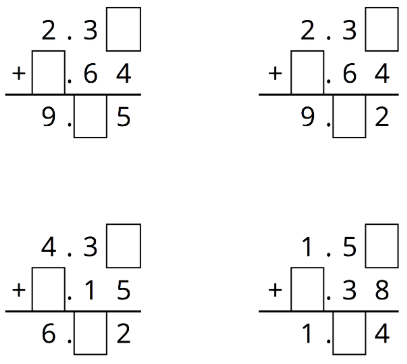
(From Unit 5.2.2)
Exercise \(\PageIndex{10}\)
Diego bought 12 mini muffins for $4.20.
- At this rate, how much would Diego pay for 4 mini muffins?
- How many mini muffins could Diego buy with $3.00? Explain or show your reasoning. If you get stuck, consider using the table.
| number of mini muffins | price in dollars |
|---|---|
| \(12\) | \(4.20\) |
(From Unit 2.4.2)