
34.3: More Relationships
- Page ID
- 40618
Lesson
Let's use graphs and equations to show relationships involving area, volume, and exponents.
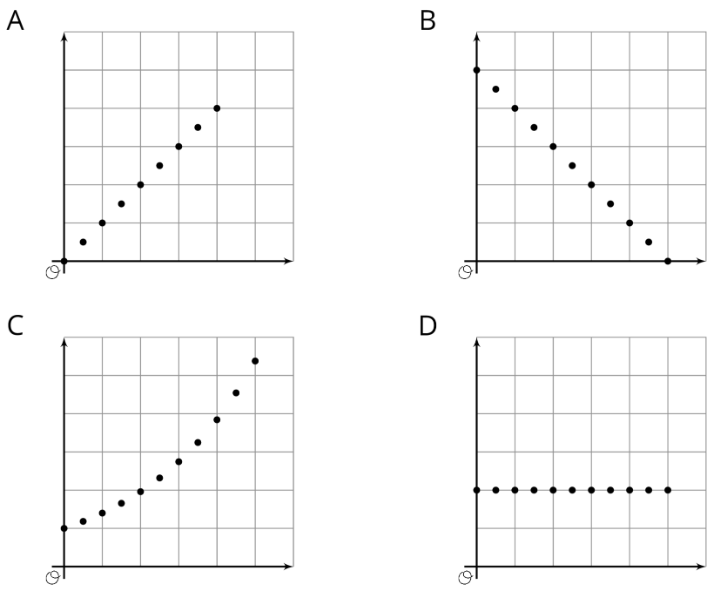
Exercise \(\PageIndex{1}\): Which One Doesn't Belong: Graphs
Which one doesn’t belong?
Exercise \(\PageIndex{2}\): Making a Banner
Mai is creating a rectangular banner to advertise the school play. The material for the banner is sold by the square foot. Mai has enough money to buy 36 square feet of material. She is trying to decide on the length and width of the banner.
- If the length is 6 feet, what is the width?
- If the length is 4 feet, what is the width?
- If the length is 9 feet, what is the width?
- To find different combinations of length and width that give an area of 36 square feet, Mai uses the equation \(w=\frac{36}{l}\), where \(w\) is the width and \(l\) is the length. Compare your strategy and Mai's method for finding the width. How were they alike or different?
- Use several combinations of length and width to create a graph that shows the relationship between the side lengths of various rectangles with area 36 square feet.
- Explain how the graph describes the relationship between length and width for different rectangles with area 36.
- Suppose Mai used the equation \(l=\frac{36}{w}\) to find the length for different values of the width. Would the graph be different if she graphed length on the vertical axis and width on the horizontal axis? Explain how you know.
Exercise \(\PageIndex{3}\): Cereal Boxes
A cereal manufacturer needs to design a cereal box that has a volume of 225 cubic inches and a height that is no more than 15 inches.
- The designers know that the volume of a rectangular prism can be calculated by multiplying the area of its base and its height. Complete the table with pairs of values that will make the volume 225 in3.
height (in) \(5\) \(9\) \(12\) \(7\frac{1}{2}\) area of base (in\(^{2}\)) \(75\) \(15\) Table \(\PageIndex{1}\) - Describe how you found the missing values for the table.
- Write an equation that shows how the area of the base, \(A\), is affected by changes in the height, \(h\), for different rectangular prisms with volume 225 in3.
- Plot the ordered pairs from the table on the graph to show the relationship between the area of the base and the height for different boxes box with volume 225 in3.
Exercise \(\PageIndex{4}\): Multiplying Mosquitoes
A researcher who is studying mosquito populations collects the following data:
| day in the study (\(d\)) | number of mosquitoes (\(n\)) |
|---|---|
| \(1\) | \(2\) |
| \(2\) | \(4\) |
| \(3\) | \(8\) |
| \(4\) | \(16\) |
| \(5\) | \(32\) |
- The researcher said that, for these five days, the number of mosquitoes, \(n\), can be found with the equation \(n=2^{d}\) where \(d\) is the day in the study. Explain why this equation matches the data.
- Use the ordered pairs in the table to graph the relationship between number of mosquitoes and day in the study for these five days.
- Describe the graph. Compare how the data, equation, and graph illustrate the relationship between the day in the study and the number of mosquitoes.
- If the pattern continues, how many mosquitoes will there be on day 6?
Summary
Equations can represent relationships between geometric quantities. For instance:
- If \(s\) is the side length of a square, then the area \(A\) is related to \(s\) by \(A=s^{2}\).
- Sometimes the relationships are more specific. For example, the perimeter \(P\) of a rectangle with length \(l\) and width \(w\) is \(P=2l+2\). If we consider only rectangles with a length of 10, then the relationship between the perimeter and the width is \(P=20+2w\).
Here is another example of an equation with exponent expressing the relationship between quantities:
- A super ball is dropped from 10 feet. On each successive bounce, it only goes as high as on the previous bounce.
This means that on the first bounce, the ball will bounce 5 feet high, and then on the second bounce it will only go \(2\frac{1}{2}\) feet high, and so on. We can represent this situation with an equation to find how high the super ball will bounce after any number of bounces.
To find how high the super ball bounces on the \(n^{\text{th}}\) bounce, we have to multiply 10 feet (the initial height) by \(\frac{1}{2}\) and multiply by \(\frac{1}{2}\) again for each bounce thereafter; we need to do this \(n\) times. So the height, \(h\), of the ball on the \(n^{\text{th}}\) bounce will be \(h=10\left(\frac{1}{2}\right)^{n}\). In this equation, the dependent variable, \(h\), is affected by changes in the independent variable, \(n\).
Equations and graphs can give us insight into different kinds of relationships between quantities and help us answer questions and solve problems.
Glossary Entries
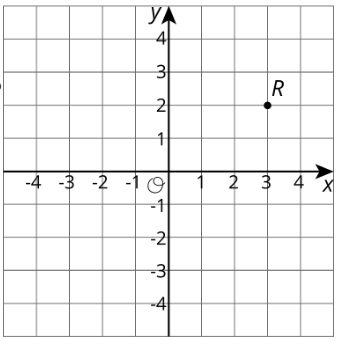
Definition: Coordinate Plane
The coordinate plane is a system for telling where points are. For example. point \(R\) is located at \((3,2)\) on the coordinate plane, because it is three units to the right and two units up.
Definition: Dependent Variable
The dependent variable is the result of a calculation.
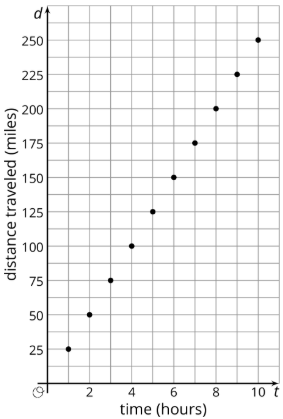
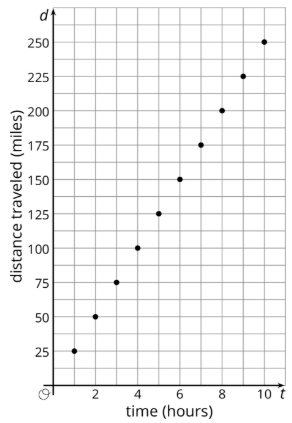
For example, a boat travels at a constant speed of 25 miles per hour. The equation \(d=25t\) describes the relationship between the boat's distance and time. The dependent variable is the distance traveled, because \(d\) is the result of multiplying 25 by \(t\).
Definition: Independent Variable
The independent variable is used to calculate the value of another variable.
For example, a boat travels at a constant speed of 25 miles per hour. The equation \(d=25t\) describes the relationship between the boat's distance and time. The independent variable is time, because \(t\) is multiplied by 25 to get \(d\).
Practice
Exercise \(\PageIndex{5}\)
Elena is designing a logo in the shape of a parallelogram. She wants the logo to have an area of 12 square inches. She draws bases of different lengths and tries to compute the height for each.
- Write an equation Elena can use to find the height, \(h\), for each value of the base, \(b\).
- Use your equation to find the height of a parallelogram with base \(1.5\) inches.
Exercise \(\PageIndex{6}\)
Han is planning to ride his bike 24 miles.
- How long will it take if he rides at a rate of:
3 miles per hour?
4 miles per hour?
6 miles per hour? - Write an equation that Han can use to find \(t\), the time it will take to ride 24 miles, if his rate in miles per hour is represented by \(r\).
- On graph paper, draw a graph that shows \(t\) in terms of \(r\) for a 24-mile ride.
Exercise \(\PageIndex{7}\)
The graph of the equation \(V=10s^{3}\) contains the points \((2,80)\) and \((4, 640)\).
- Create a story that is represented by this graph.
- What do the points mean in the context of your story?
Exercise \(\PageIndex{8}\)
You find a brass bottle that looks really old. When you rub some dirt off of the bottle, a genie appears! The genie offers you a reward. You must choose one:
$50,000 or a magical $1 coin.
The coin will turn into two coins on the first day. The two coins will turn into four coins on the second day. The four coins will double to 8 coins on the third day. The genie explains the doubling will continue for 28 days.
- Write an equation that shows the number of coins, \(n\), in terms of the day, \(d\).
- Create a table that shows the number of coins for each day for the first 15 days.
- Create a graph for days 7 through 12 that shows how the number of coins grows with each day.
Exercise \(\PageIndex{9}\)
At a market, 3.1 pounds of peaches cost $7.72. How much did the peaches cost per pound? Explain or show your reasoning. Round your answer to the nearest cent.
(From Unit 5.4.5)
Exercise \(\PageIndex{10}\)
Andre set up a lemonade stand last weekend. It cost him $0.15 to make each cup of lemonade, and he sold each cup for $0.35.
- If Andre collects $9.80, how many cups did he sell?
- How much money did it cost Andre to make this amount of lemonade?
- How much money did Andre make in profit?
(From Unit 5.4.5)