
2.7: Exercises
- Page ID
- 121092

\( \newcommand{\vecs}[1]{\overset { \scriptstyle \rightharpoonup} {\mathbf{#1}} } \)
\( \newcommand{\vecd}[1]{\overset{-\!-\!\rightharpoonup}{\vphantom{a}\smash {#1}}} \)
\( \newcommand{\id}{\mathrm{id}}\) \( \newcommand{\Span}{\mathrm{span}}\)
( \newcommand{\kernel}{\mathrm{null}\,}\) \( \newcommand{\range}{\mathrm{range}\,}\)
\( \newcommand{\RealPart}{\mathrm{Re}}\) \( \newcommand{\ImaginaryPart}{\mathrm{Im}}\)
\( \newcommand{\Argument}{\mathrm{Arg}}\) \( \newcommand{\norm}[1]{\| #1 \|}\)
\( \newcommand{\inner}[2]{\langle #1, #2 \rangle}\)
\( \newcommand{\Span}{\mathrm{span}}\)
\( \newcommand{\id}{\mathrm{id}}\)
\( \newcommand{\Span}{\mathrm{span}}\)
\( \newcommand{\kernel}{\mathrm{null}\,}\)
\( \newcommand{\range}{\mathrm{range}\,}\)
\( \newcommand{\RealPart}{\mathrm{Re}}\)
\( \newcommand{\ImaginaryPart}{\mathrm{Im}}\)
\( \newcommand{\Argument}{\mathrm{Arg}}\)
\( \newcommand{\norm}[1]{\| #1 \|}\)
\( \newcommand{\inner}[2]{\langle #1, #2 \rangle}\)
\( \newcommand{\Span}{\mathrm{span}}\) \( \newcommand{\AA}{\unicode[.8,0]{x212B}}\)
\( \newcommand{\vectorA}[1]{\vec{#1}} % arrow\)
\( \newcommand{\vectorAt}[1]{\vec{\text{#1}}} % arrow\)
\( \newcommand{\vectorB}[1]{\overset { \scriptstyle \rightharpoonup} {\mathbf{#1}} } \)
\( \newcommand{\vectorC}[1]{\textbf{#1}} \)
\( \newcommand{\vectorD}[1]{\overrightarrow{#1}} \)
\( \newcommand{\vectorDt}[1]{\overrightarrow{\text{#1}}} \)
\( \newcommand{\vectE}[1]{\overset{-\!-\!\rightharpoonup}{\vphantom{a}\smash{\mathbf {#1}}}} \)
\( \newcommand{\vecs}[1]{\overset { \scriptstyle \rightharpoonup} {\mathbf{#1}} } \)
\( \newcommand{\vecd}[1]{\overset{-\!-\!\rightharpoonup}{\vphantom{a}\smash {#1}}} \)
2.1. Heating milk. Consider the data gathered for heating milk in Table \(2.1\) and Figure \(2.2\) (left)
(a) Estimate the slope and intercept of the straight line shown in the figure and use to write the equation of this line. According to this approximate straight line relationship, what is the average rate of change of the temperature over the \(5 \mathrm{~min}\) interval shown?
(b) Find a pair of points such that the average rate of change of the temperature is smaller than your result in part (a).
(c) Find a pair of points such that the average rate of change of the temperature is greater than your result in part (a).
(d) Milk boils at \(212^{\circ} \mathrm{F}\), and the recipe for yoghurt calls for avoiding a temperature this high. Use your common knowledge to explain why the data for heating milk is not actually linear.
2.2. Refining the data. Table \(2.4\) shows some of the data for cooling milk that was collected and plotted in Figure 2.9. Answer the following questions.
(a) Use the table to determine the average rate of change of the temperature over the first \(10 \mathrm{~min}\).
(b) Compute the average rate of change of the temperature over the intervals \(0 \leq t \leq 2,0 \leq t \leq 1\) and \(0 \leq t \leq 0.5\).
(c) Which of your results in (b) would be closest to the "instantaneous" rate of change of the temperature at \(t=0\) ?
2.3. Height and distance dropped. We have defined the variable \(Y(t)=\) height of the object at time \(t\) and the variable \(y(t)\) as the distance dropped by time \(t\).
(a) State the connection between these two variables for a ball whose initial height is \(Y_{0}\).
(b) How is the displacement over some time interval \(a \leq t \leq b\) related between these two ways of describing the motion? (Assume that the ball is in the air throughout this time interval).
2.4. Falling ball. A ball is dropped from height \(Y_{0}=490\) meters above the ground. Its height, \(Y\), at time \(t\) is known to follow the relationship \( Y(t)=Y_{0}-\frac{1}{2} g t^{2}\) where \(g=9.8 \mathrm{~m} / \mathrm{s}^{2}\).
(a) Find the average velocity of the falling ball between \(t=1\) and \(t=2\) seconds.
(b) Find the average velocity between \(t \sec\) and \(t+\varepsilon\) sec where \(0 \leq \varepsilon \leq\) 1 is some small time increment (assume that the ball is in the air during this time interval). (c) Determine the time at which the ball hits the ground.
2.5. Tuna average velocity. Find the average velocity of Tuna 1 over each of the time intervals shown in Table \(2.3\), that is for \(0 \leq t \leq 5 \mathrm{hr}\), \(5 \leq t \leq 10 \mathrm{hr}\), etc.
2.6. Average velocity and secant line. The two points on Figure \(2.8\) through which the secant line is drawn are \((1.3,8.2810)\) and \((1.4,9.6040)\). Find the average velocity over this time interval and then give the equation of the secant line.
2.7. Human Population Growth. Table \(2.5\) gives data for the human population (in billions) over recorded history (with some estimates where data was not available).

Table 2.5: The human population (billions) over the years AD 1 to AD 2020.
Note: human population growth is further studied in Chapter 11.
(a) Plot the human population (in billions) versus time (in years) using graphing software of your choice.
(b) Determine the average rate of change of the human population over the successive time intervals.
(c) Plot the average rate of change versus time (in years) and determine over what time interval that average rate of change was greatest.
(d) Over what period (i.e. time interval) was this average rate of change increasing most rapidly? (hint: you should be able to answer this question either by looking at the graph you have drawn or by calculation)
2.8. Average velocity at time \(t\). A ball is thrown from the top of a building of height \(Y_{0}\). The height of the ball at time \(t\) is given by
\[Y(t)=Y_{0}+v_{0} t-\frac{1}{2} g t^{2} \nonumber \]
where \(h_{0}, v_{0}, g\) are positive constants. Find the average velocity of the ball for the time interval \(0 \leq t \leq 1\) assuming that it is in the air during this whole time interval. Express your answer in terms of the constants given.
2.9. Average rate of change. A certain function takes values given in Table 2.6. Find the average rate of change of the function over the intervals.

Table 2.6: Function values for Exercise 9
(a) \(0 \leq t \leq 0.5\)
(b) \(0 \leq t \leq 1.0\)
(c) \(0.5 \leq t \leq 1.5\)
(d) \(1.0 \leq t \leq 2.0\)
2.10. Average rate of change. Find the average rate of change for each of the following functions over the given interval.
(a) \(y=f(x)=3 x-2\) from \(x=3.3\) to \(x=3.5\).
(b) \(y=f(x)=x^{2}+4 x\) over \([0.7,0.85]\).
(c) \(y=-\frac{4}{x}\) and \(x\) changes from \(0.75\) to \(0.5\).
2.11. Trig mini-review. Consider the table of values of the trigonometric functions \(\sin (x)\) and \(\cos (x)\) found in Table \(2.7\).
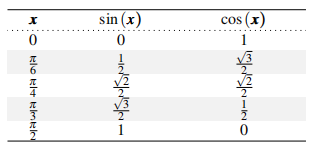
Table 2.7: Table of sine and cosine values
For the following, express your answer in terms of square roots and \(\pi\). Do not compute decimal expressions.
(a) Find the average rate of change of \(\sin (x)\) over \(0 \leq x \leq \pi / 4\).
(b) Find the average rate of change of \(\cos (x)\) over \(\pi / 4 \leq x \leq \pi / 3\).
(c) Is there an interval over which the functions \(\sin (x)\) and \(\cos (x)\) have the same average rate of change? (hint: consider the graphs of these functions over one whole cycle, e.g. for \(0 \leq x \leq 2 \pi\). Where do they intersect?)
Note: trigonometry is reviewed in Appendix \(\mathrm{F}\) and studied further in Chapters 14 and 15.
2.12. Secant and tangent lines. Let \(y=f(x)=1+x^{2}\) and consider the point \((1,2)\) on its graph and some point nearby, for example
\[\left(1+h, 1+(1+h)^{2}\right) . \nonumber \]
(a) Find the slope of a secant line connecting these two points.
(b) The slope of a tangent line to \(y=f(x)\) is the derivative \(f^{\prime}(x)\). Use the slope you calculated in (a) to determine what the slope of the tangent line to the curve at \((1,2)\) would be.
(c) Find the equation of the tangent line through the point \((1,2)\).
2.13. Secant and tangent lines. Given the function \(y=f(x)=2 x^{3}+x^{2}-4\),
(a) find the slope of the secant line joining the points \((4, f(4))\) and \((4+\) \(h, f(4+h))\) on its graph, where \(h\) is a small positive number, then
(b) find the slope of the tangent line to the curve at \((4, f(4))\).
2.14. Average rate of change. Consider the function \(f(x)=x^{2}-4 x\) and the point \(x_{0}=1\).
(a) Sketch the graph of the function.
(b) Find the average rate of change over the intervals \([1,3],[-1,1]\), \([1,1.1],[0.9,1]\) and \([1-h, 1]\), where \(h\) is some small positive number.
(c) Find \(f^{\prime}(1)\).
2.15. Approximation using a tangent line. Let \(y=f(x)=x^{2}-2 x+3\).
(a) Find the average rate of change over the interval \([2,2+h]\).
(b) Find \(f^{\prime}(2)\). (c) Using only the information from (a), (b) and \(f(2)=3\), approximate the value of \(y\) when \(x=1.99\), without substituting \(x=1.99\) into \(f(x)\)
2.16. Average rate of change. For the following, express your answer in terms of square roots and \(\pi\). Do not compute the decimal expressions. Note that
\[\tan (x)=\frac{\sin (x)}{\cos (x)}, \quad \cot (x)=\frac{\cos (x)}{\sin (x)} \nonumber \]
(a) Find the average rate of change of \(\tan (x)\) over \(0 \leq x \leq \frac{\pi}{4}\).
(b) Find the average rate of change of \(\cot (x)\) over \(\frac{\pi}{4} \leq x \leq \frac{\pi}{3}\).
2.17. Secant and tangent lines.
(a) Find the slope of the secant line to the graph of \(y=2 / x\) between the points \(x=1\) and \(x=2\).
(b) Find the average rate of change of \(y\) between \(x=1\) and \(x=1+\varepsilon\) where \(\varepsilon>0\) is some positive constant.
(c) What happens to this slope as \(\varepsilon \rightarrow 0\) ?
(d) Find the equation of the tangent line to the curve \(y=2 / x\) at the point \(x=1\).
2.18. Velocity and average velocity. For each of the following motions where \(s\) is measured in meters and \(t\) is measured in seconds, find the velocity at time \(t=2\) and the average velocity over the given interval.
(a) \(s=3 t^{2}+5\) and \(t\) changes from 2 to \(3 s\).
(b) \(s=t^{3}-3 t^{2}\) from \(t=3 s\) to \(t=5 s\).
(c) \(s=2 t^{2}+5 t-3\) on \([1,2]\).
2.19. Acceleration. The velocity \(v\) of an object attached to a spring is given by \(v=-A \omega \sin (\omega t+\delta)\), where \(A, \omega\) and \(\delta\) are constants. Find the average change in velocity ("acceleration") of the object for the time interval \(0 \leq t \leq \frac{2 \pi}{\omega}\)
Note: acceleration is further explored in Chapter 4.
2.20. Definition of the derivative. Use the definition of derivative to calculate the derivative of the function
\[f(x)=\frac{1}{x+1} . \nonumber \]
Note: intermediate steps are required.