
2.1: Ball Toss Project
- Page ID
- 88625

\( \newcommand{\vecs}[1]{\overset { \scriptstyle \rightharpoonup} {\mathbf{#1}} } \) \( \newcommand{\vecd}[1]{\overset{-\!-\!\rightharpoonup}{\vphantom{a}\smash {#1}}} \)\(\newcommand{\id}{\mathrm{id}}\) \( \newcommand{\Span}{\mathrm{span}}\) \( \newcommand{\kernel}{\mathrm{null}\,}\) \( \newcommand{\range}{\mathrm{range}\,}\) \( \newcommand{\RealPart}{\mathrm{Re}}\) \( \newcommand{\ImaginaryPart}{\mathrm{Im}}\) \( \newcommand{\Argument}{\mathrm{Arg}}\) \( \newcommand{\norm}[1]{\| #1 \|}\) \( \newcommand{\inner}[2]{\langle #1, #2 \rangle}\) \( \newcommand{\Span}{\mathrm{span}}\) \(\newcommand{\id}{\mathrm{id}}\) \( \newcommand{\Span}{\mathrm{span}}\) \( \newcommand{\kernel}{\mathrm{null}\,}\) \( \newcommand{\range}{\mathrm{range}\,}\) \( \newcommand{\RealPart}{\mathrm{Re}}\) \( \newcommand{\ImaginaryPart}{\mathrm{Im}}\) \( \newcommand{\Argument}{\mathrm{Arg}}\) \( \newcommand{\norm}[1]{\| #1 \|}\) \( \newcommand{\inner}[2]{\langle #1, #2 \rangle}\) \( \newcommand{\Span}{\mathrm{span}}\)\(\newcommand{\AA}{\unicode[.8,0]{x212B}}\)
Purpose of the project: get familiar with the idea of creating a velocity function based on position data
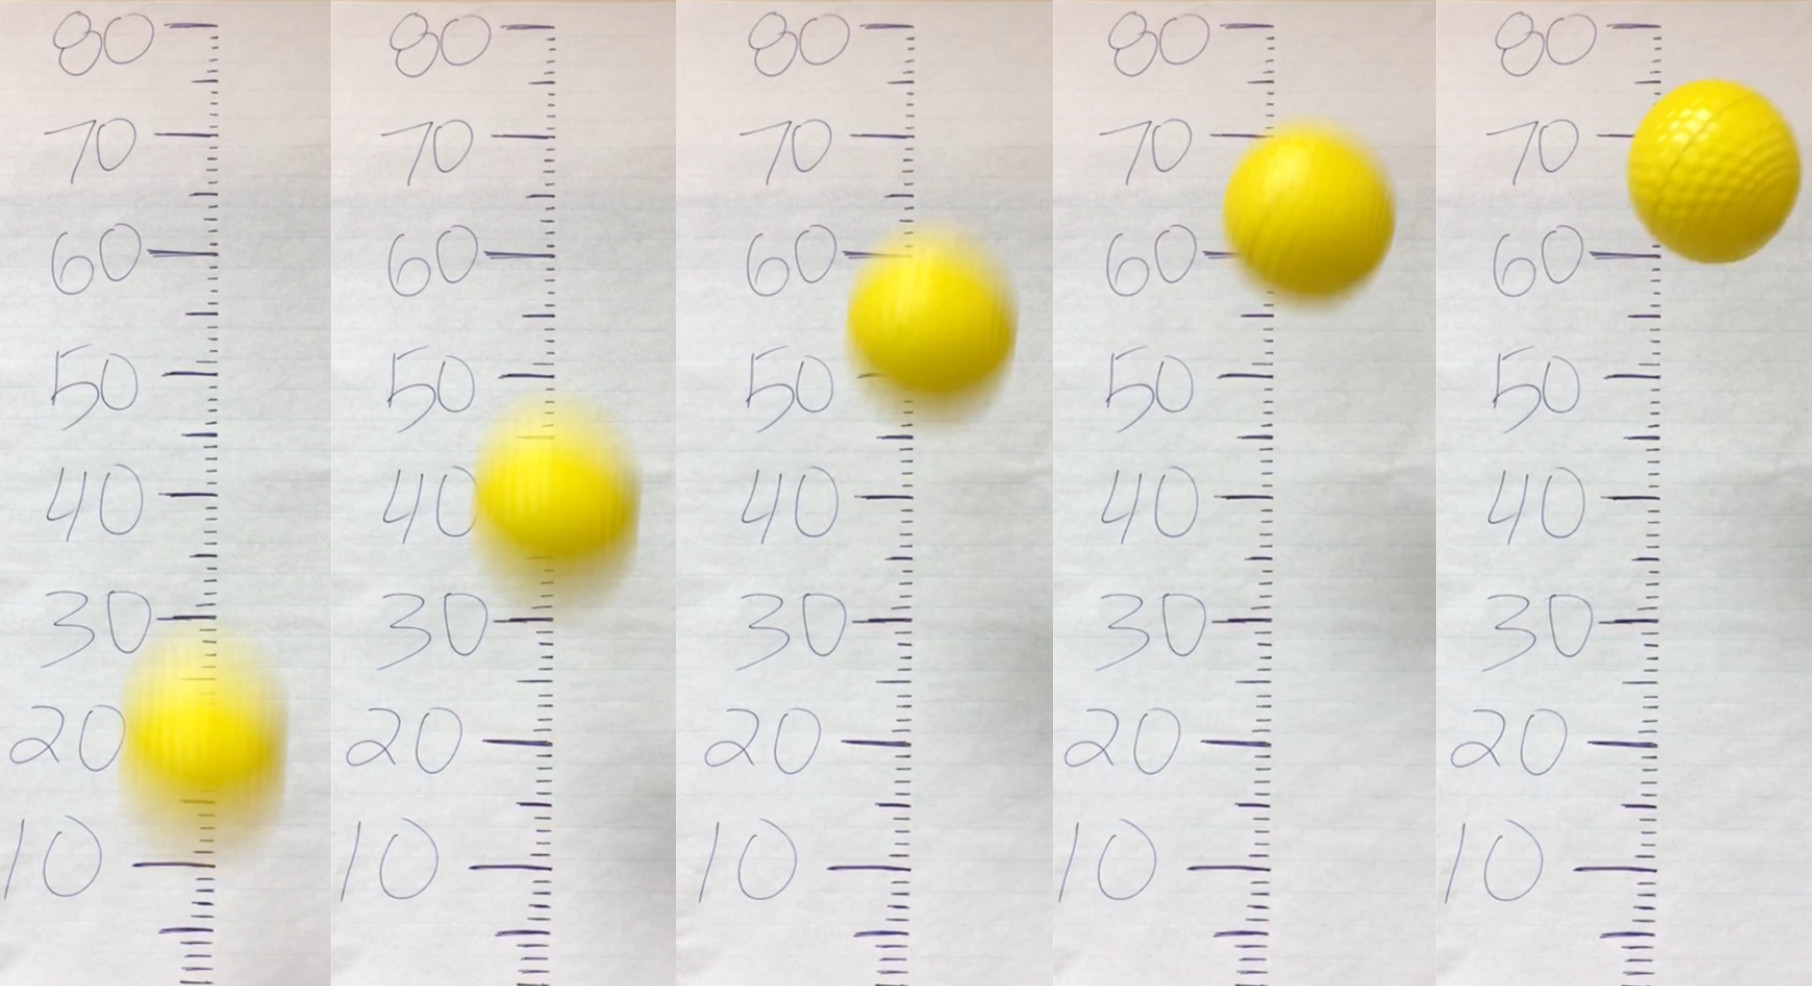
Above are frames from a video of a simple ball toss. Every other frame from the 30 frames per second video is shown, so the time between the frames is approximately  of a second.
- Fill in the position data for each time in the table below. Velocity is usually defined as \(\frac{\text{Position}}{\text{Time}}\). How could you calculate velocities for each data point? Fill these in as well.
Time (s) Position (cm) Velocity (cm/s) \(0\) \(\frac{1}{15}\) \(\frac{2}{15}\) \(\frac{3}{15}\) \(\frac{4}{15}\) - Create two graphs, either by hand or with graphing software: position versus time, and velocity versus time. In each case, time is the \(x\)-axis, while the \(y\)-axis is position in the first graph and velocity in the second graph. How are the two graphs related?
Going from a position graph to a velocity graph like this is called a derivative, which we’ll talk a lot more about in upcoming chapters.
- While your velocity graph is probably not a perfect line, imagine that it is linear for a second. What is the slope of the velocity graph? This is the rate of acceleration due to gravity, an important quantity in physics.